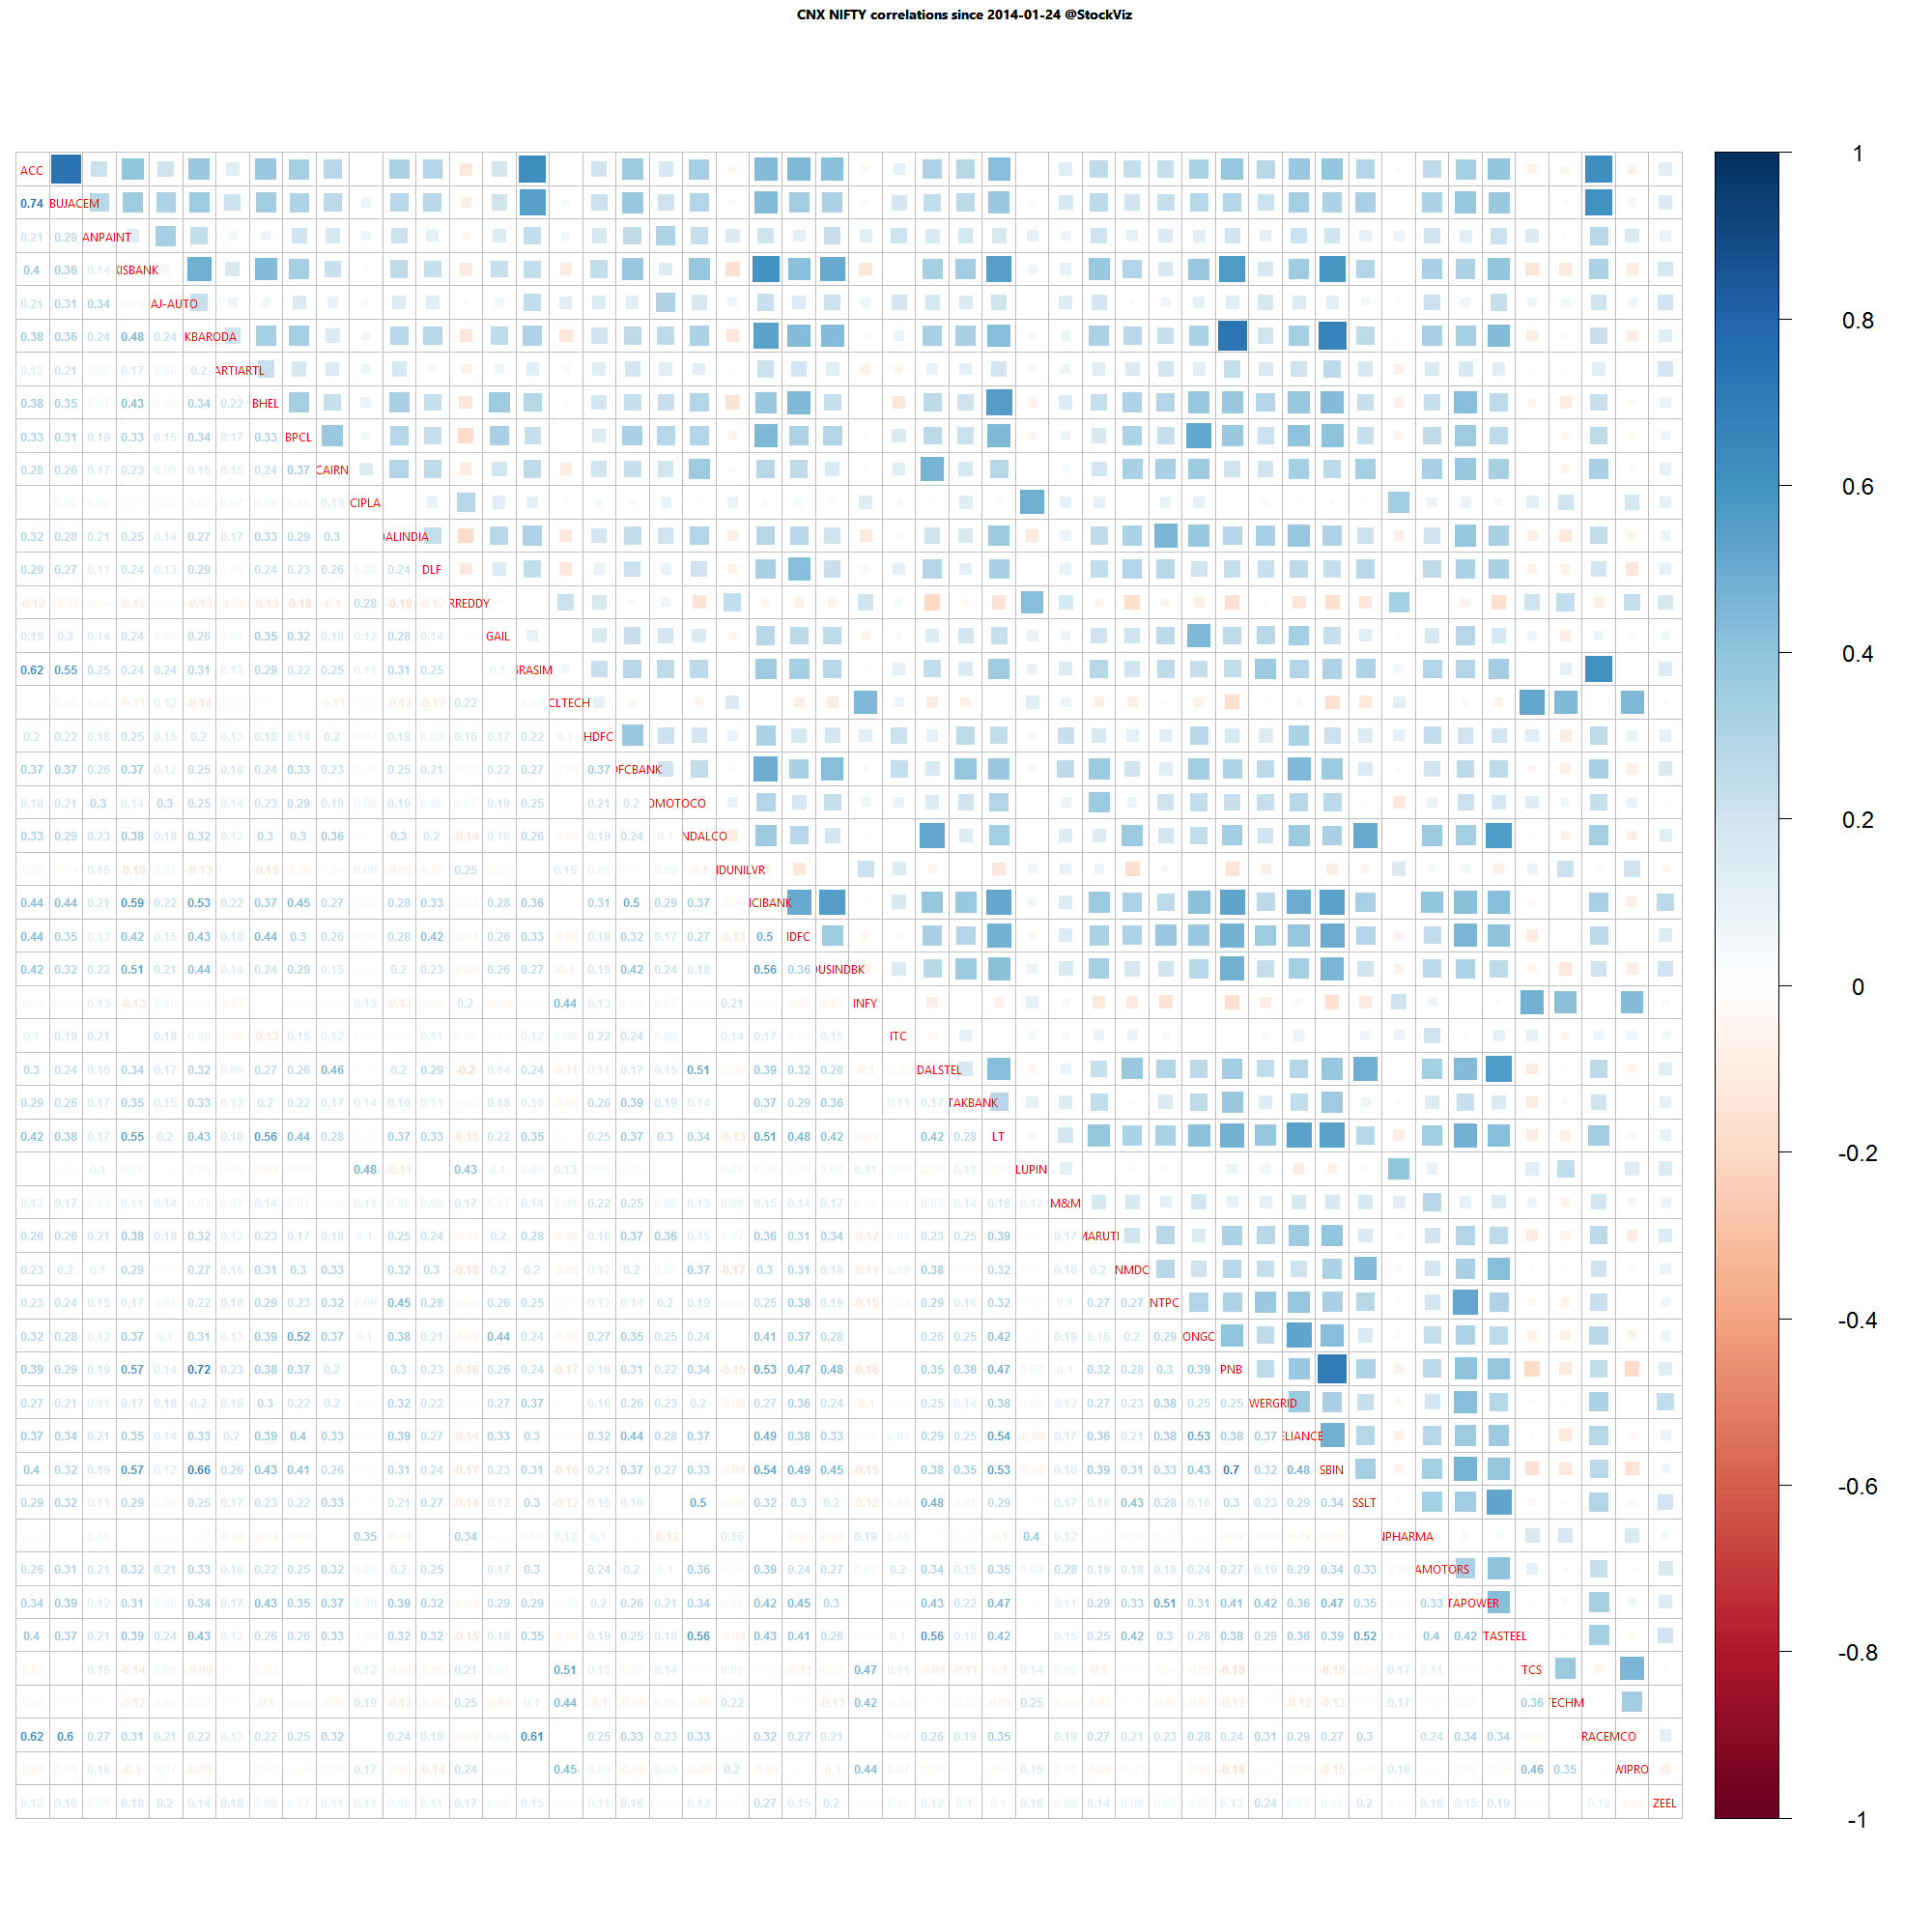
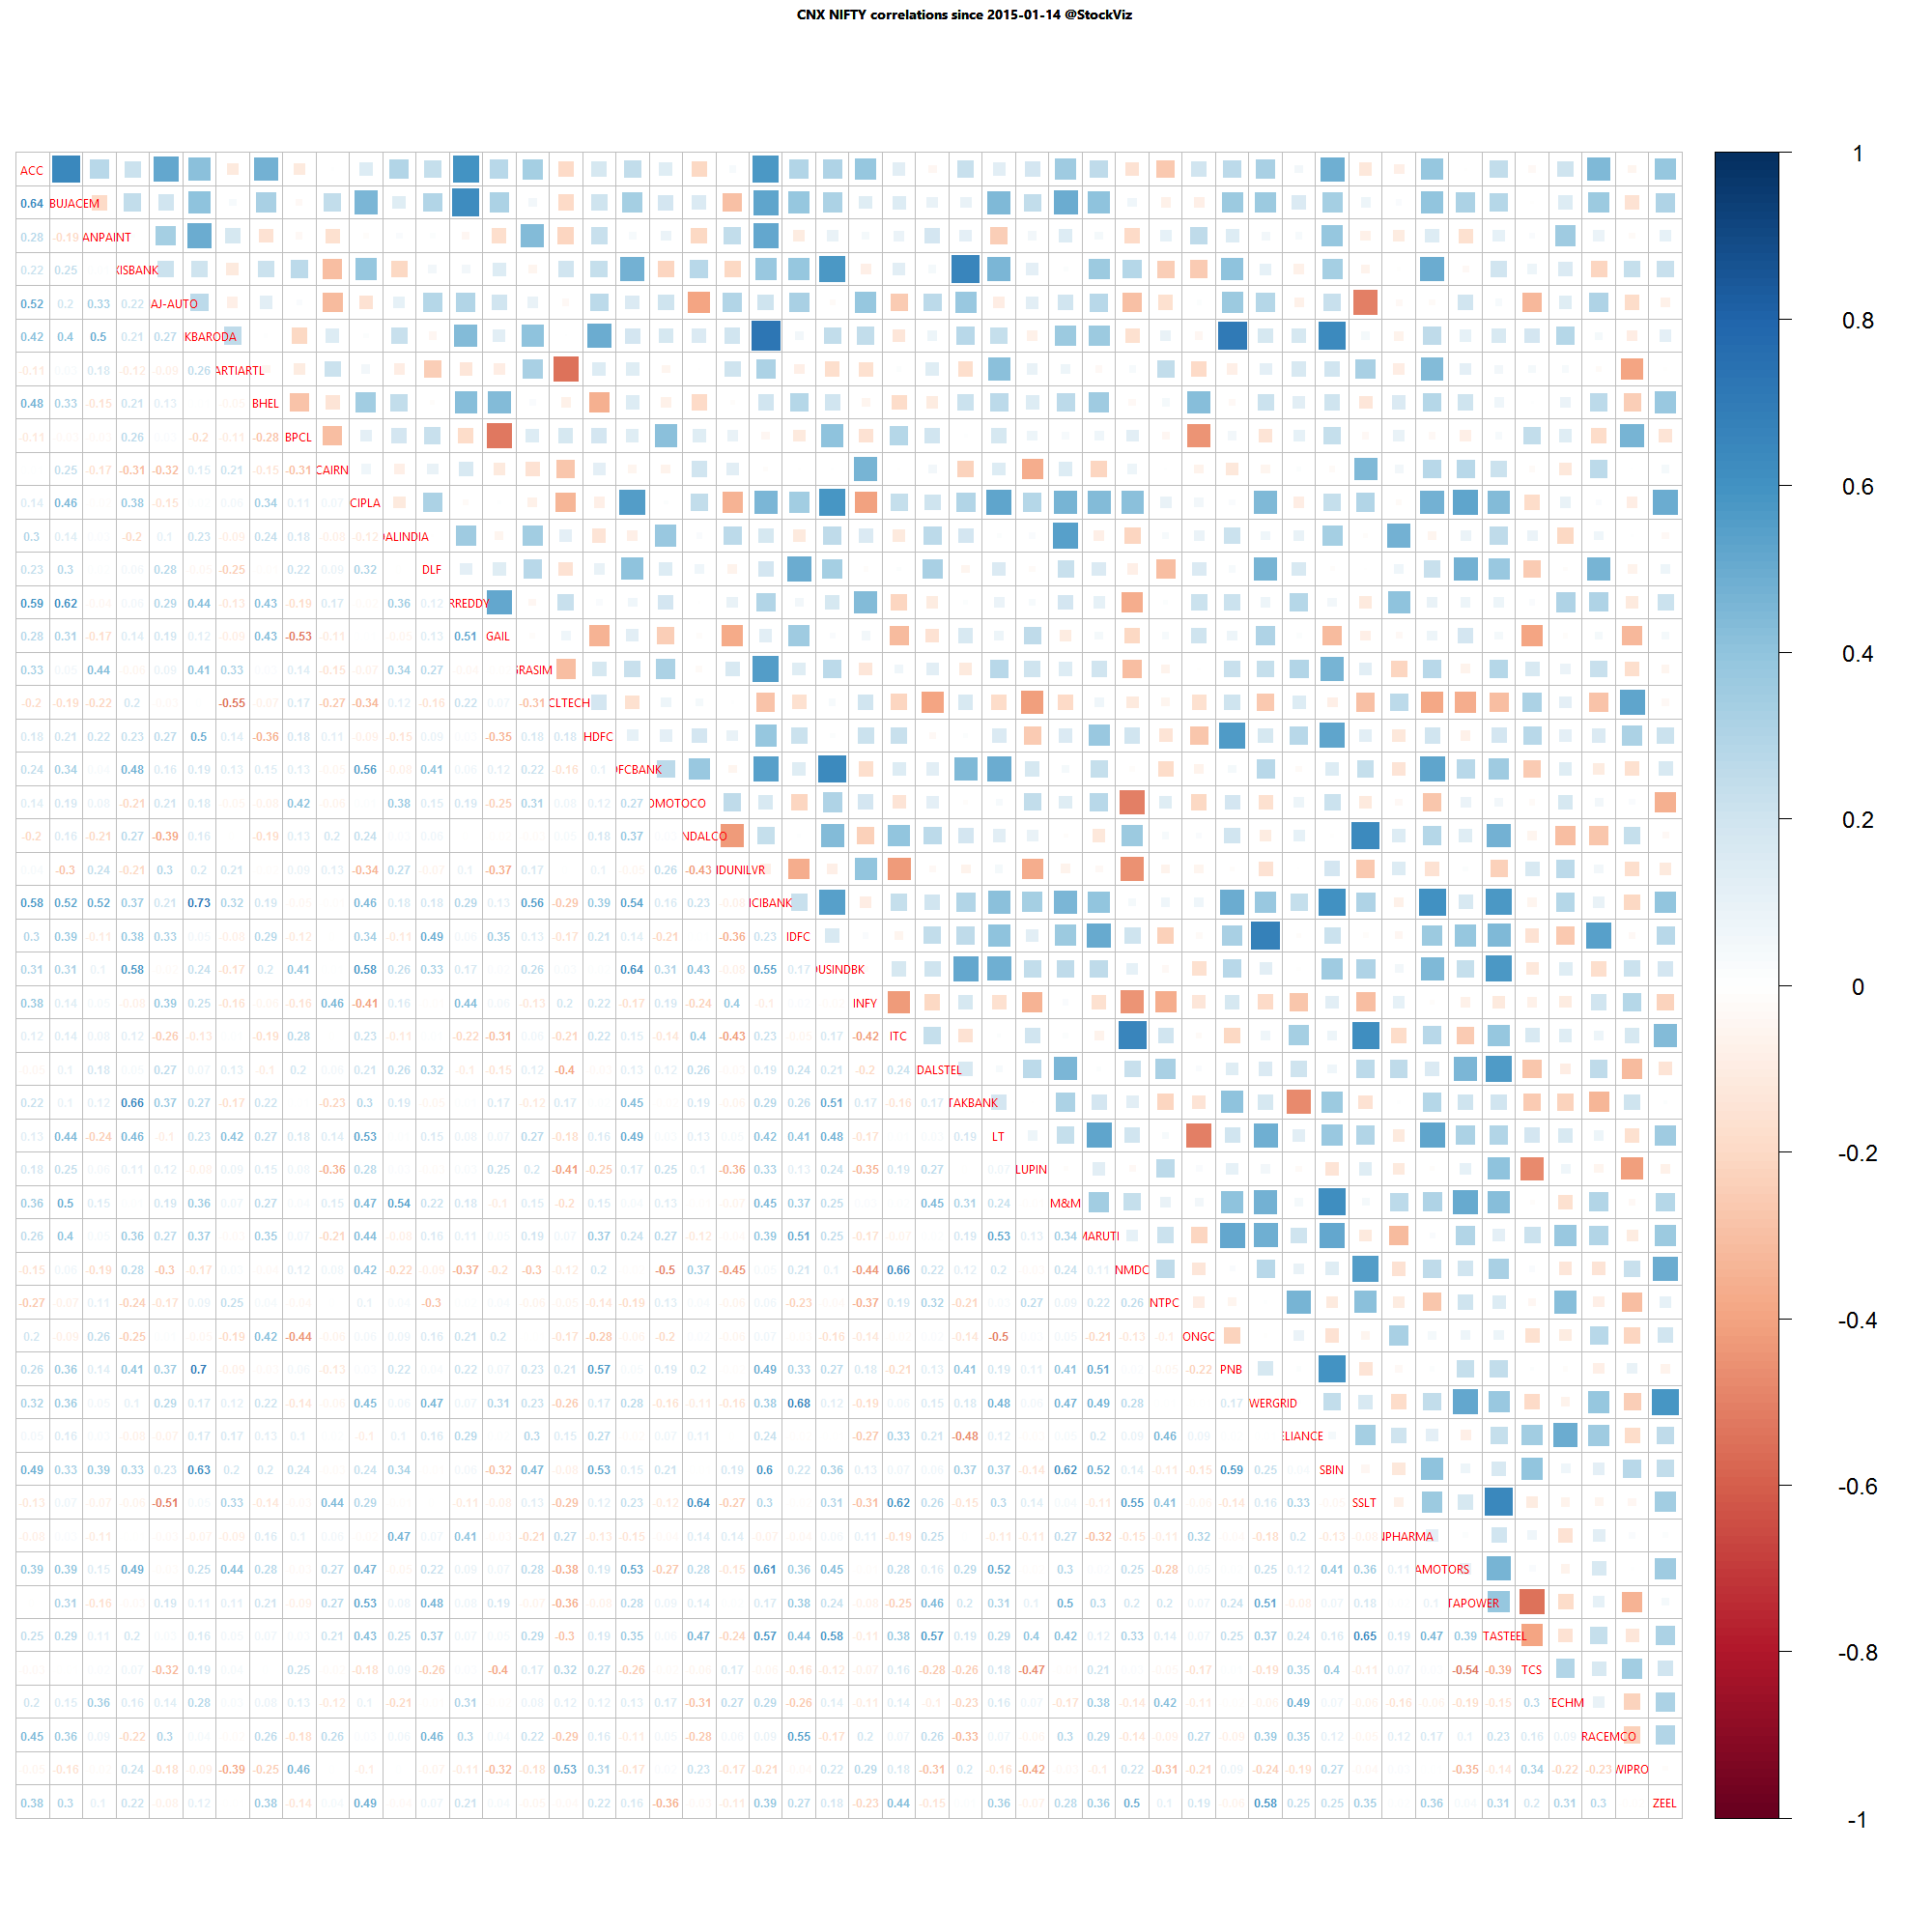
Nifty one year daily return correlations

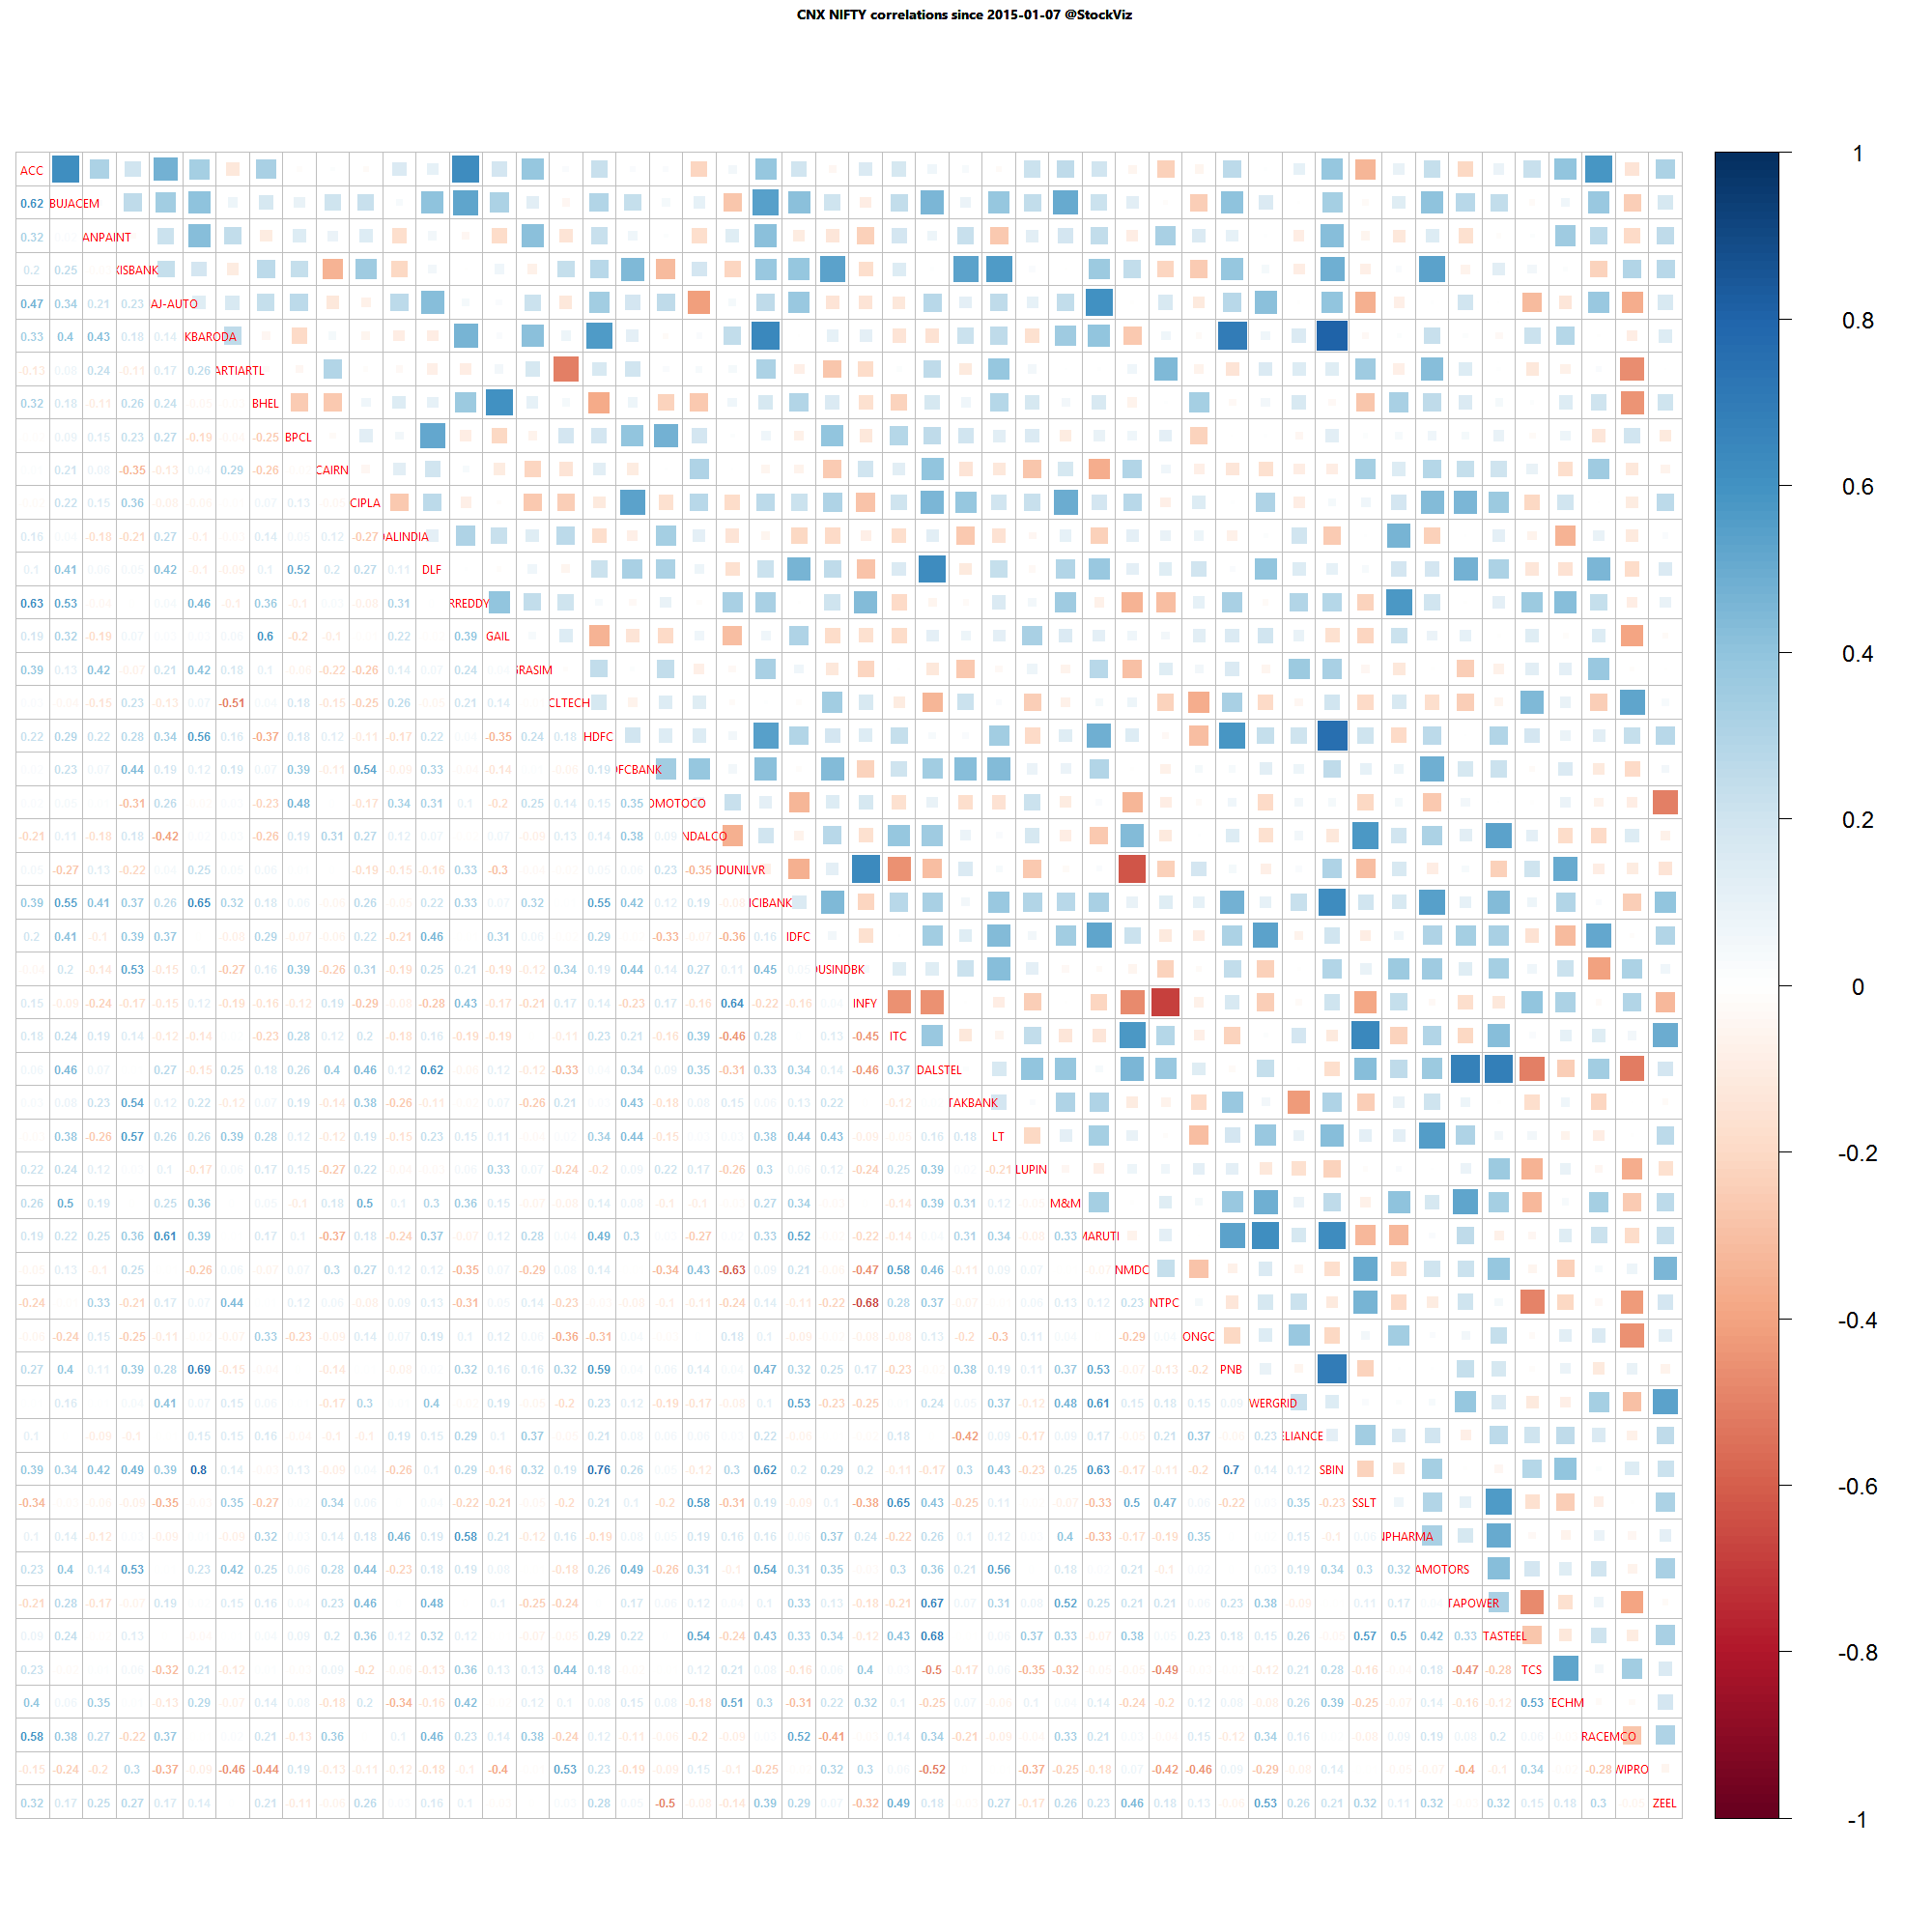
Nifty one month daily return correlations
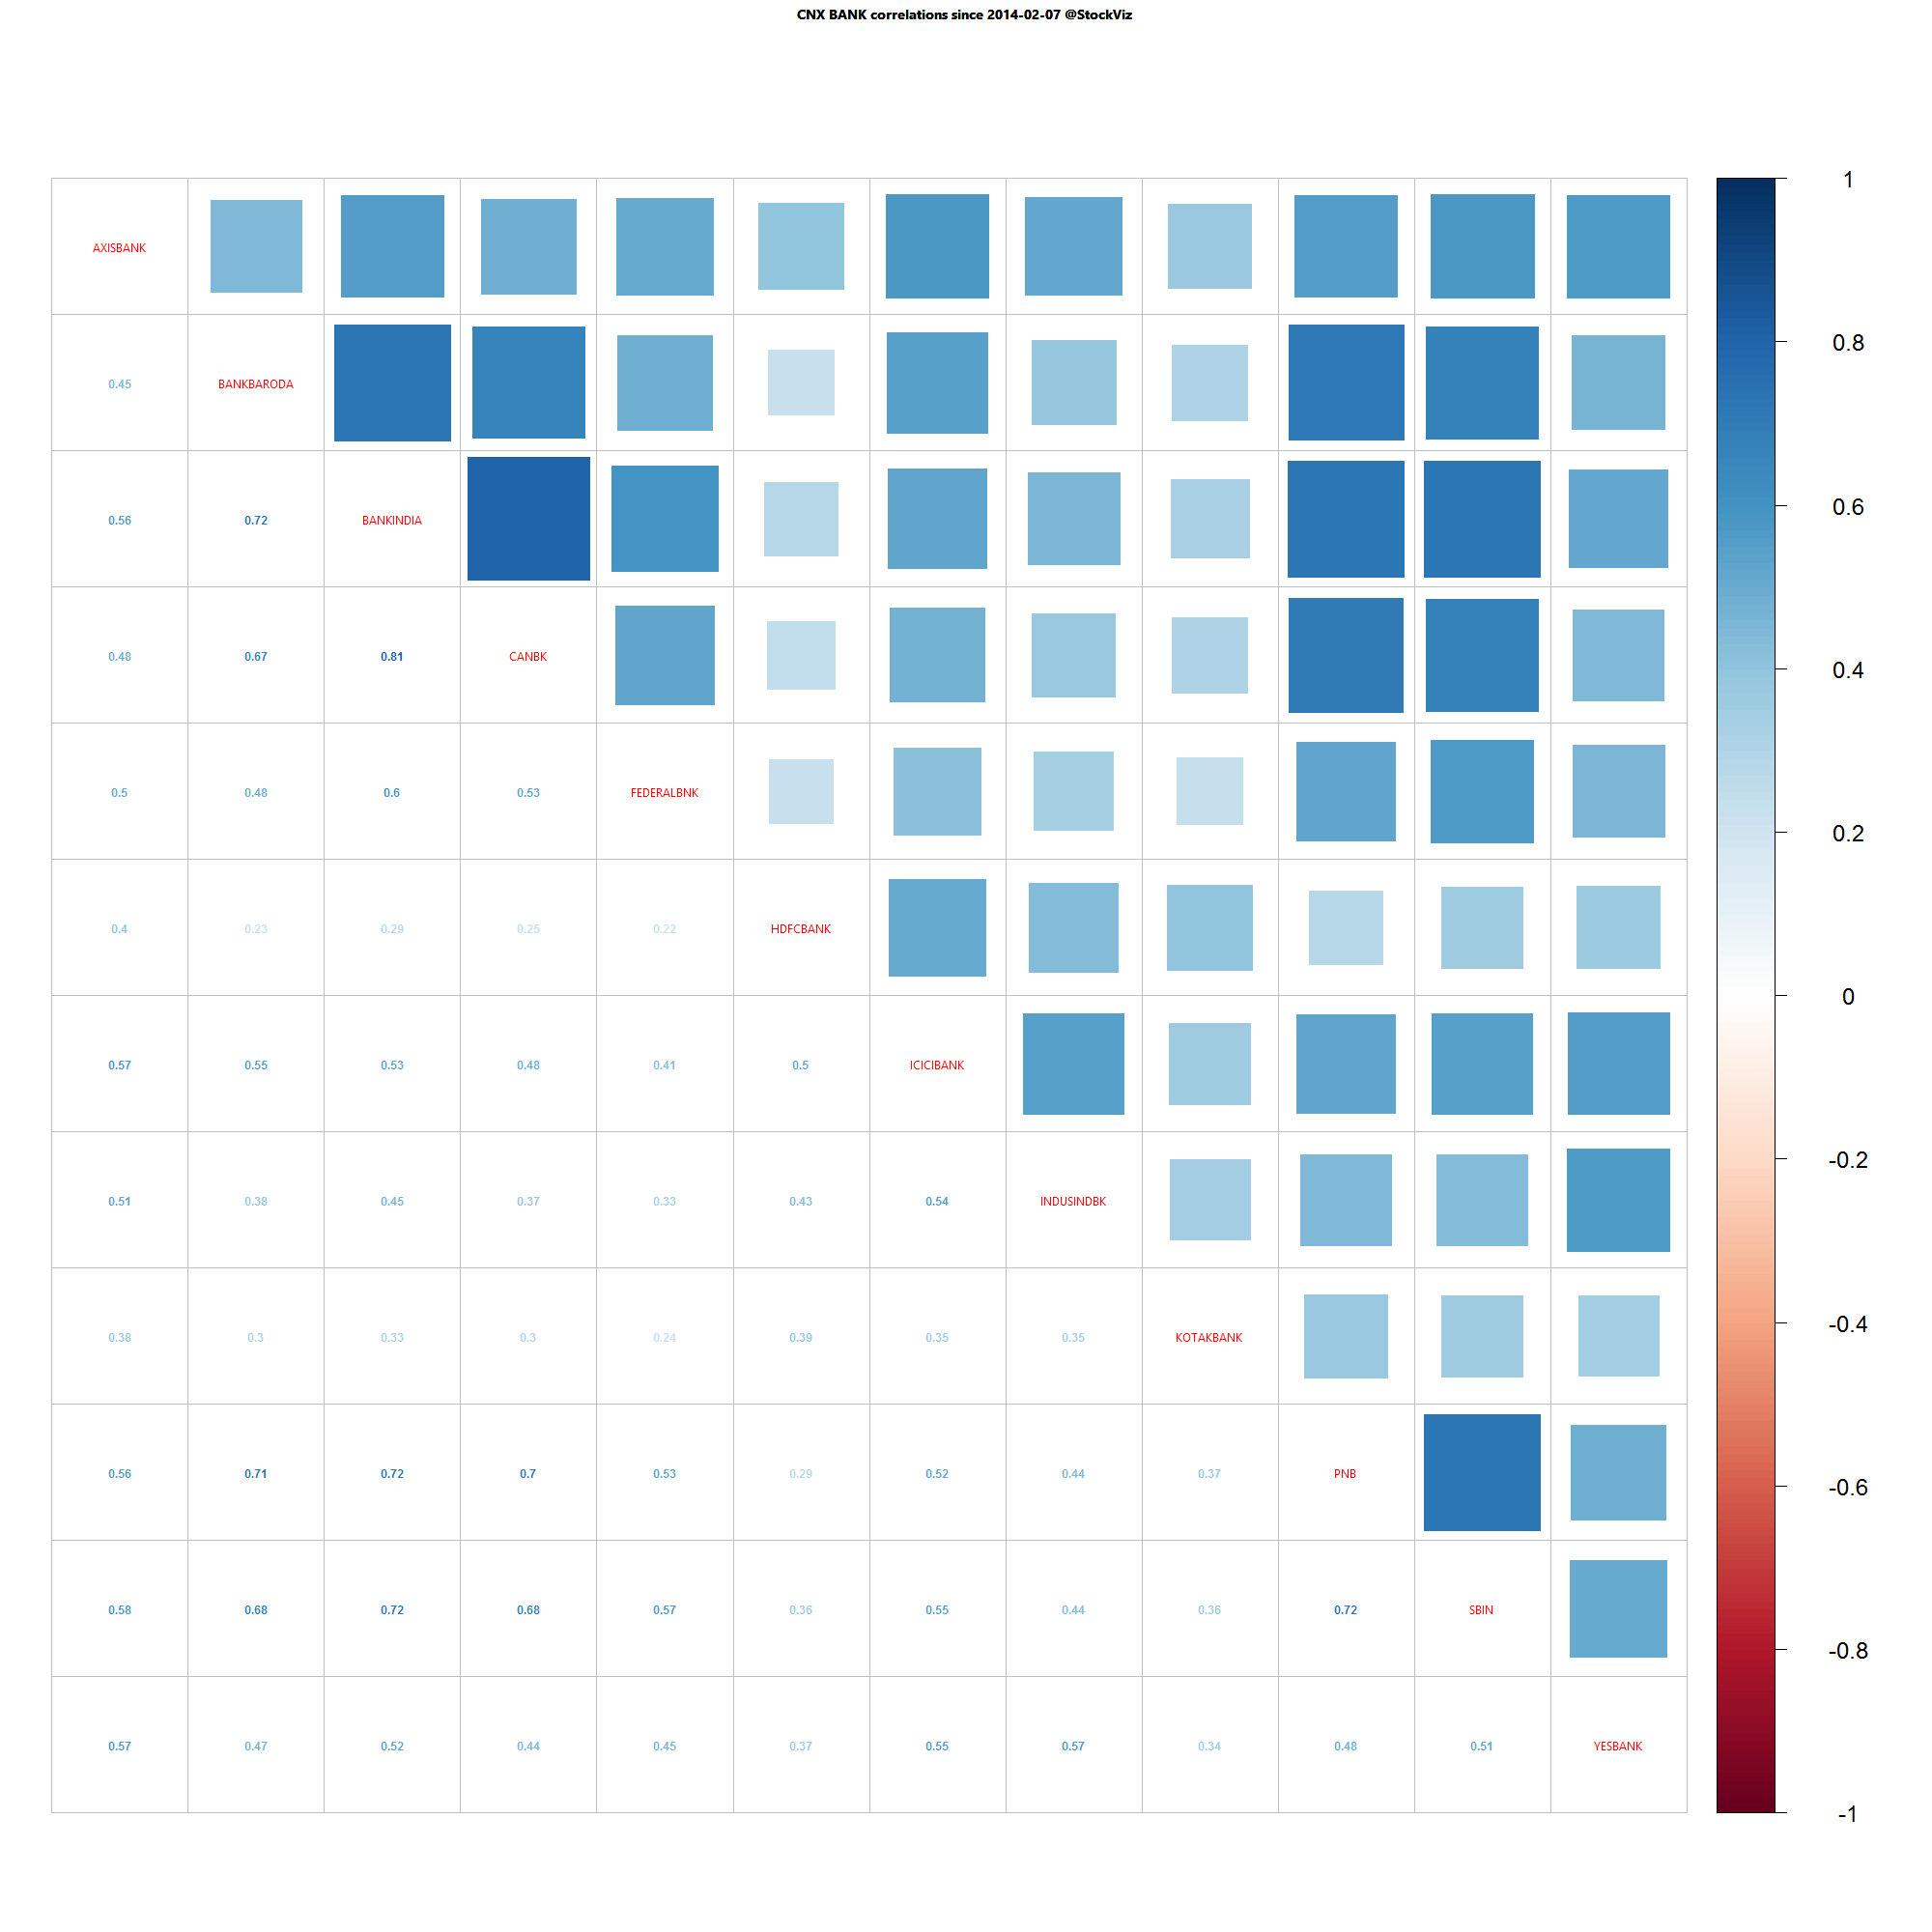
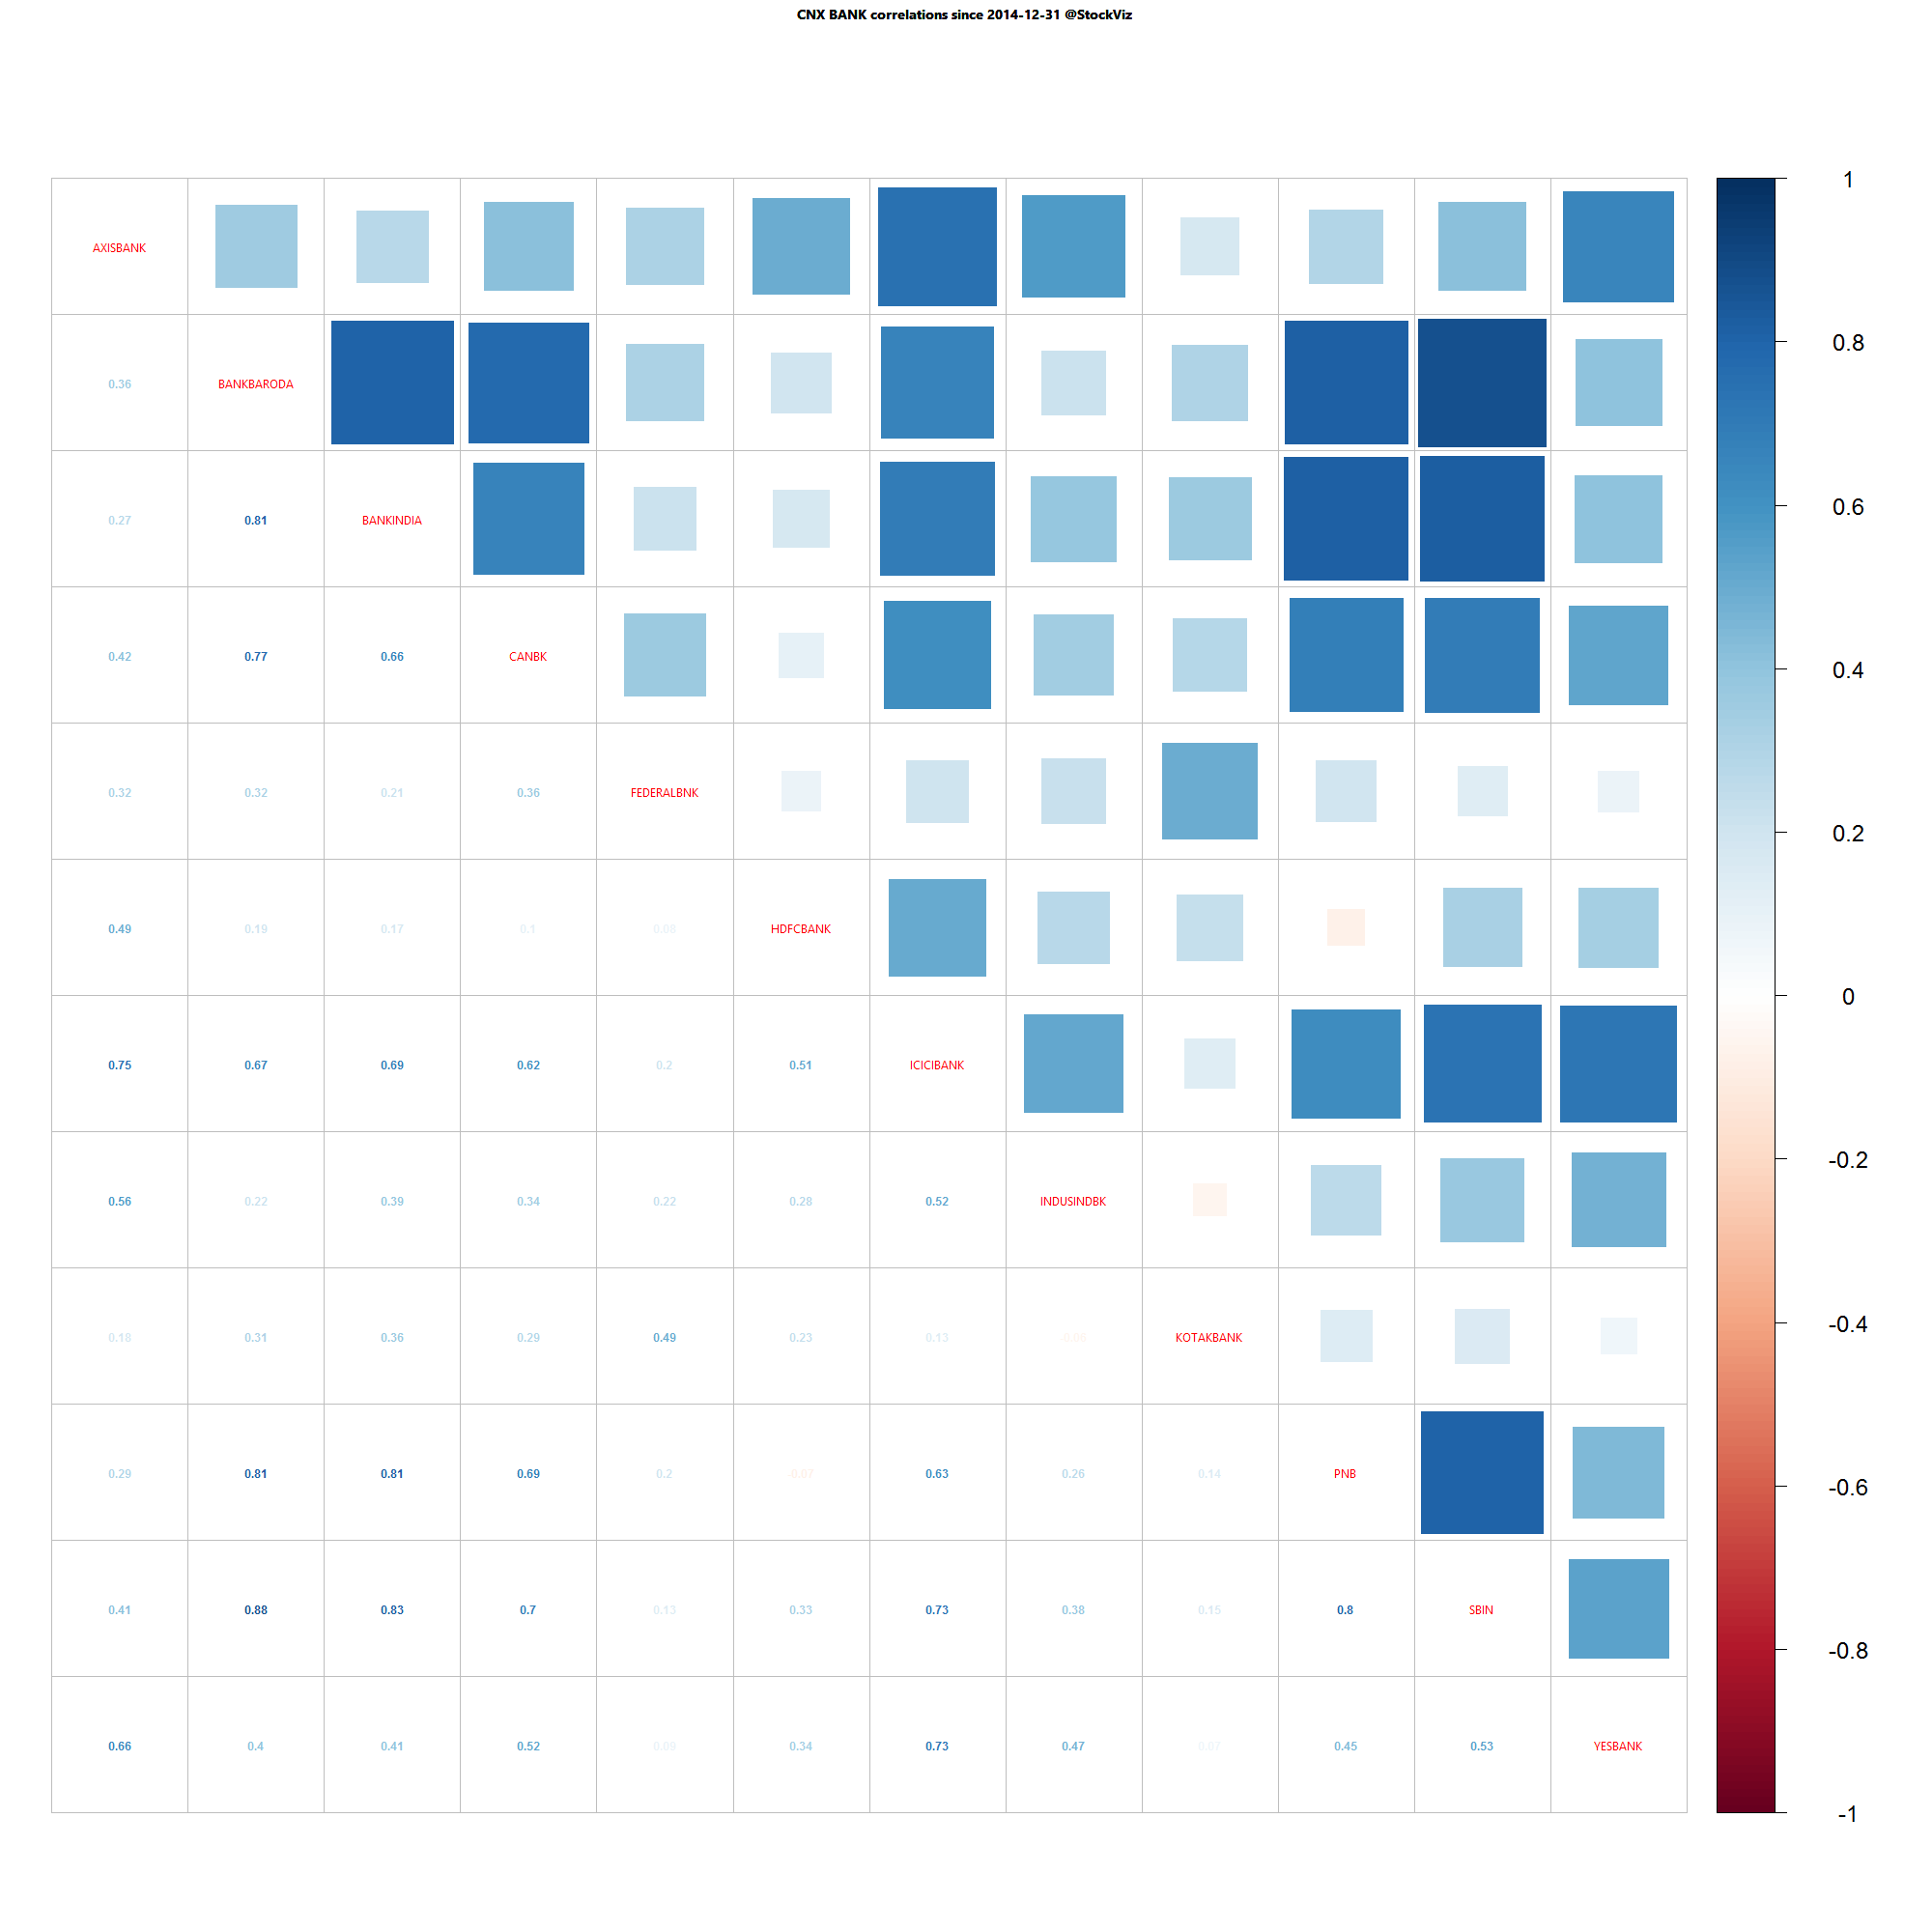
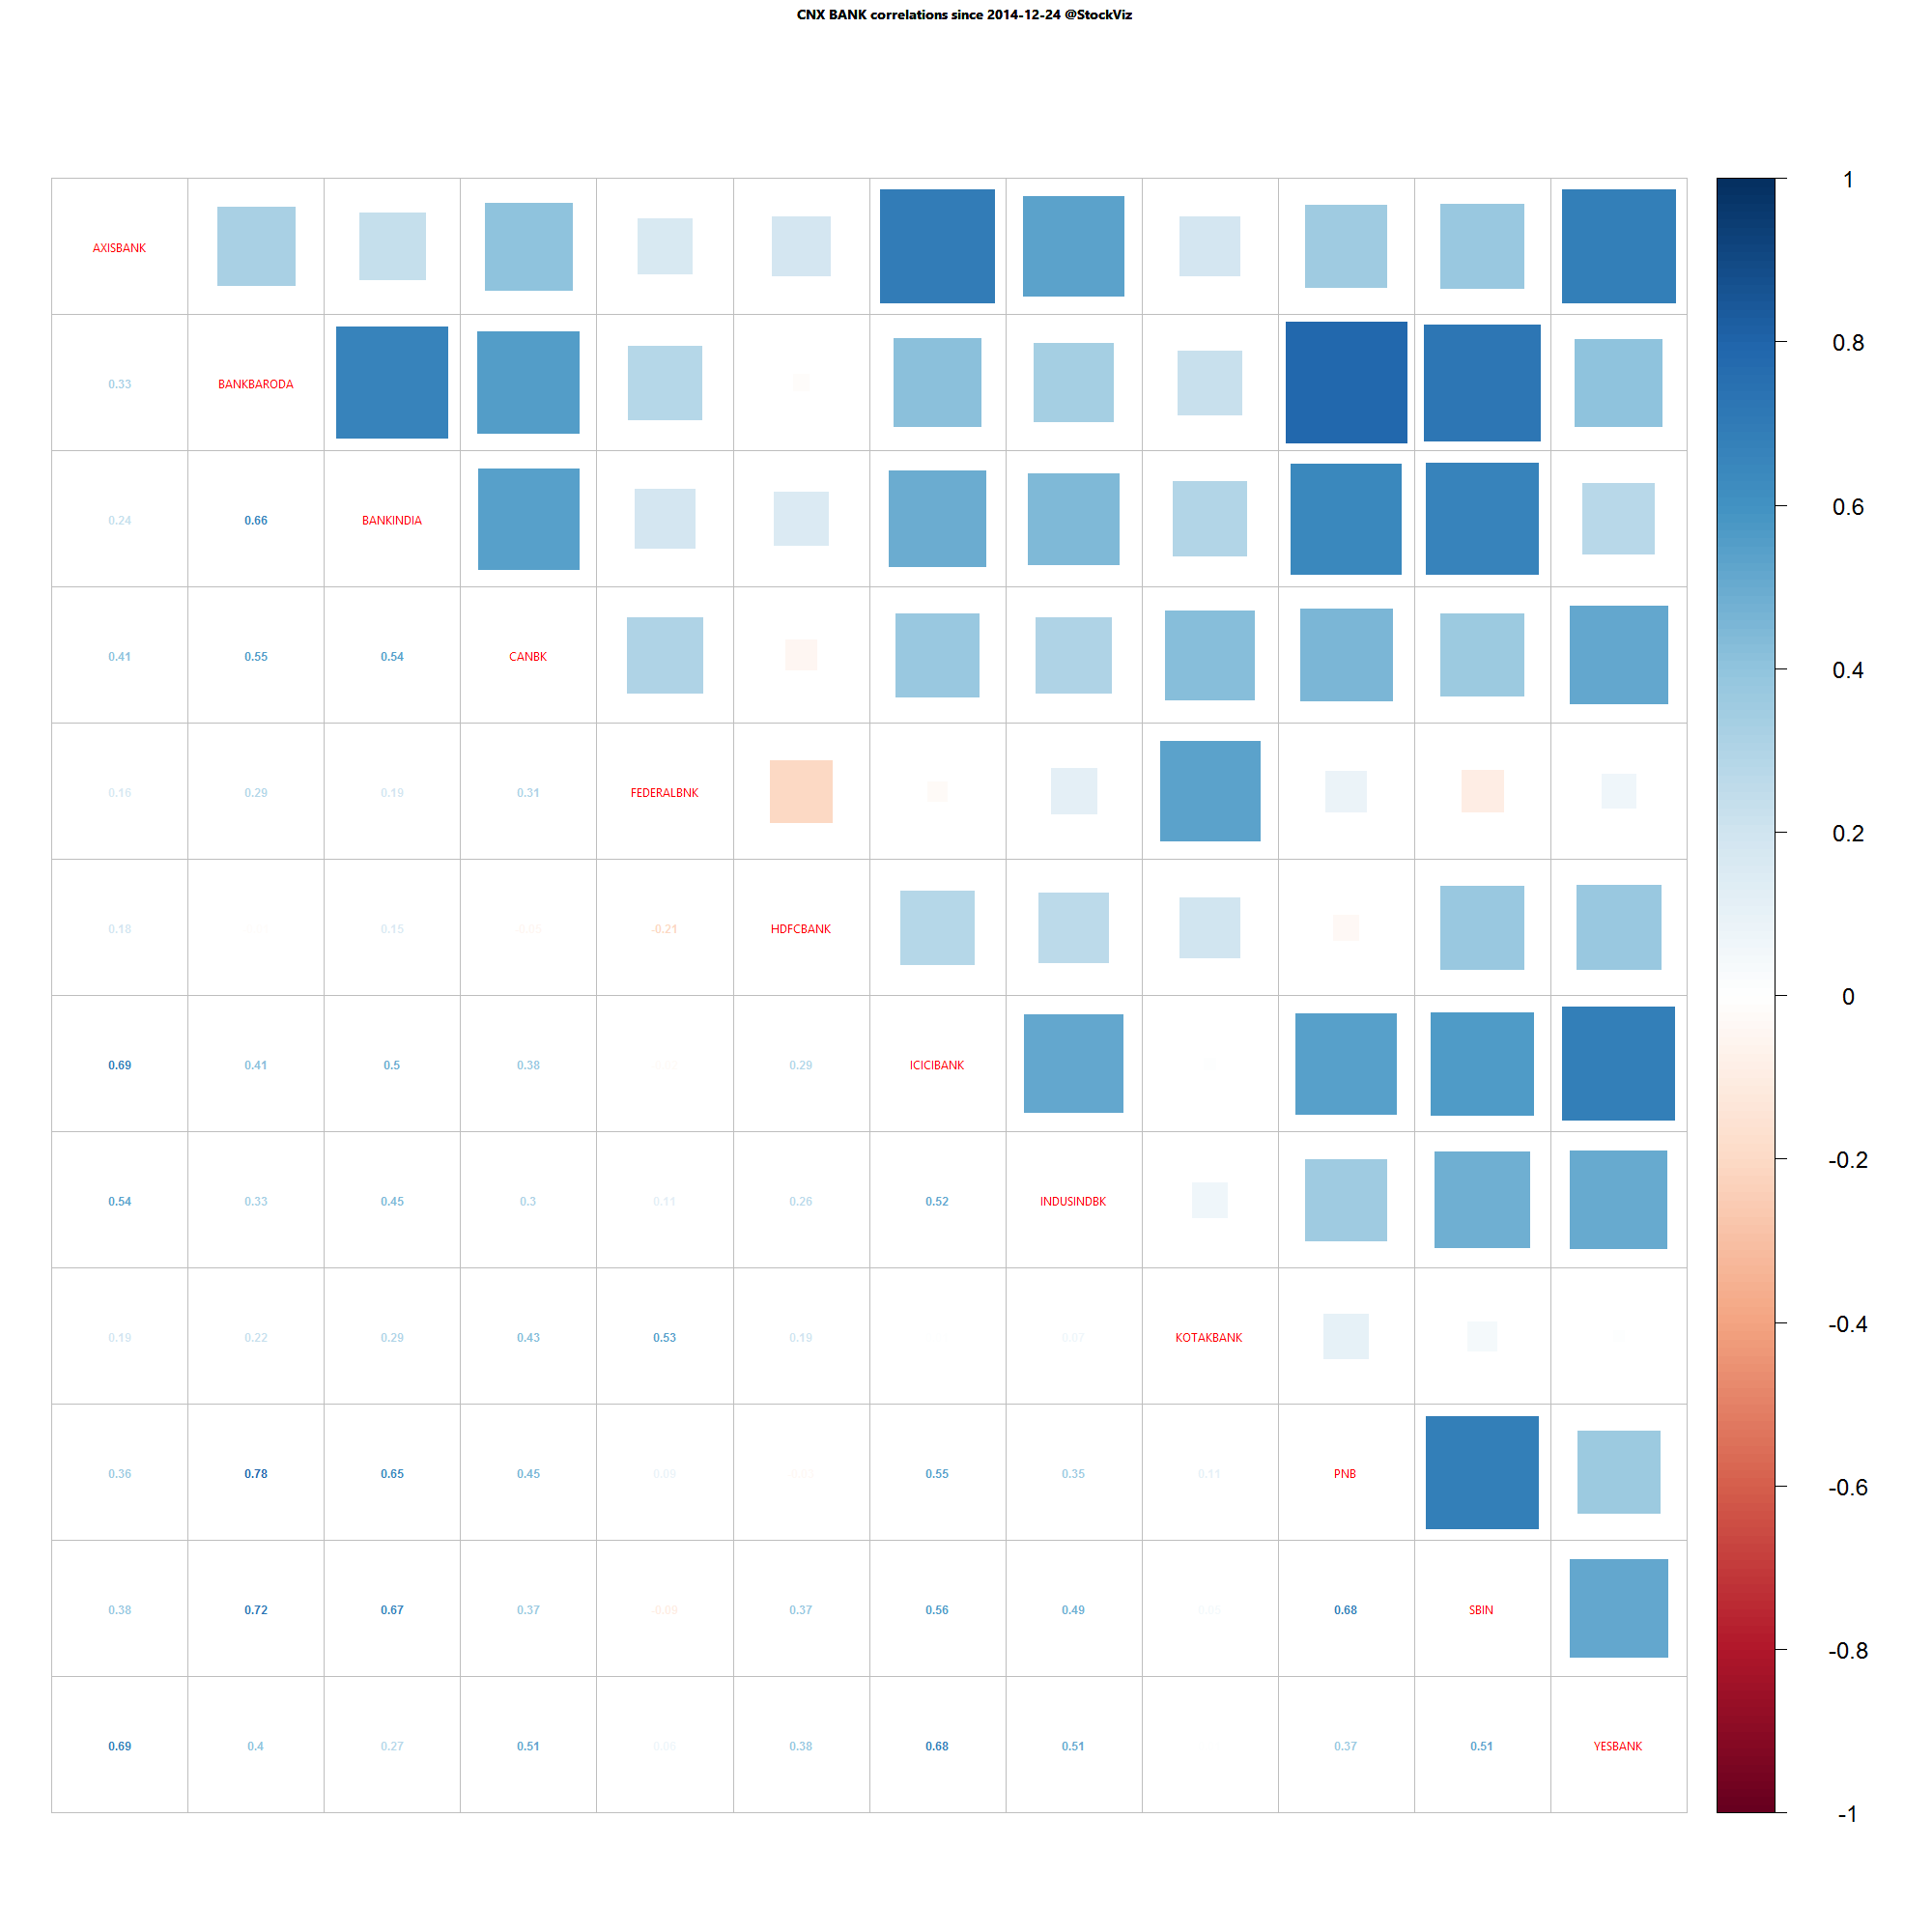
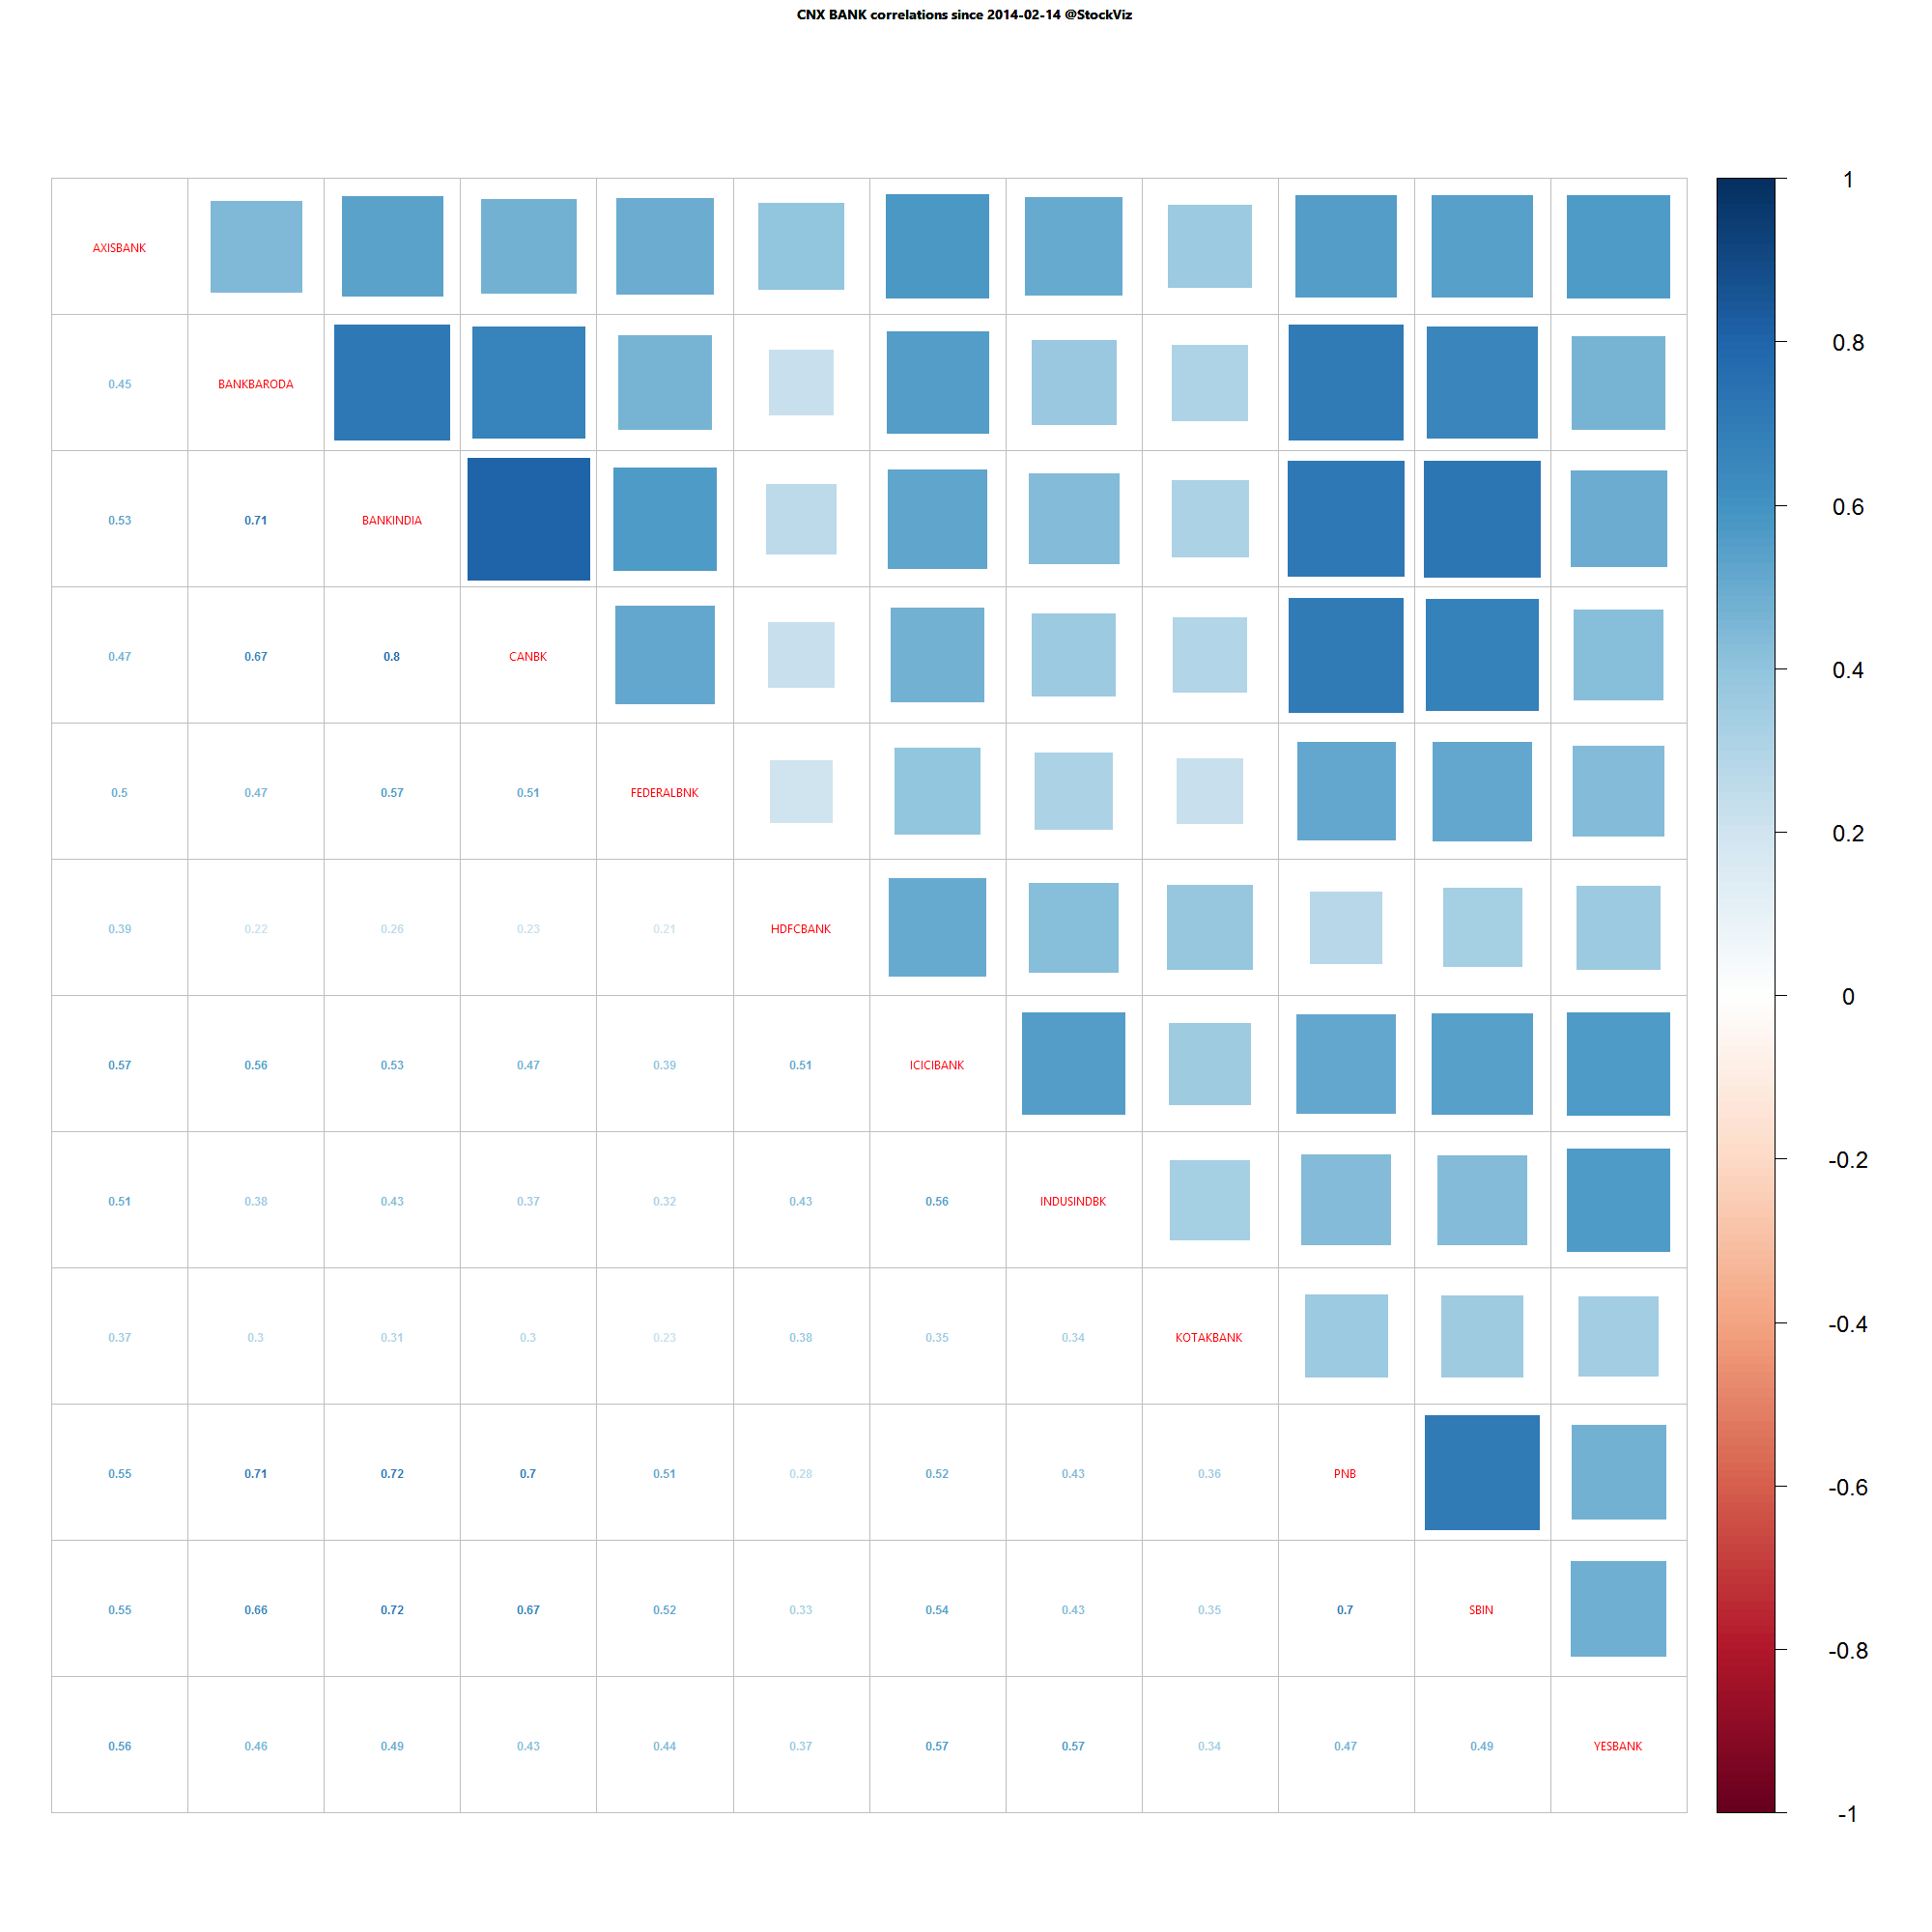
Bank Nifty one year daily return correlations
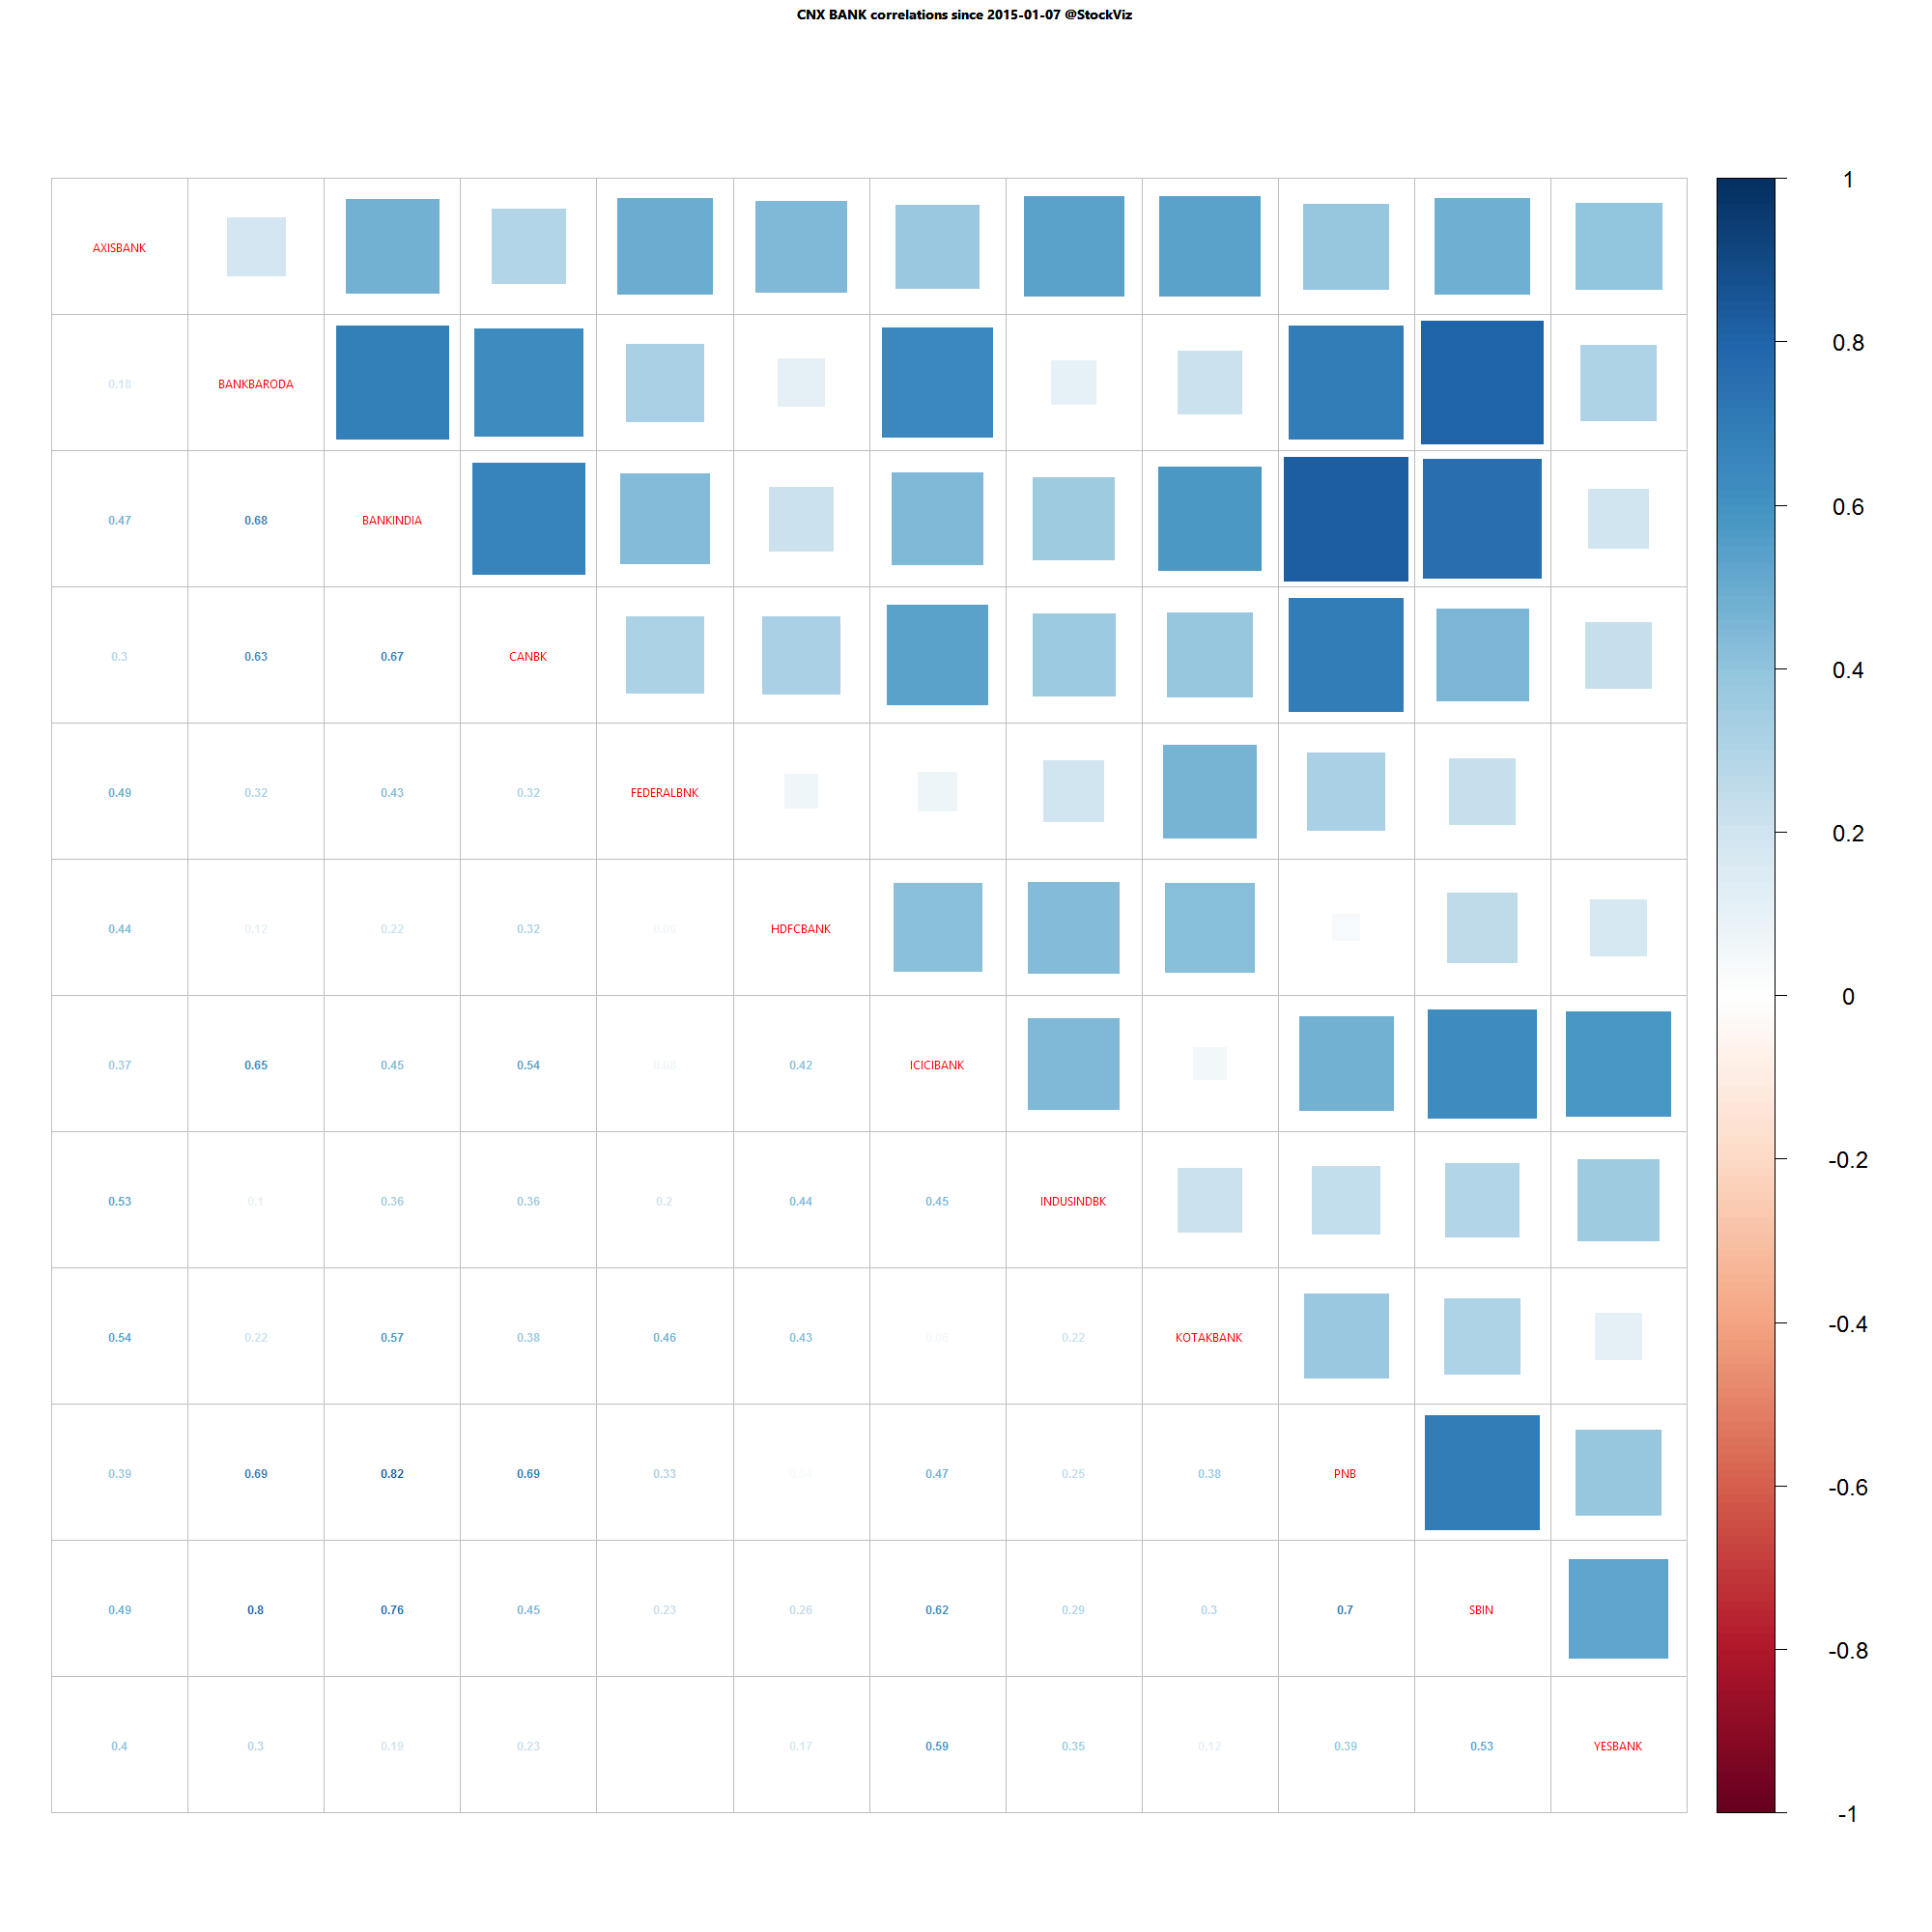
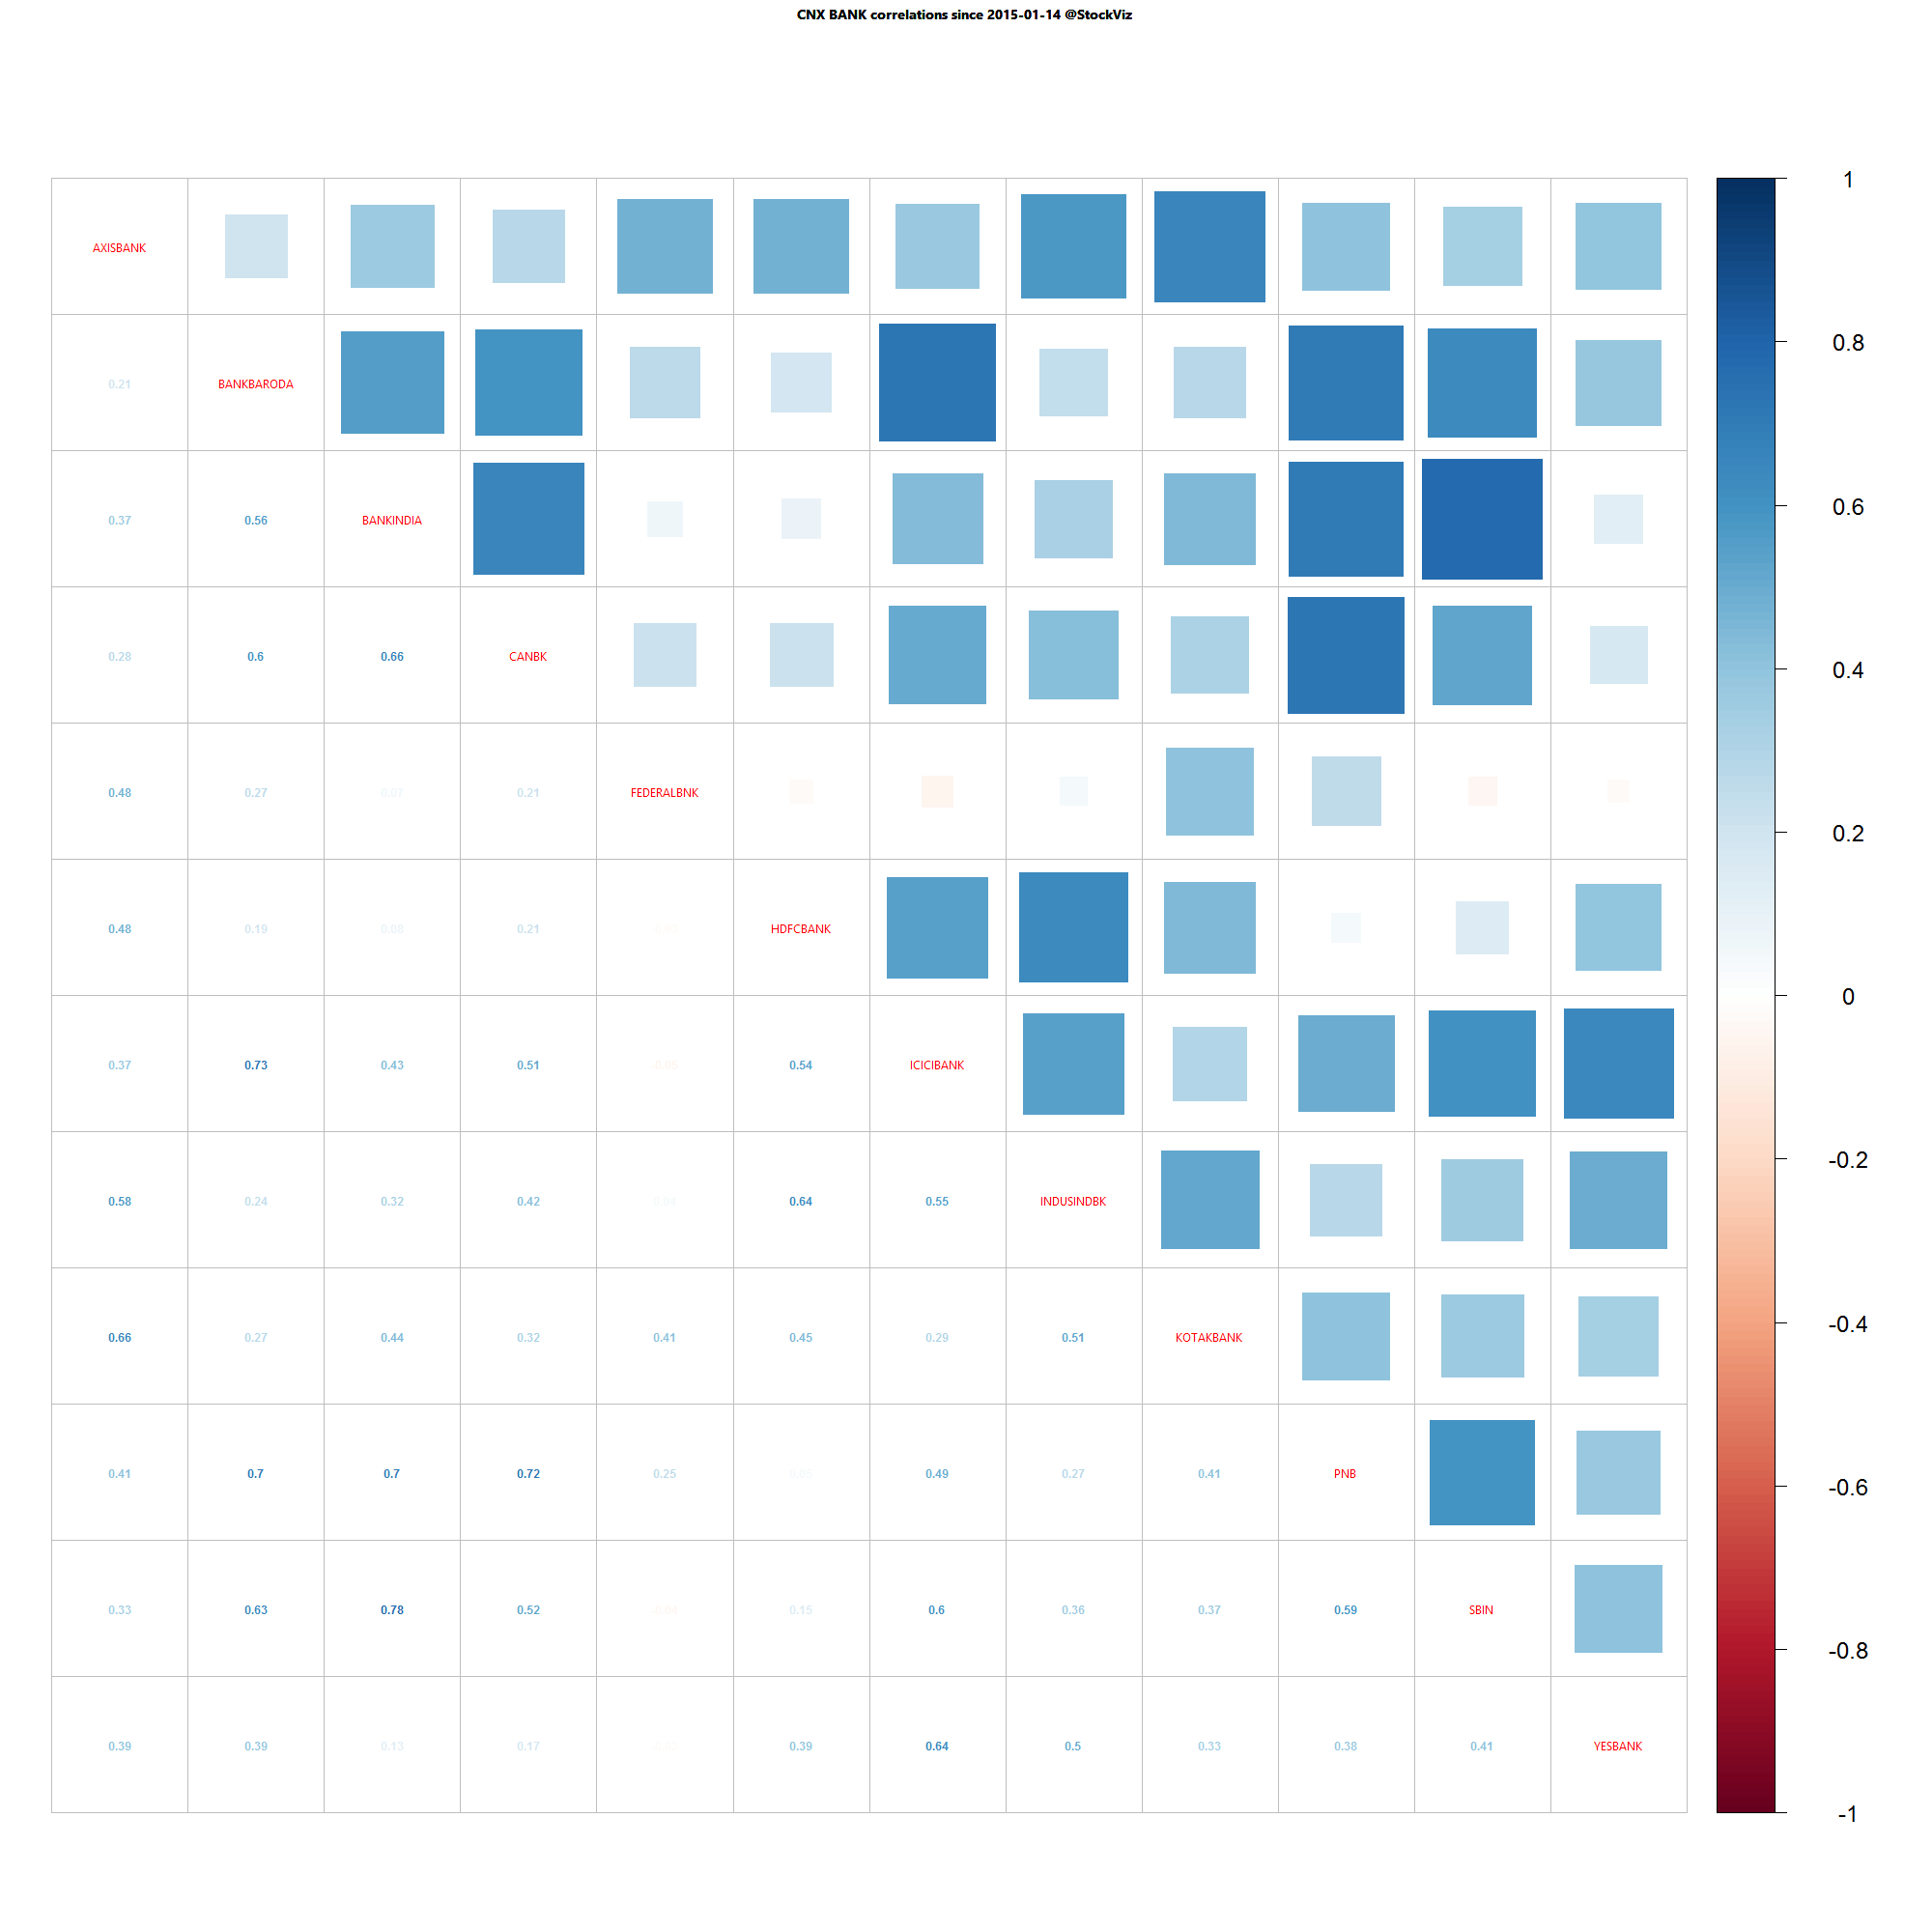
Bank Nifty one month daily return correlations
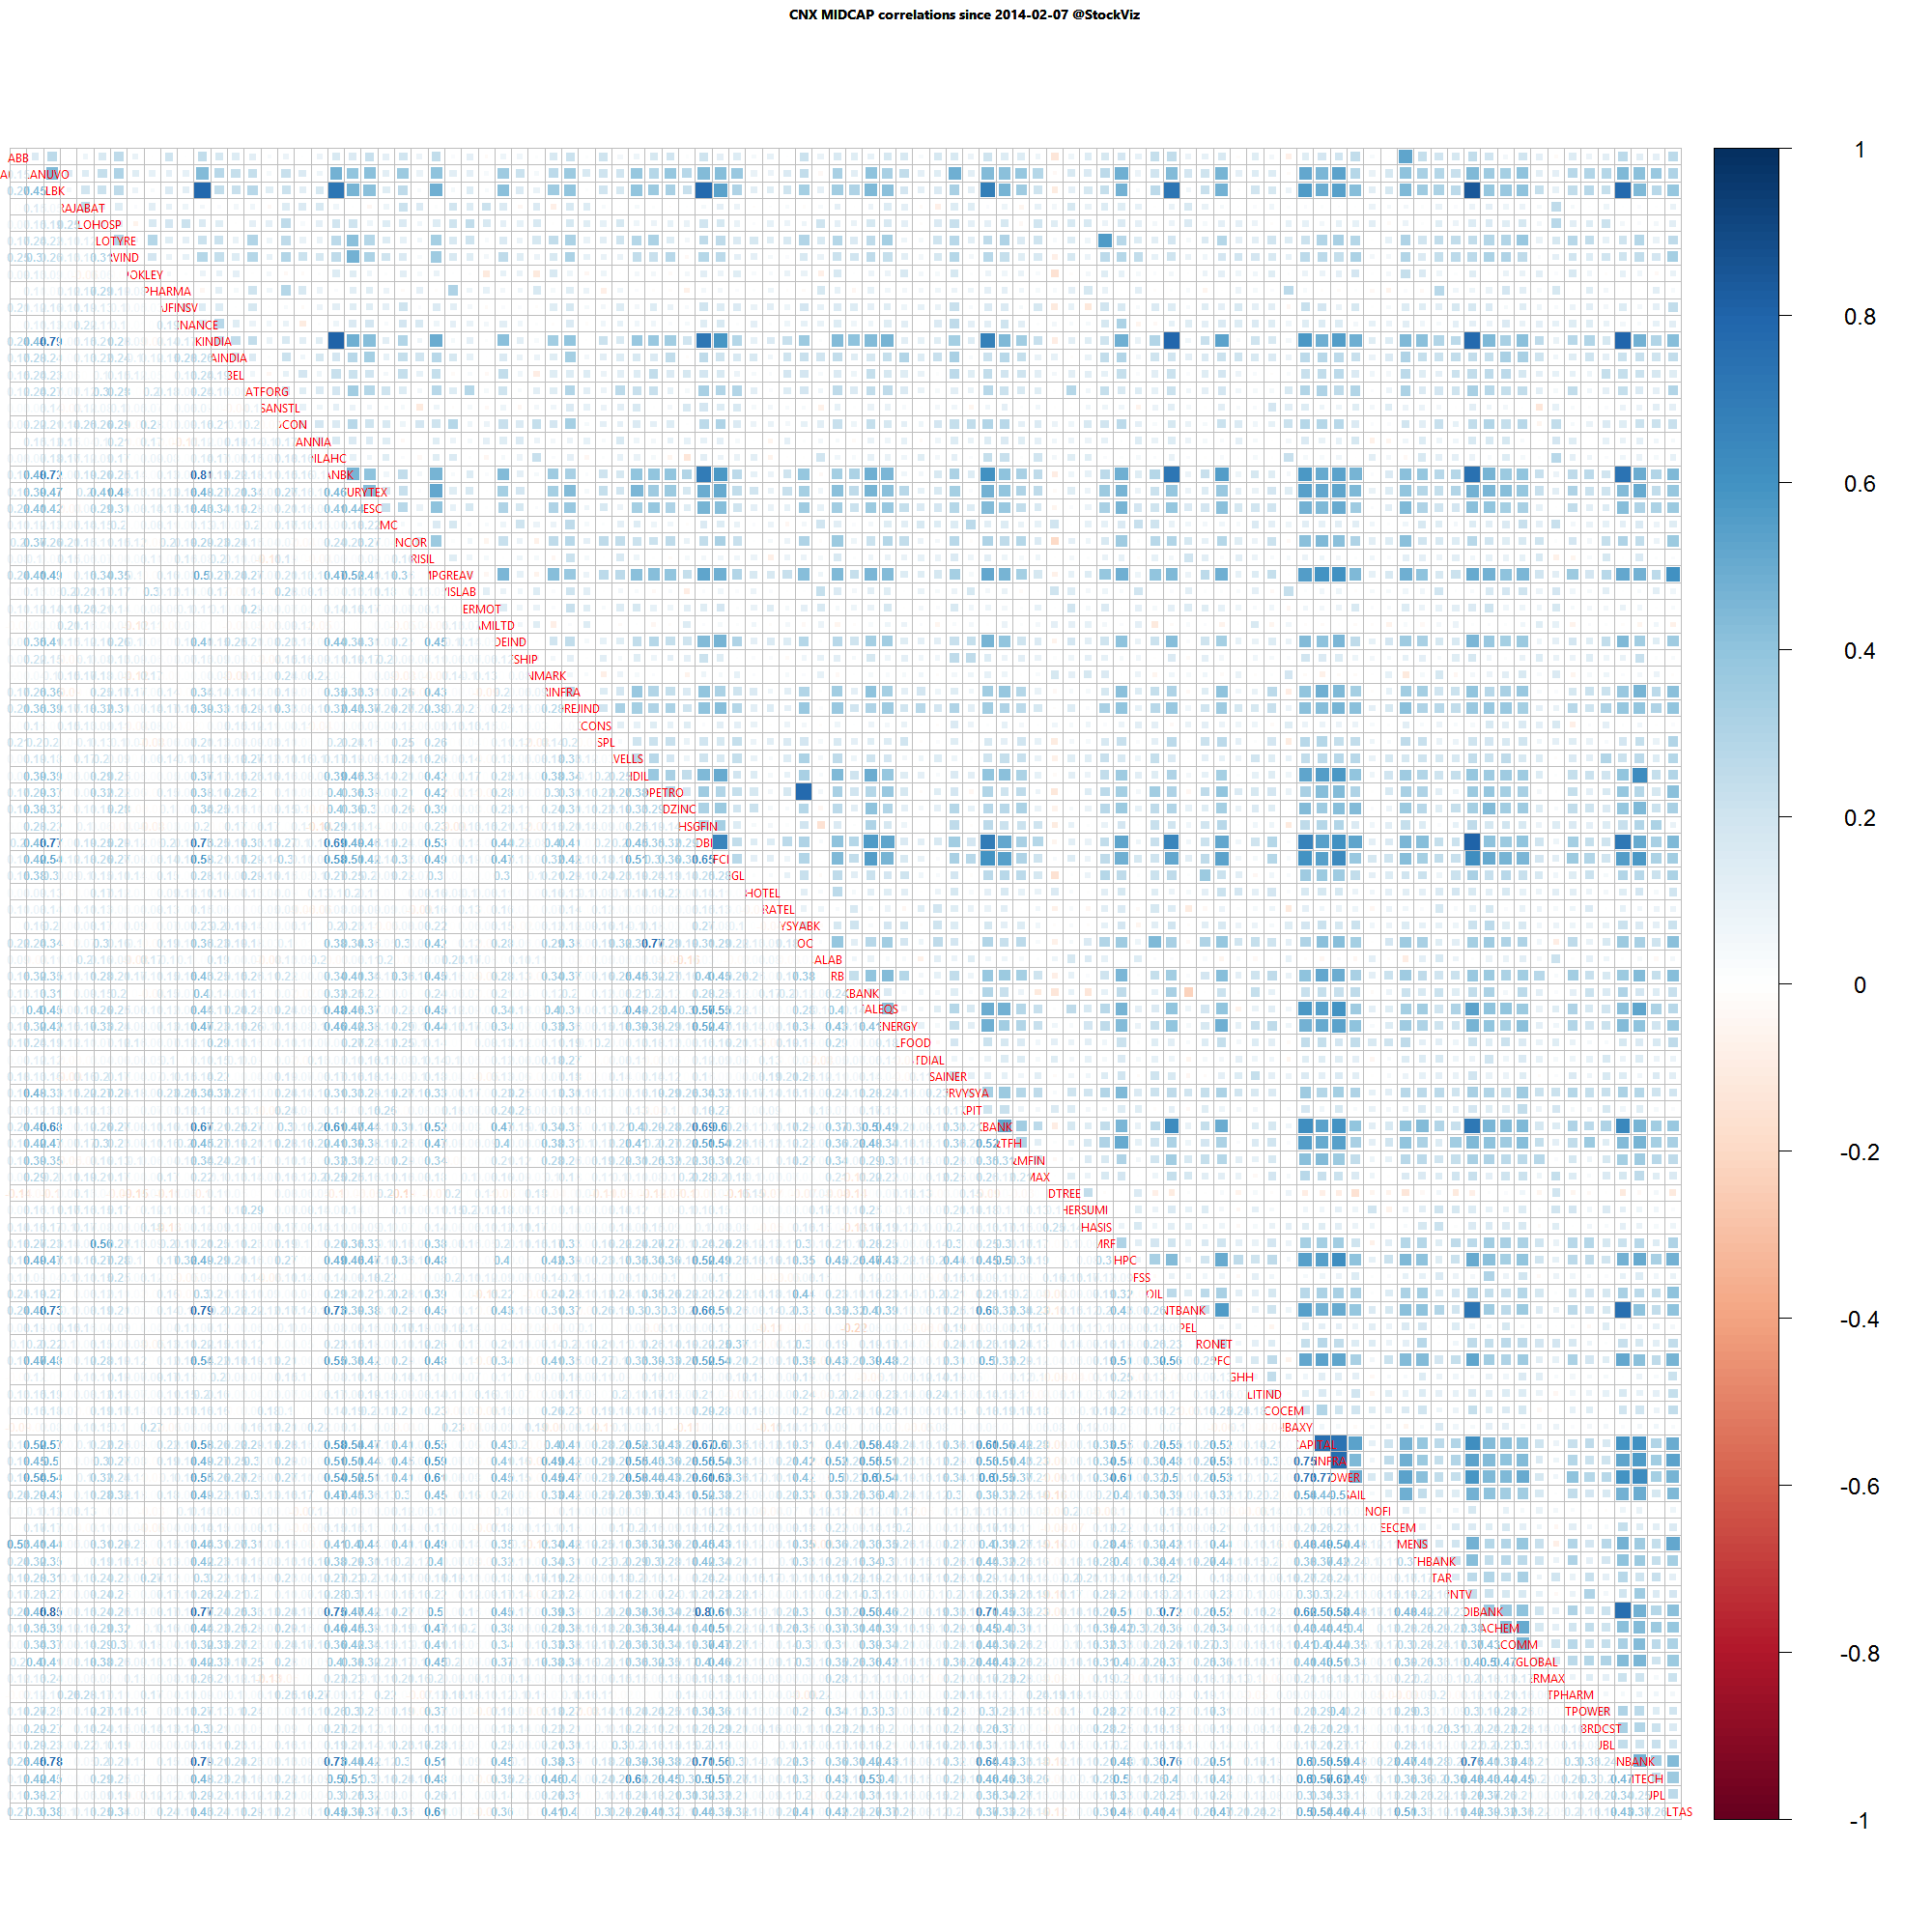
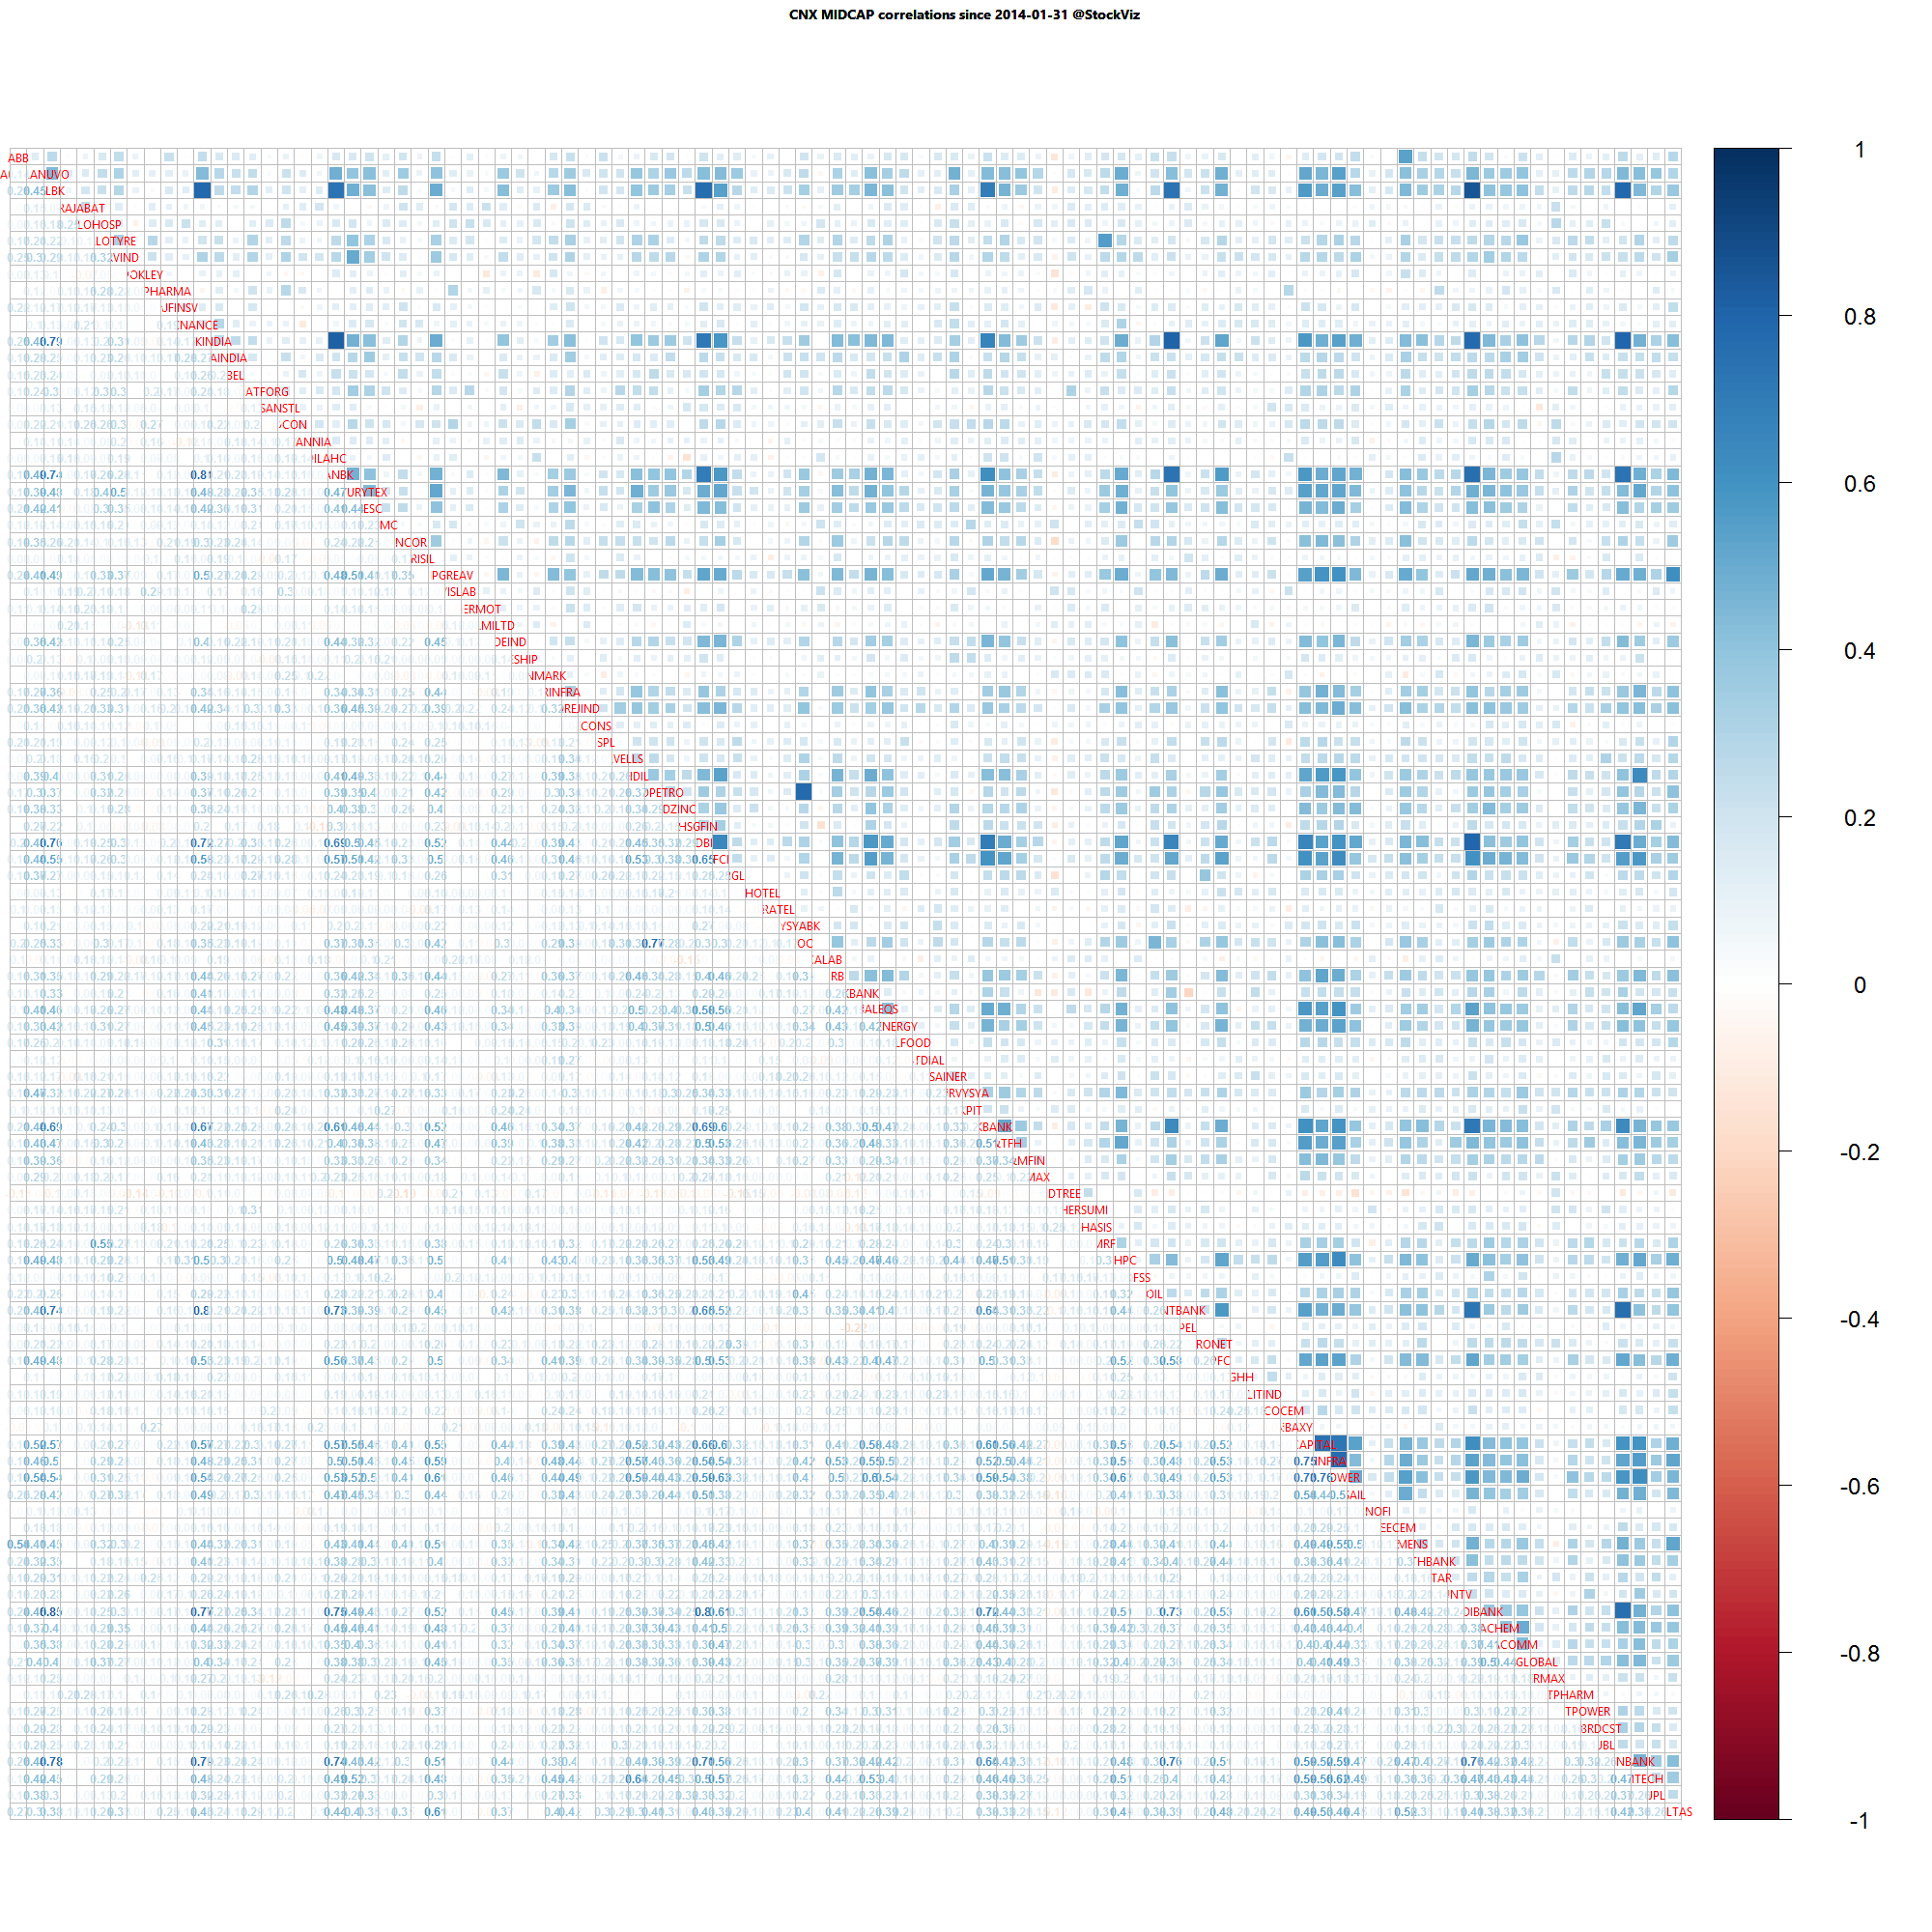
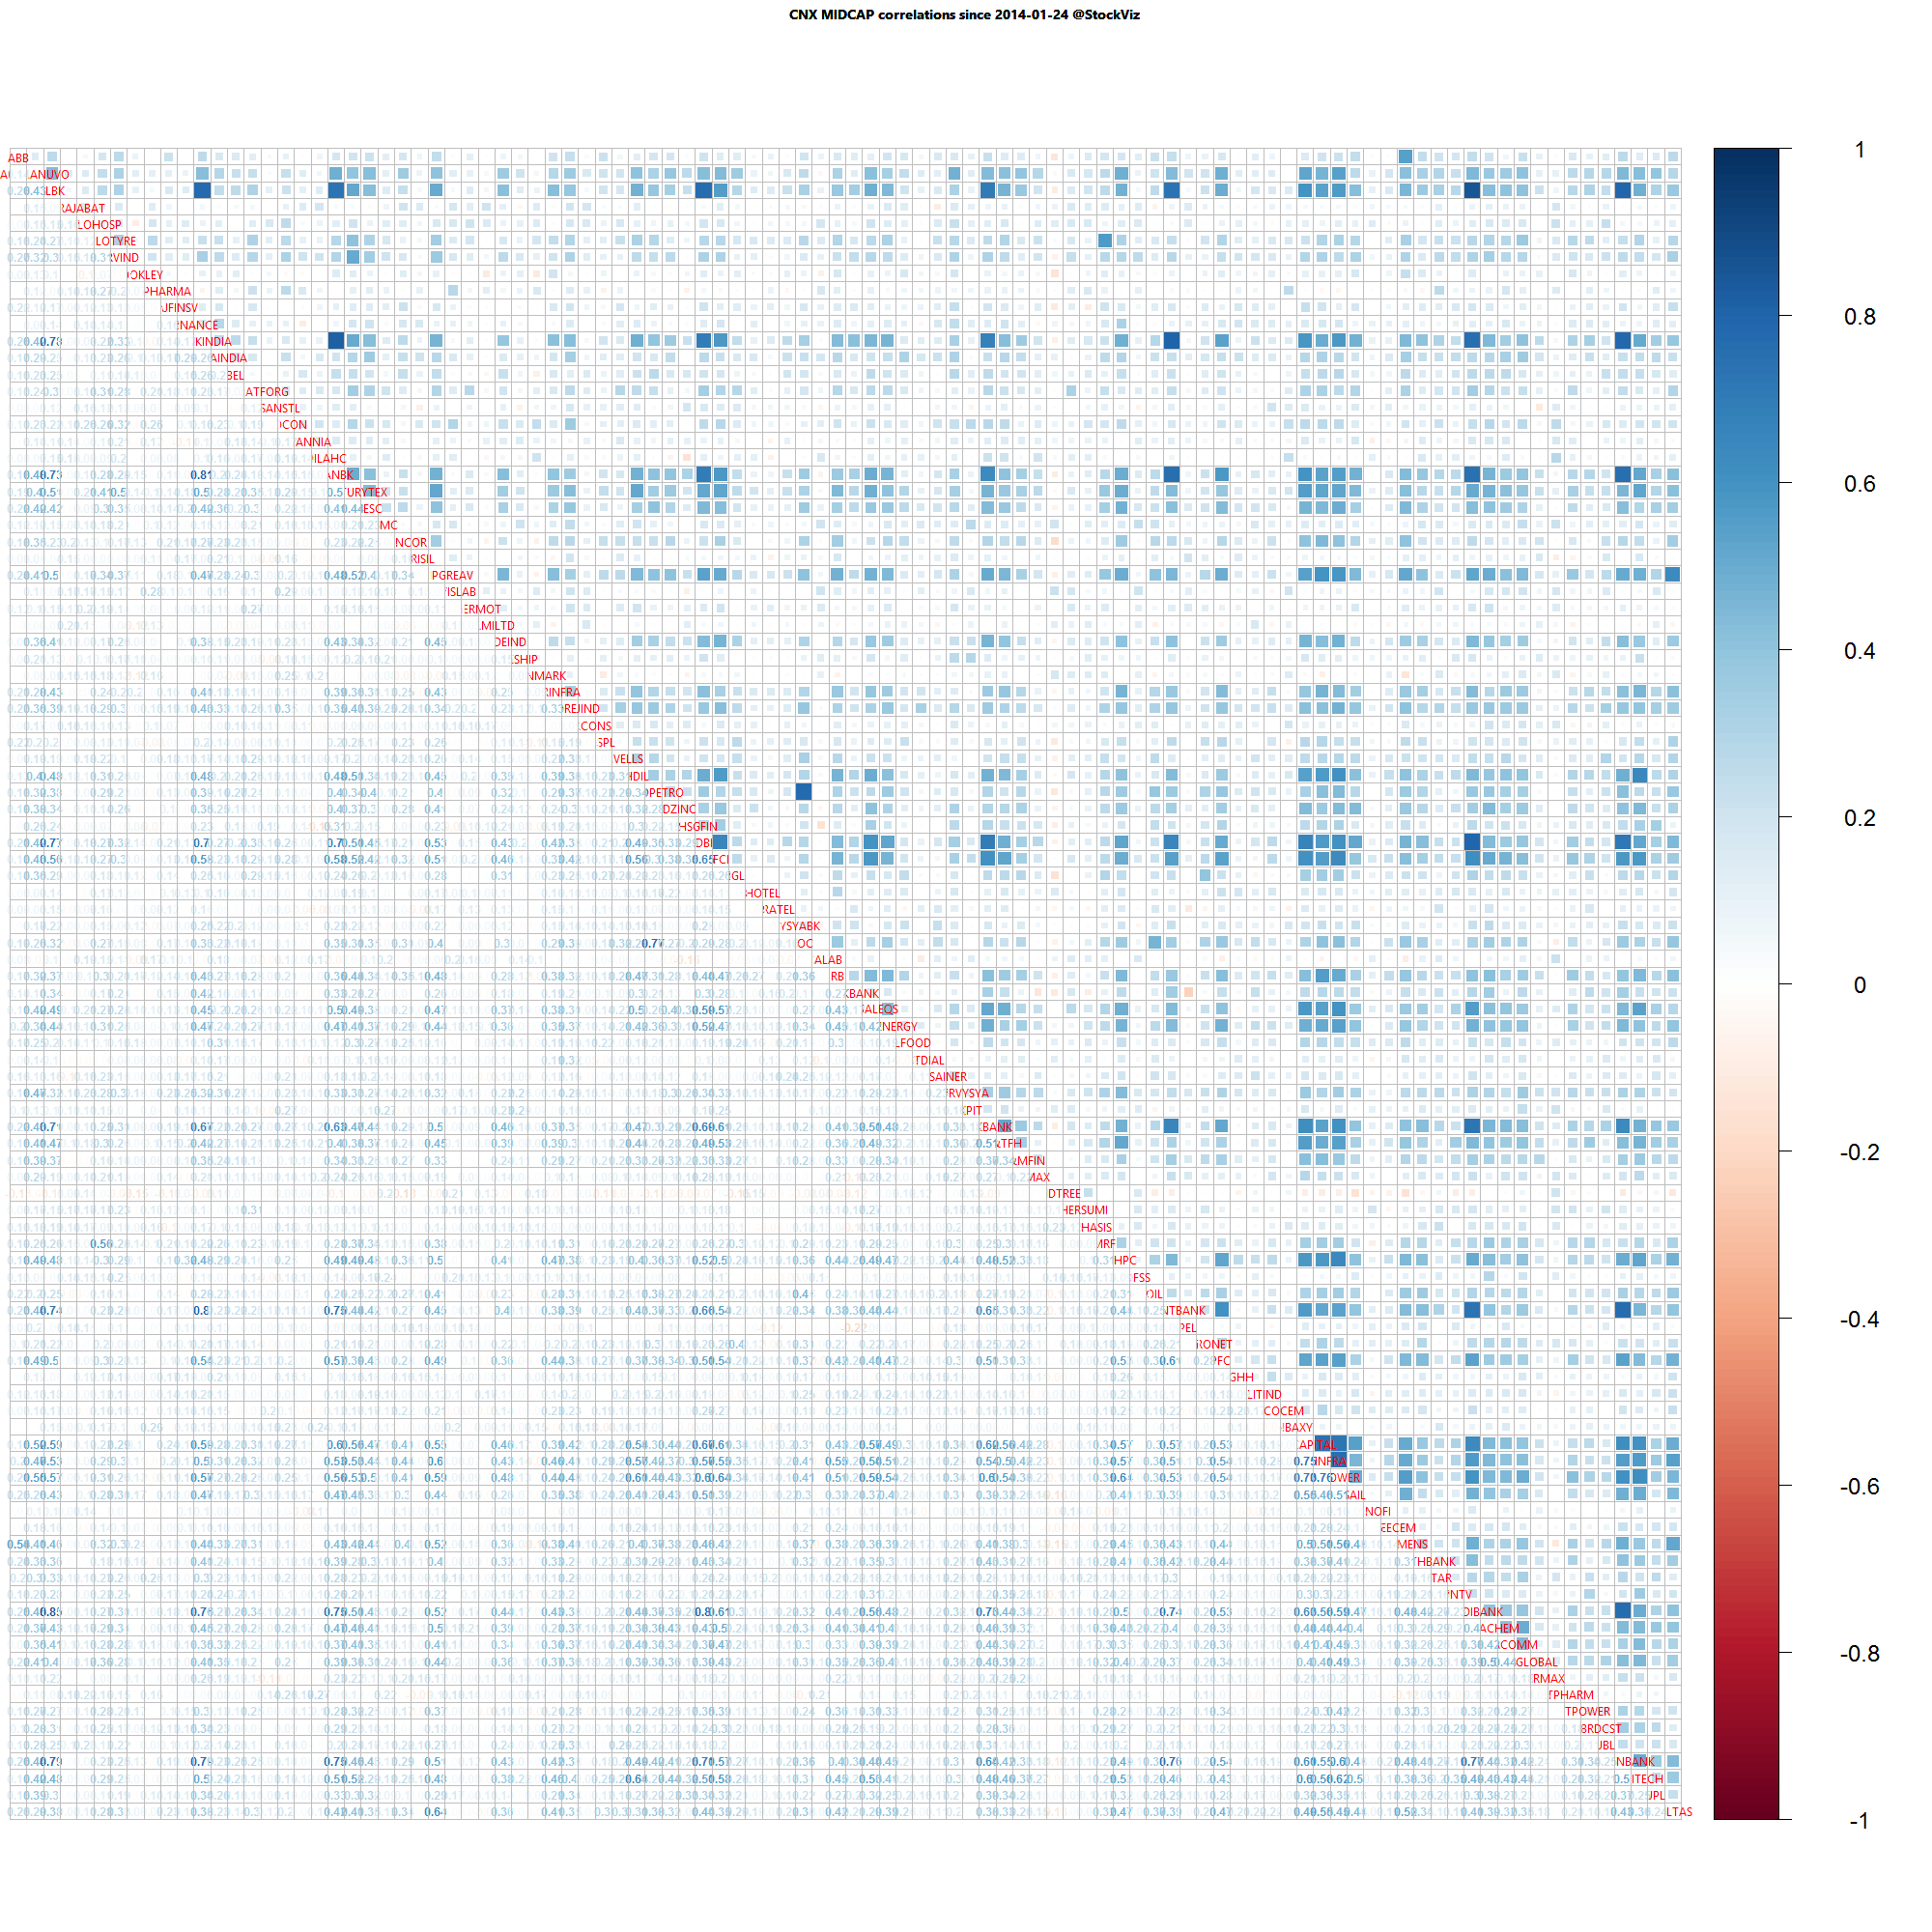
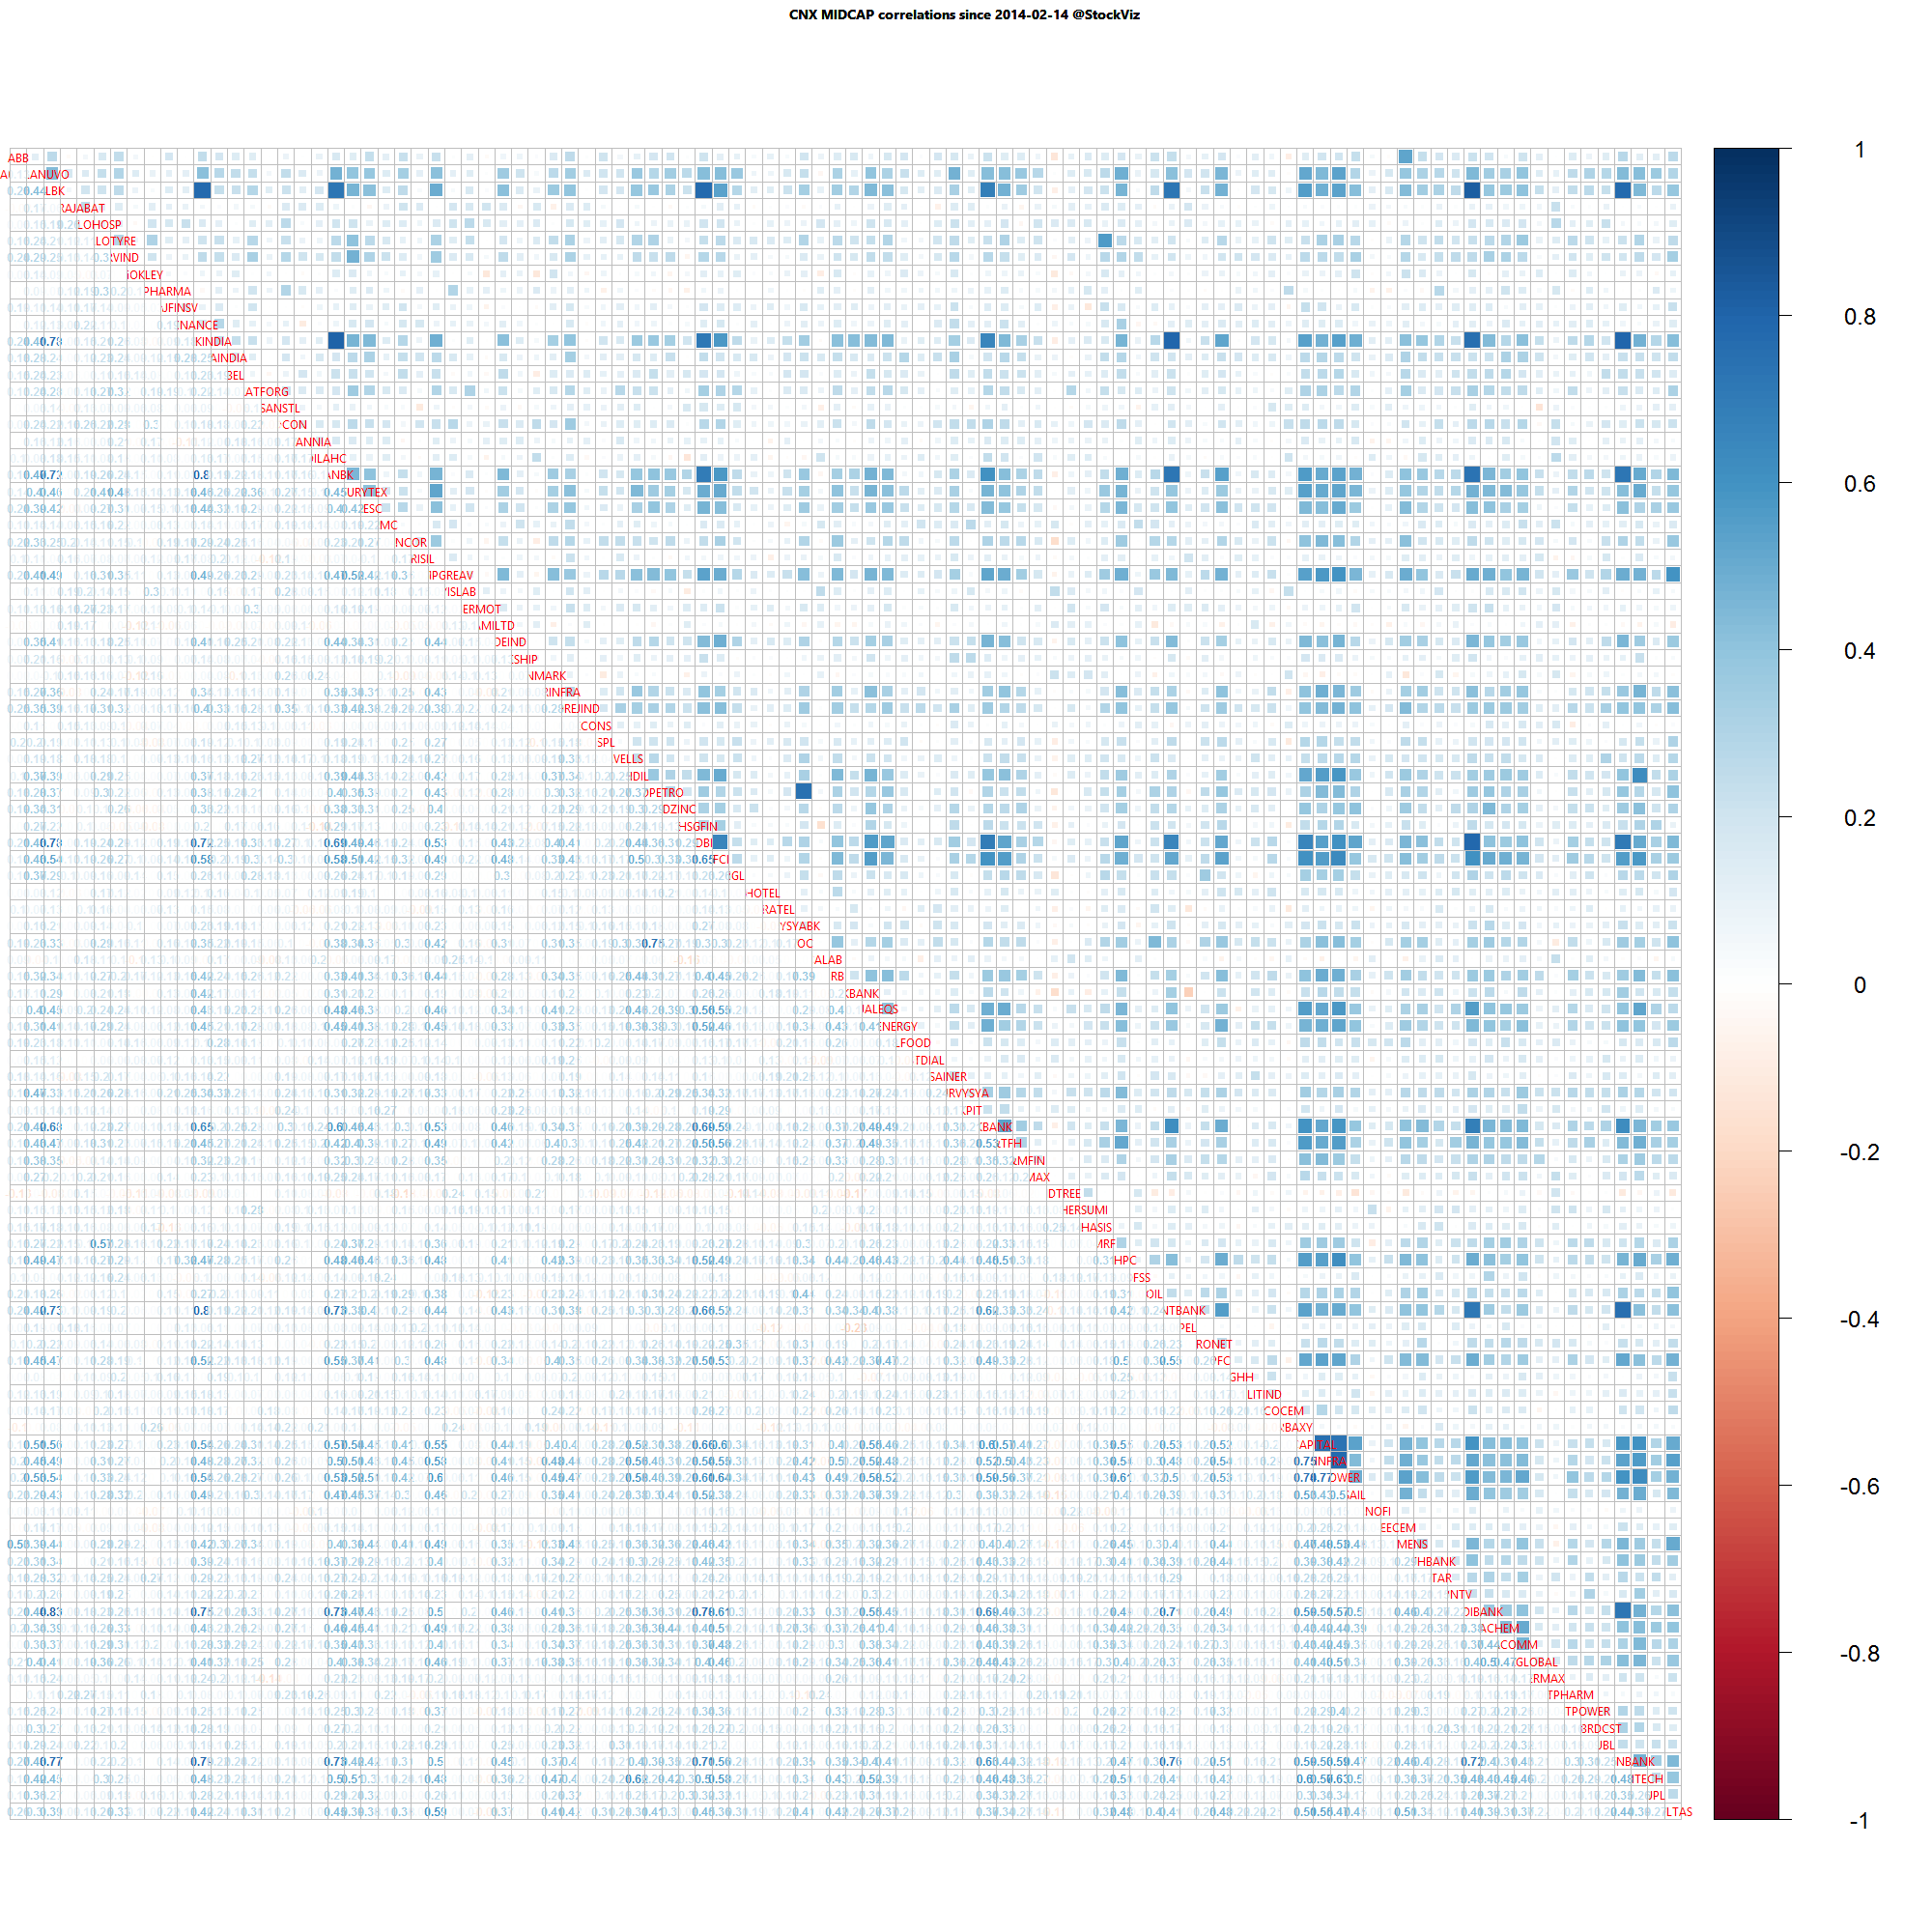
Midcap one year daily return correlations
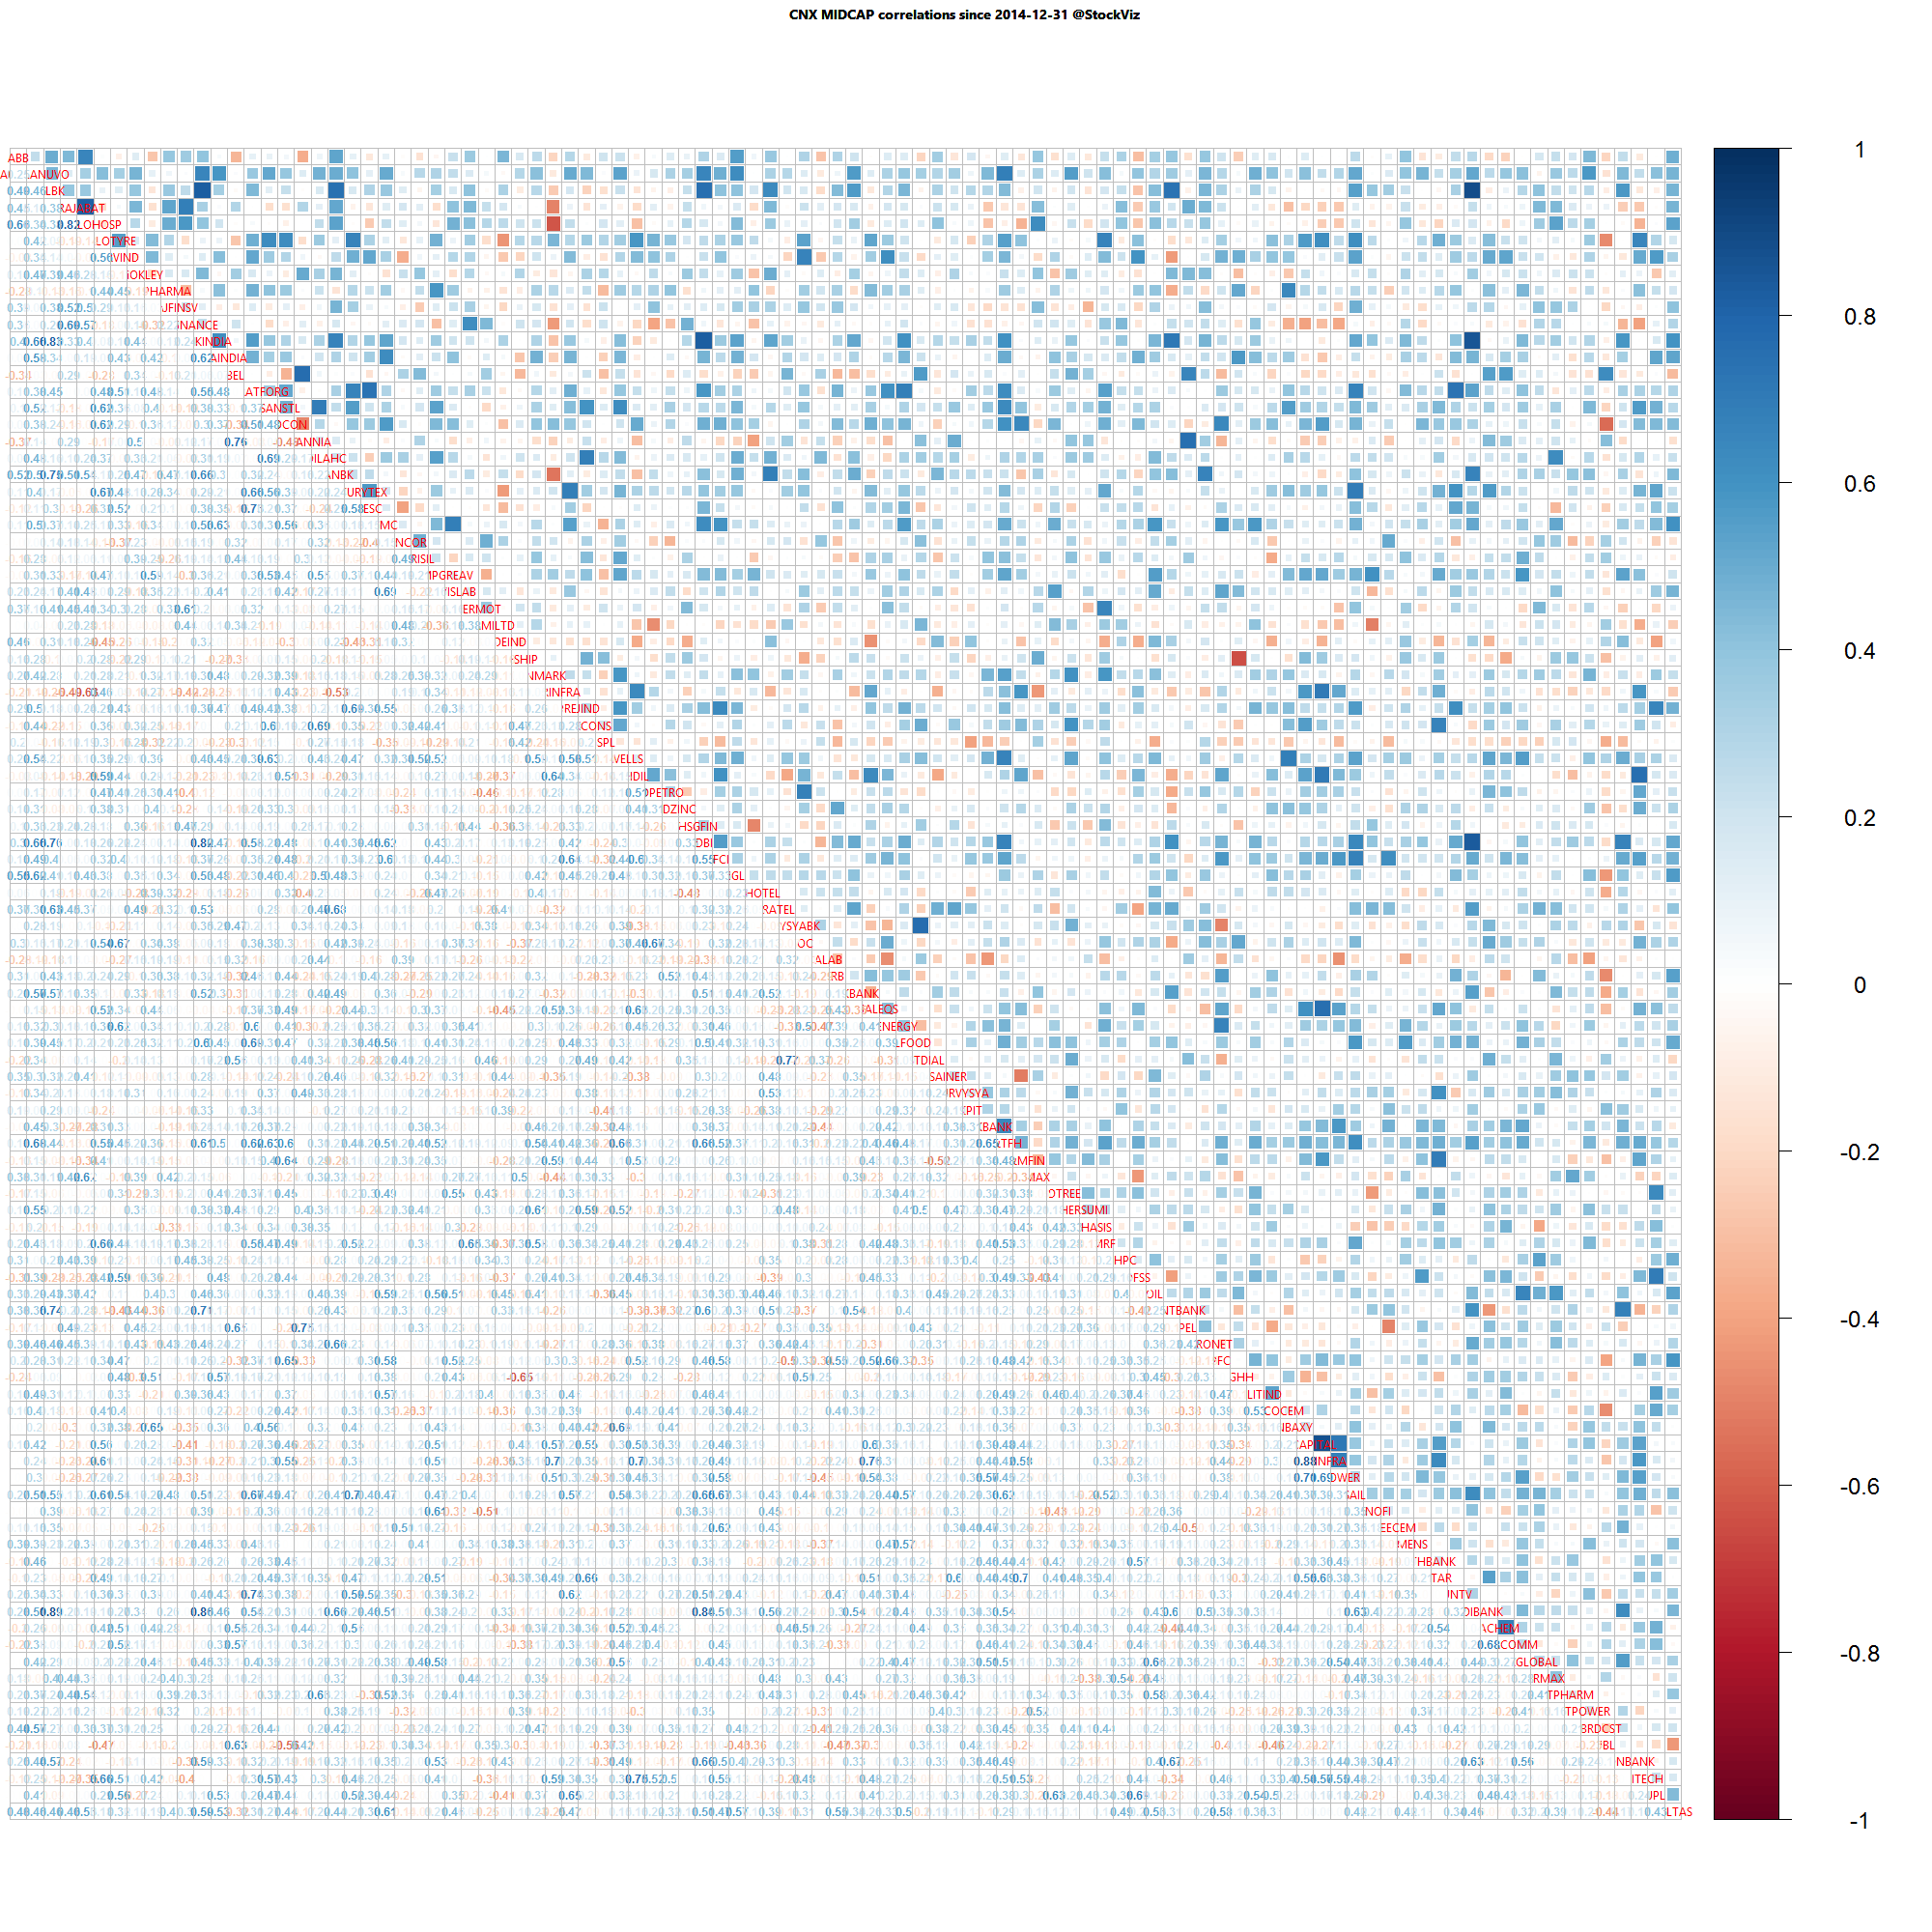
Midcap one month daily return correlations
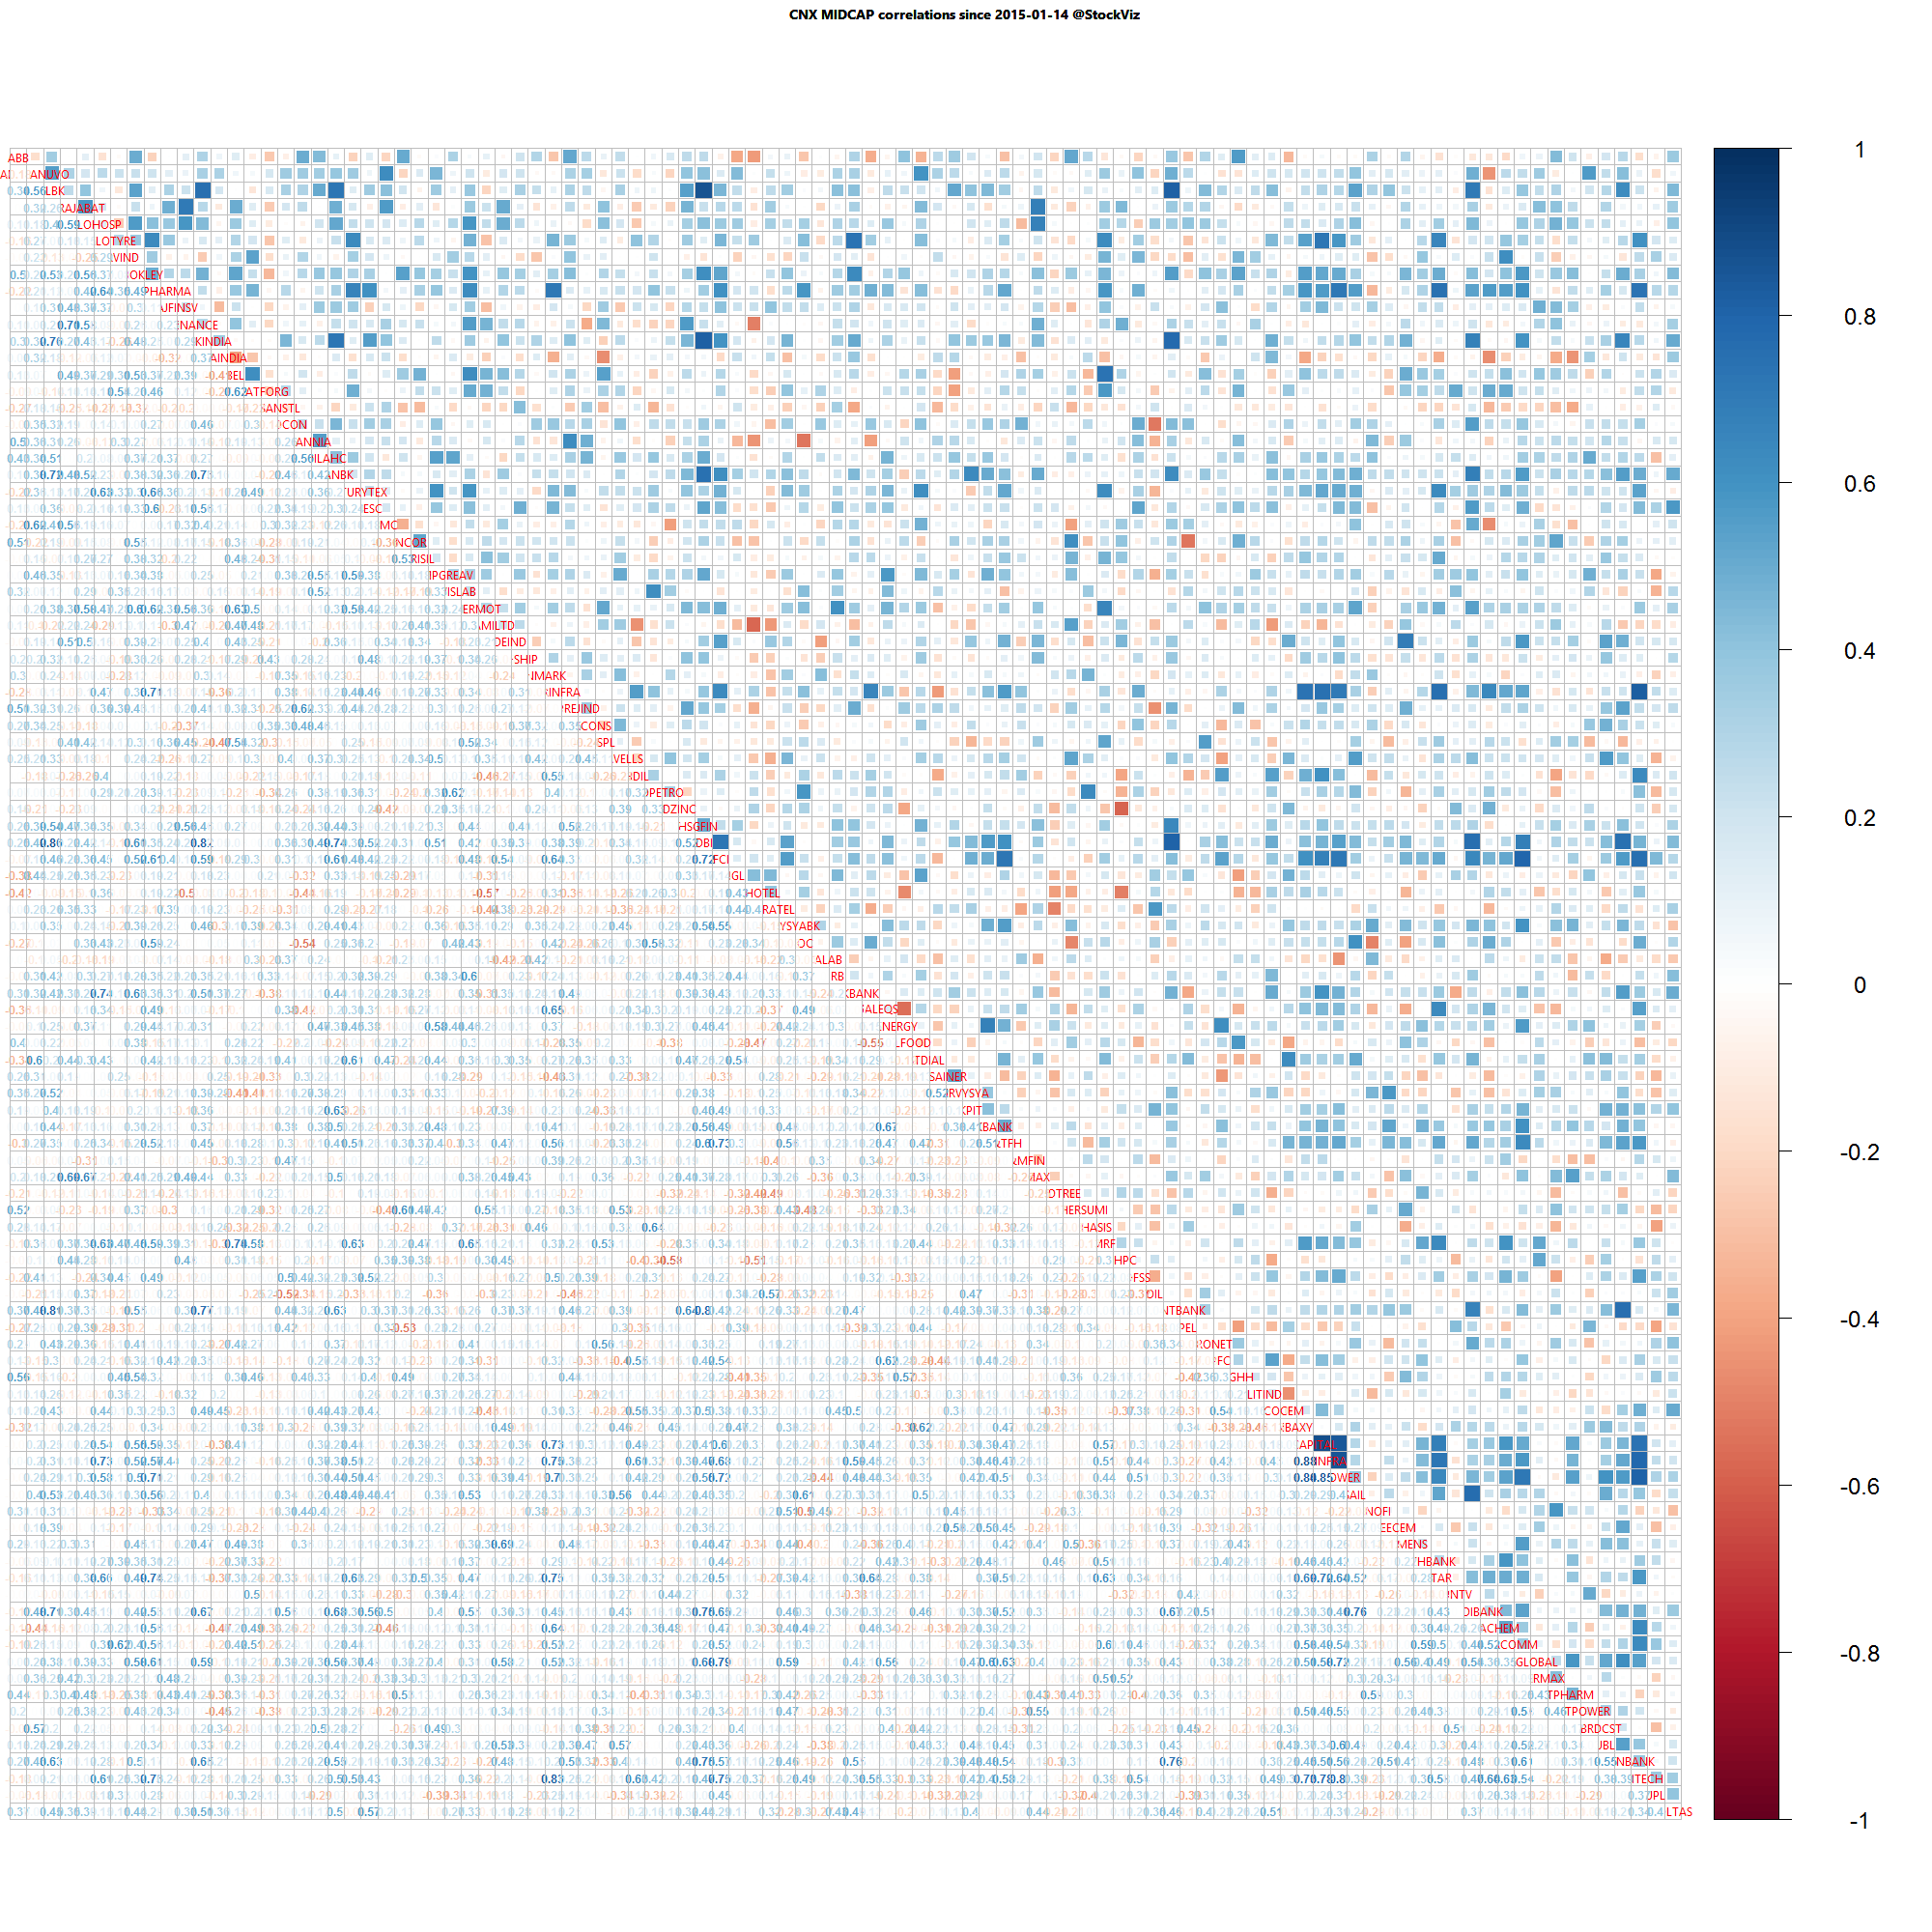
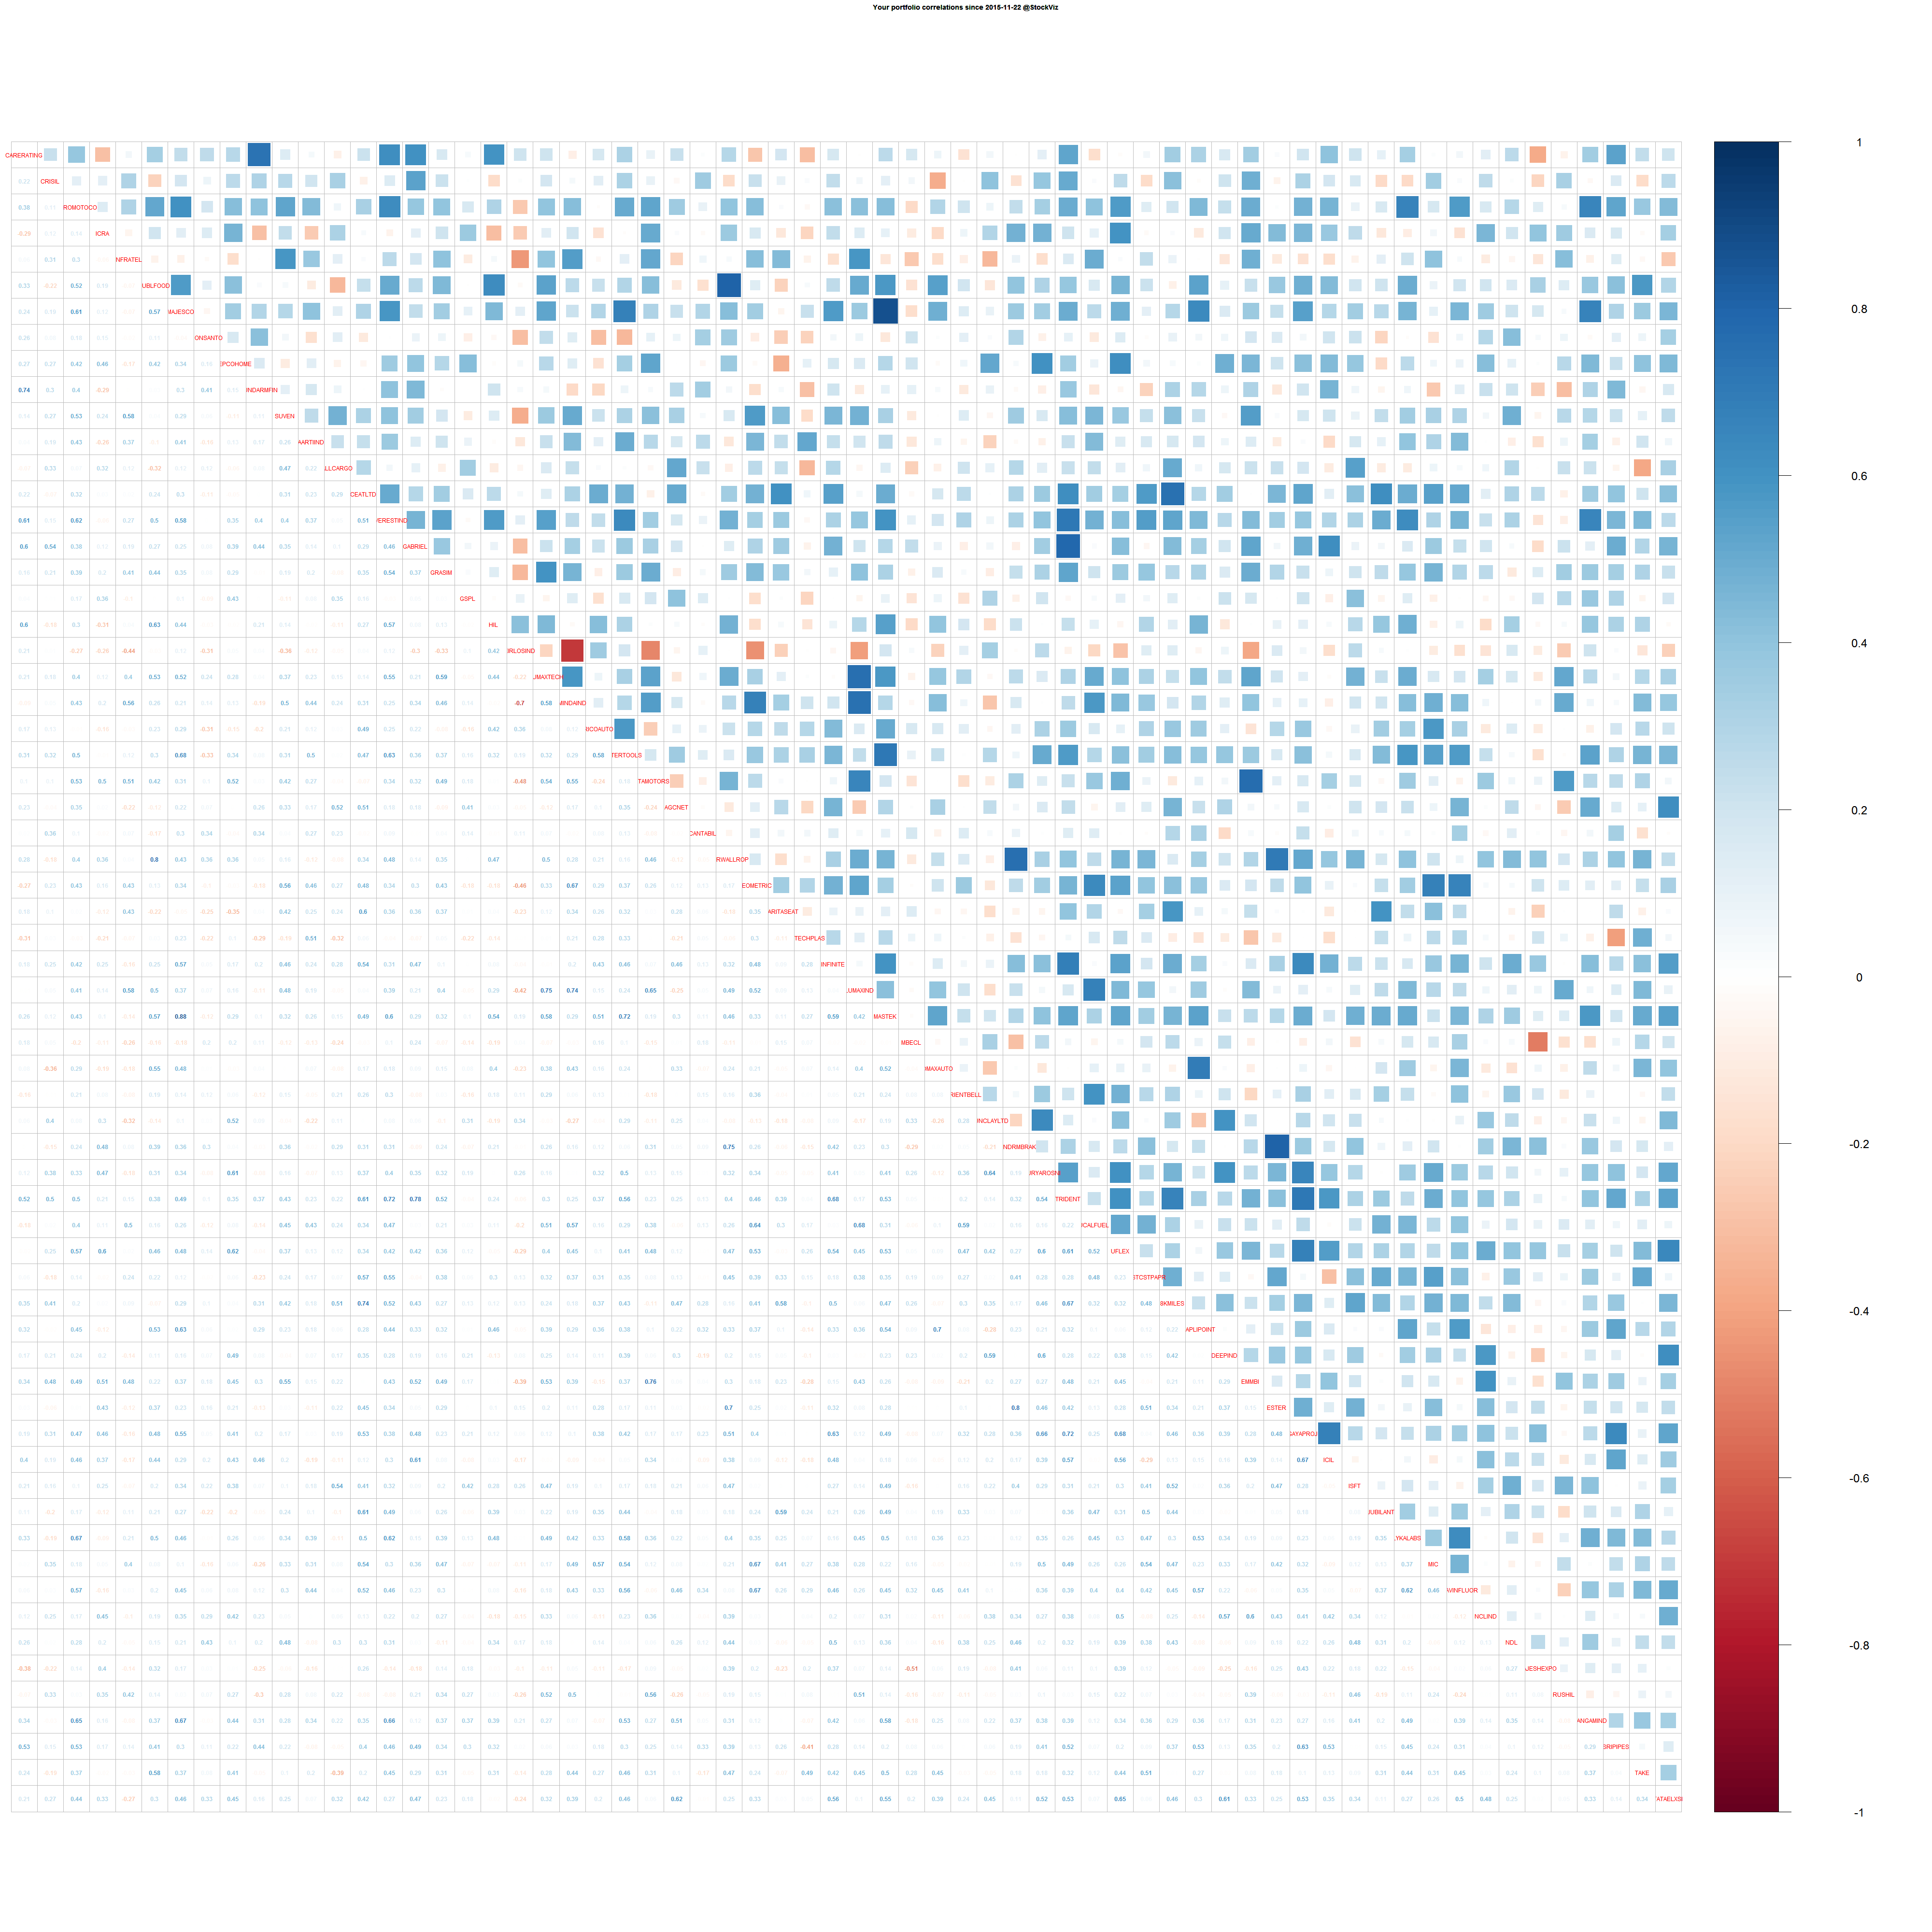
A lot of thick blue squares mean that positive correlations are high. Red squares mean negative correlations are high. Whites are the doldrums.