From an Indian investor’s point of view, the attractiveness of US stocks are many:
- There is no STT. So trading costs are orders of magnitude lower.
- Lower volatility overall.
- Rupee usually depreciates ~2.5% annually.
- Non-overlapping political cycles.
- Diversification. US is 40% of overall world market cap while India is less than 3%.
Most investors looking to invest in the US would be better off buying and holding the S&P 500 ETF (SPY) or its momentum equivalent (MTUM.) However, for those who are looking for a more active portfolio, we ported our relative momentum strategy to the US markets last year.
Dynamic Momentum
Our dynamic relative momentum strategy applies a trailing stop-loss of 5% on each constituent, everyday, and kicks out stocks that have sunk below it. Replacements are chosen based on their relative momentum scores.
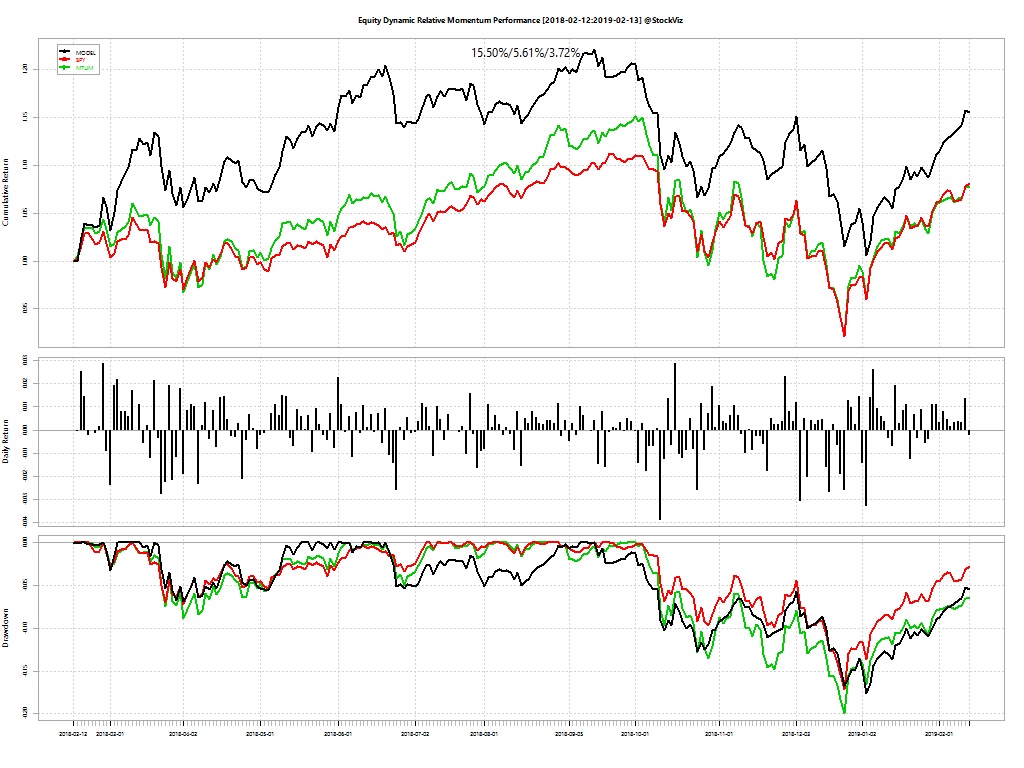
While the strategy is still recovering from the 18% drawdown that occurred in September 2018, it has beaten MTUM and SPY handily over the entire period. The stats are updated every day here. Please bookmark!
Static Momentum
Our static relative momentum strategy follows a once-a-month rebalance schedule. Unless any of the constituent stocks undergoes a delisting/merger etc., the algorithm is run at the beginning of the month and the portfolio is held for the entire month.
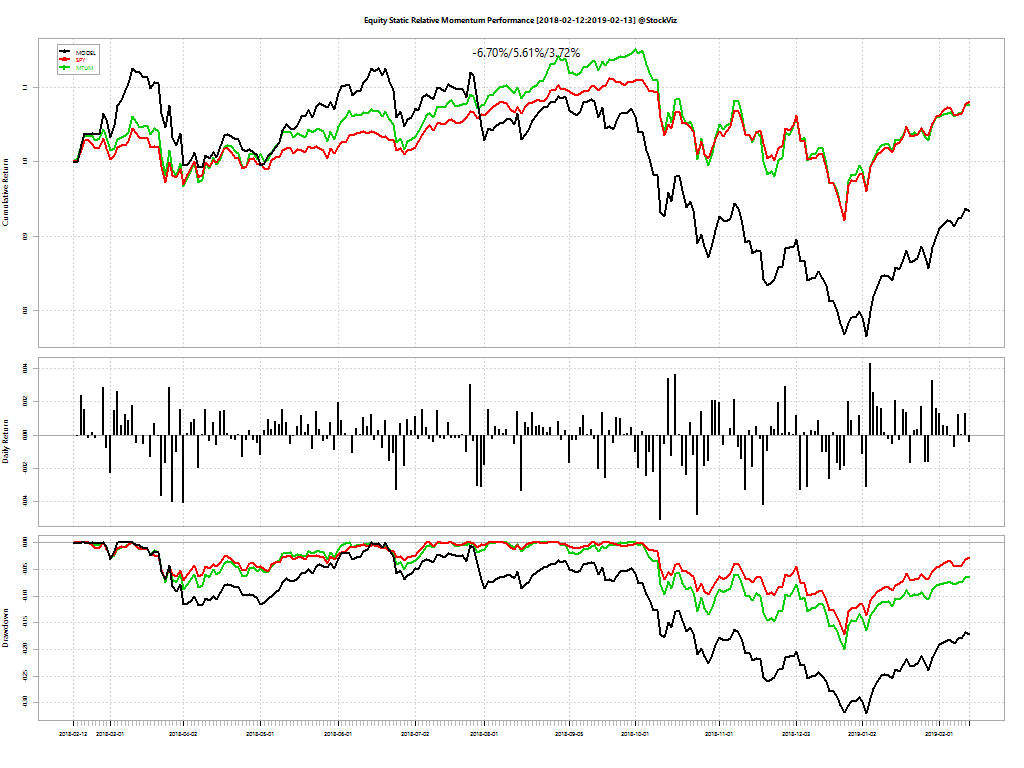
The strategy is still recovering from the 30% drawdown that occurred in June 2018 but it has out-performed both MTUM and SPY handily in the last 20- and 50-days. The stats are updated every day here. Please bookmark!
Static vs. Dynamic
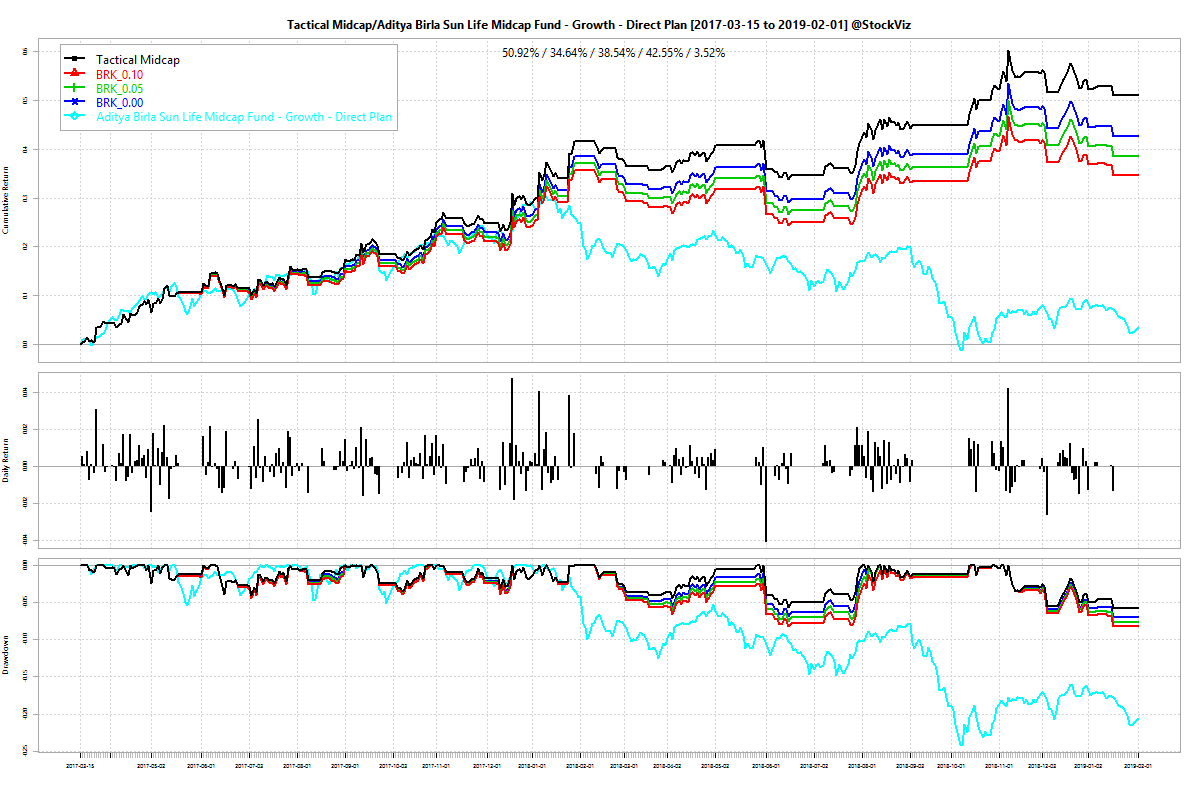
The dynamic strategy suffers from higher transaction costs but is likely to experience shallower drawdowns and be more responsive to market trends. Unlike in India, the US doesn’t have STT. So if you pay a flat brokerage (rates from Interactive Brokers can be as low as $1 per trade) then dynamic is the way to go. Here is the static vs. dynamic experience in Indian markets:
There is a ~15% return differential, July’16 through Feb’19, between the two versions.
Suitability
Here is how investors should weigh the alternatives, in order from simple to complex, cheap to expensive:
- Buy and hold SPY.
- Buy and hold MTUM. Given the high degree of correlation between SPY and MTUM, this makes sense if investors can manage the additional volatility through allocation.
- GEM – Global Equities Momentum outlined here.
- Static Relative Momentum. Over a longer time-frame, it should perform in-line with its dynamic counterpart after transaction costs.
- Dynamic Relative Momentum. For investors who enjoy a low cost of trading.
We are happy to further explore these options with you. Drop us a note!
Related: US vs. Indian Midcaps