In Trade Wars Are Class Wars: How Rising Inequality Distorts the Global Economy and Threatens International Peace (Amazon,) authors Matthew Klein and Michael Pettis argue that a handful of elites have captured the financial benefits of open global trade and finance. This has caused a global savings glut and a hunt for safe assets that has resulted in a series of boom-busts in American asset prices and an hollowing-out of its manufacturing base. These underlying income and wealth inequalities have manifested themselves as trade wars.
Excerpt:
Trade war is often presented as a conflict between countries. It is not: it is a conflict mainly between bankers and owners of financial assets on one side and ordinary households on the other—between the very rich and everyone else. Rising inequality has produced gluts of manufactured goods, job loss, and rising indebtedness. It is an economic and financial perversion of what global integration was supposed to achieve.
America’s openness to international trade and finance means that the rich in Europe, China, and the other major surplus economies can squeeze their workers and retirees in the confidence that they can always sell their wares, earn their profits, and park their savings in safe assets.
The world’s rich were able to benefit at the expense of the world’s workers and retirees because the interests of American financiers were complementary to the interests of Chinese and German industrialists. Both complemented the interests of the wealthiest throughout the world, even from the poorest countries.
The book is an easy read and anyone who is interested in understanding the current macro environment should read it.
The Fama French 5-Factors came in two installments. The first 3 were published in 1992 and the rest in 2014. They capture “fundamental” factors, i.e., factors that can be derived from looking at balance-sheet and income statements. In 1993, Jegadeesh and Titman published their ground-breaking work on momentum: Returns to Buying Winners and Selling Losers: Implications for Stock Market Efficiency (pdf)
Their paper singularly propelled momentum (or, trend-following) into the mainstream by giving it the academic vigor it lacked earlier. While its findings may not have been earth-shattering for most traders, most professional investors looked at momentum strategies as something that “traders” did and avoided them. But within a decade of the paper being published, momentum strategies were firmly established as a “legitimate” strategy that could be allocated to.
Basic Design
The J/T paper constructs a long-short portfolio by ranking stocks based on their prior 12 month returns (skipping the most recent month.) The top decile portfolio is called the “losers” decile and the bottom decile is called the “winners” decile. In each month, the strategy buys the winner portfolio and sells the loser portfolio. This is the classic 12_1 momentum, where 12 denotes the formation period and the 1 is the number of skip months.
The reason for the skip month is to account for the short-term reversal effect associated with momentum. Some researchers, like Fama and French, do 12_2 momentum, where the most recent 2 months are skipped. However, a more recent study by Medhat and Schmeling (2018) finds that once we discard the stocks with the lowest turnover, equity returns exhibit short-term momentum rather than short-term reversal. So, the short-term reversal effect may not be as prevalent as is usually thought and one could even go with a 12_0 momentum.
The French Momentum Library
Luckily for us, Ken French (of the Fama French fame) regularly updates factor statistics on his Tuck School of Business webpage.
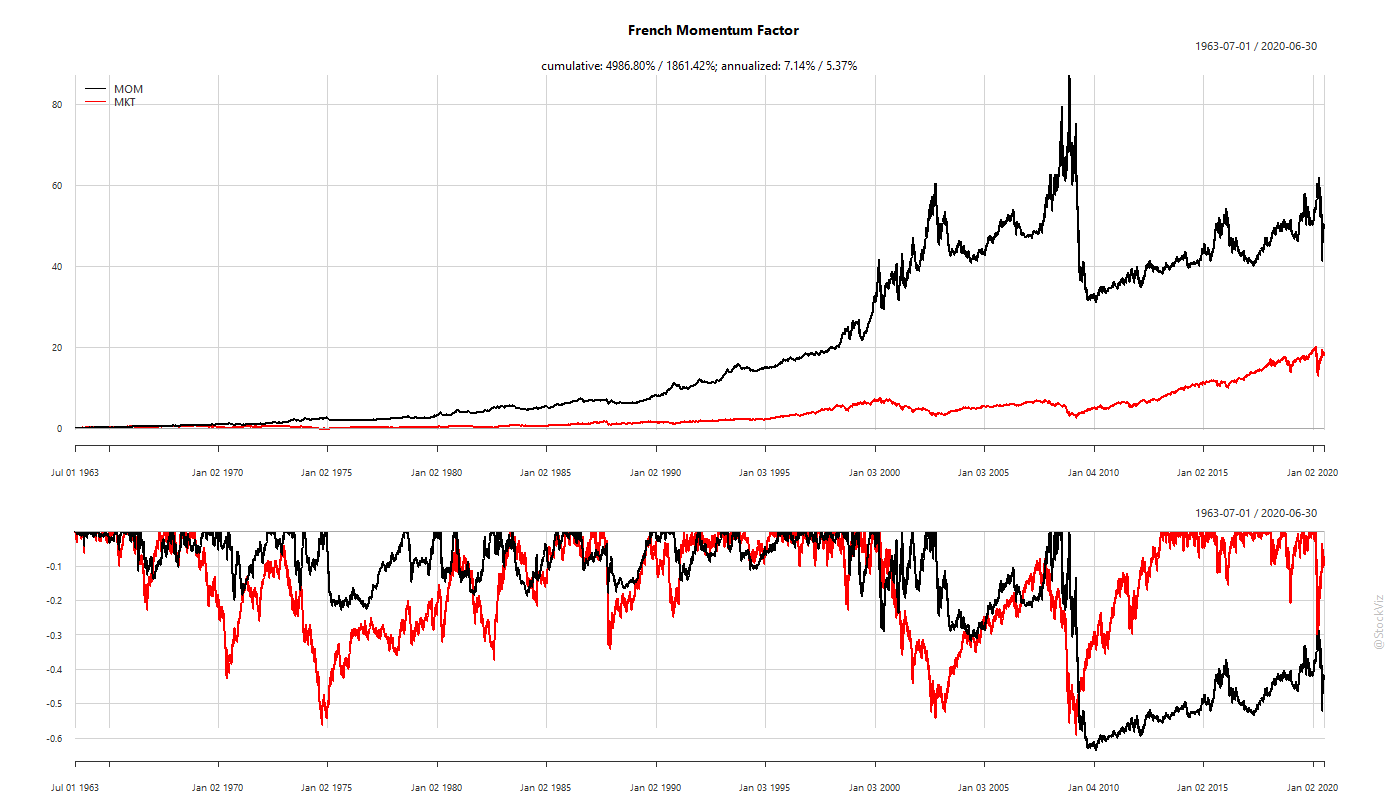
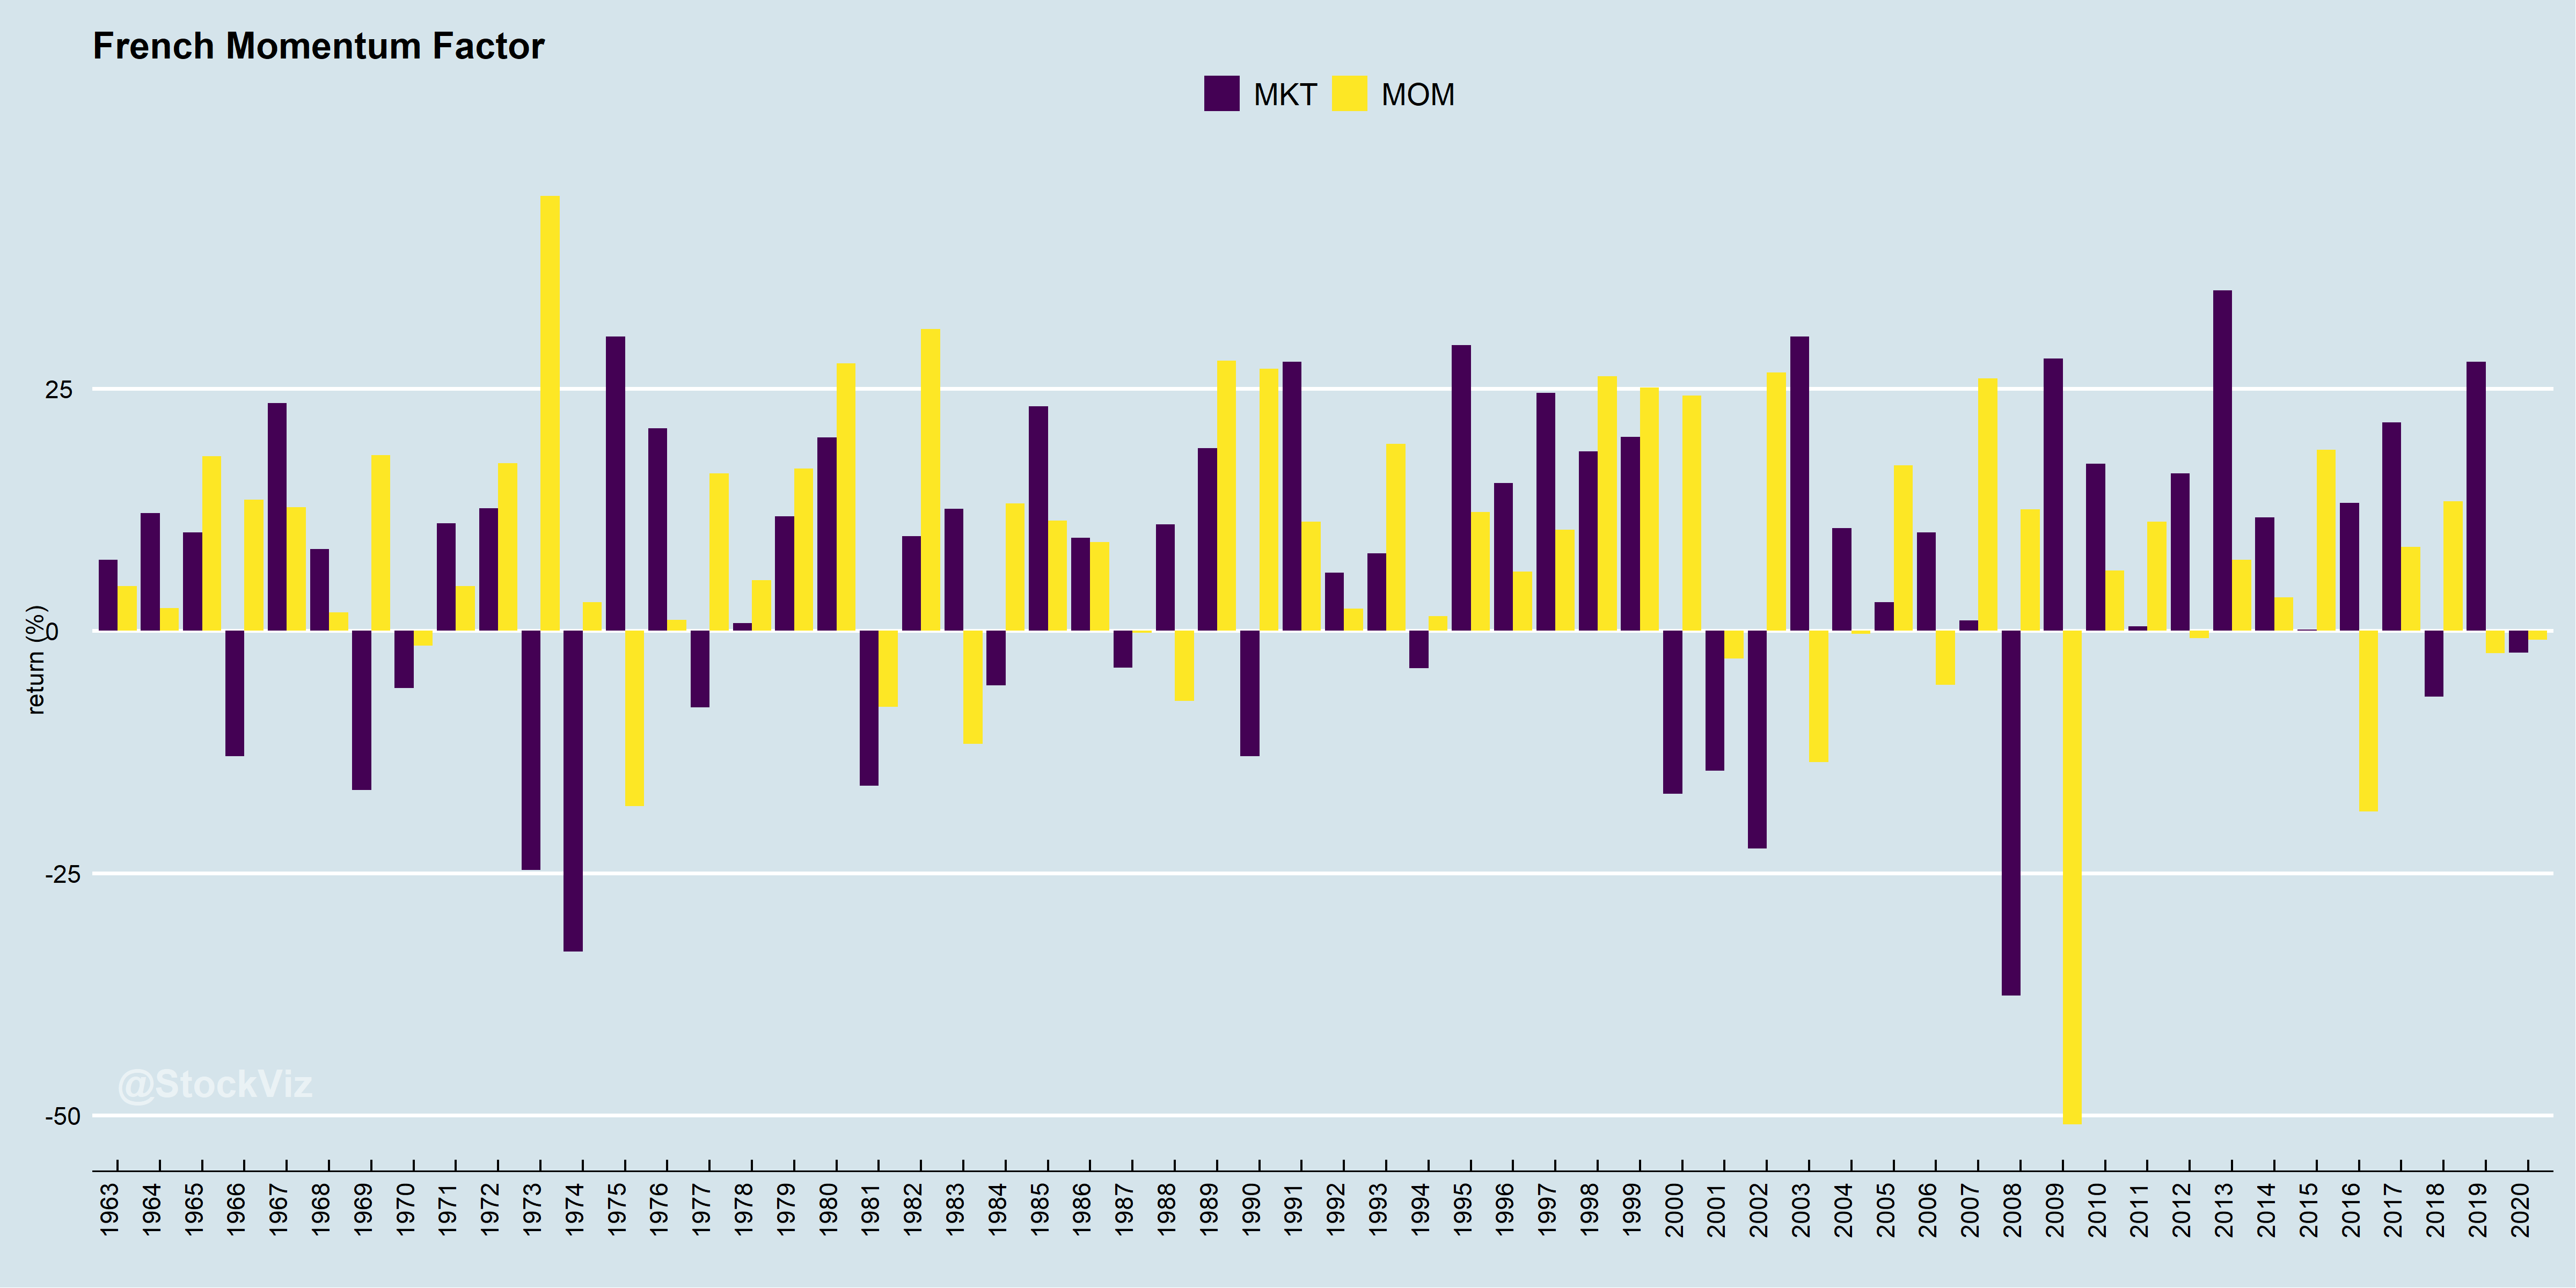
While the momentum factor (MOM) has out-performed the market factor (MKT = rm – rf = Market risk premium), over the long term, it is not without its share of pain.
Long-only Momentum
As “retail” investors, we typically invest in long-only portfolios. This makes momentum investing an extremely gut-wrenching ride. One day, you might be thinking which Greek island you are going to buy and the next day you might be scrambling to pay rent.
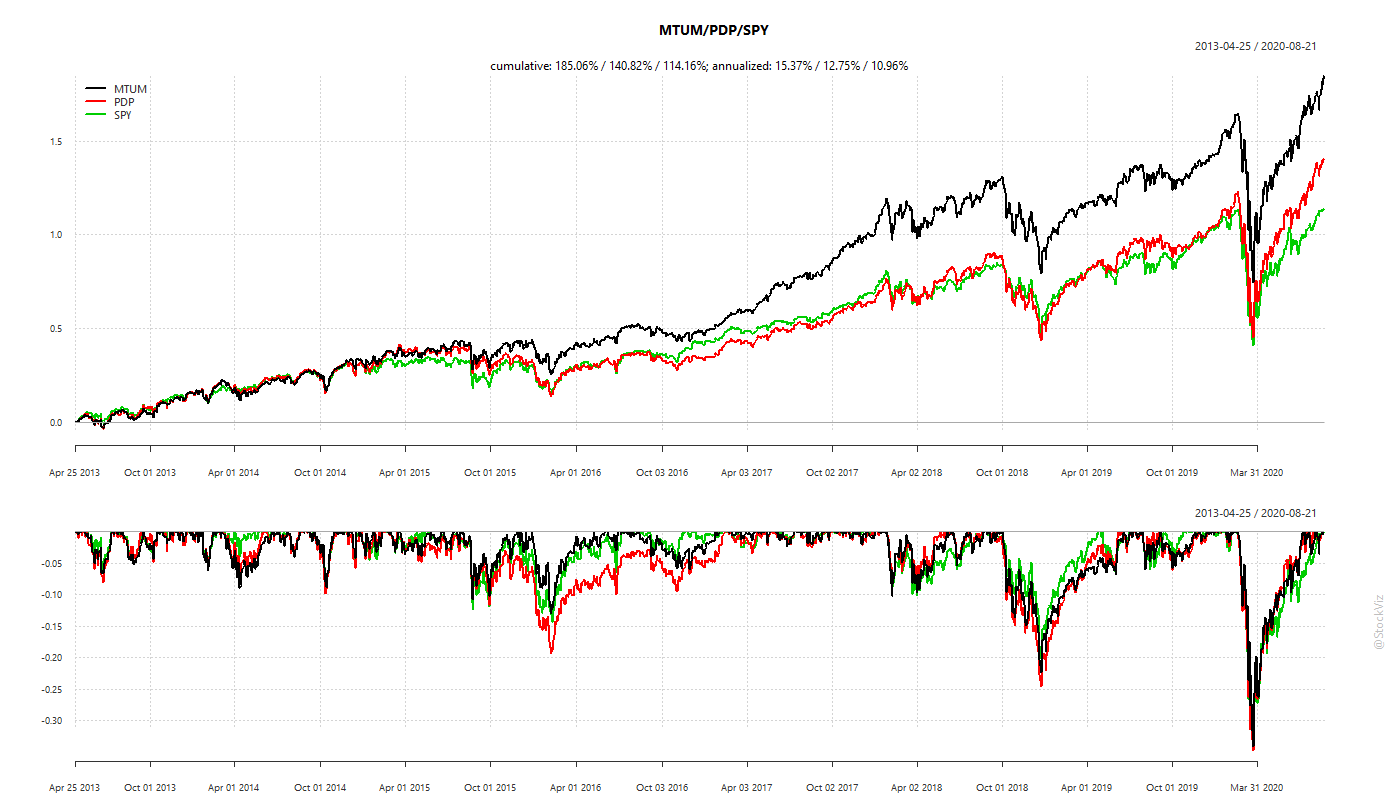
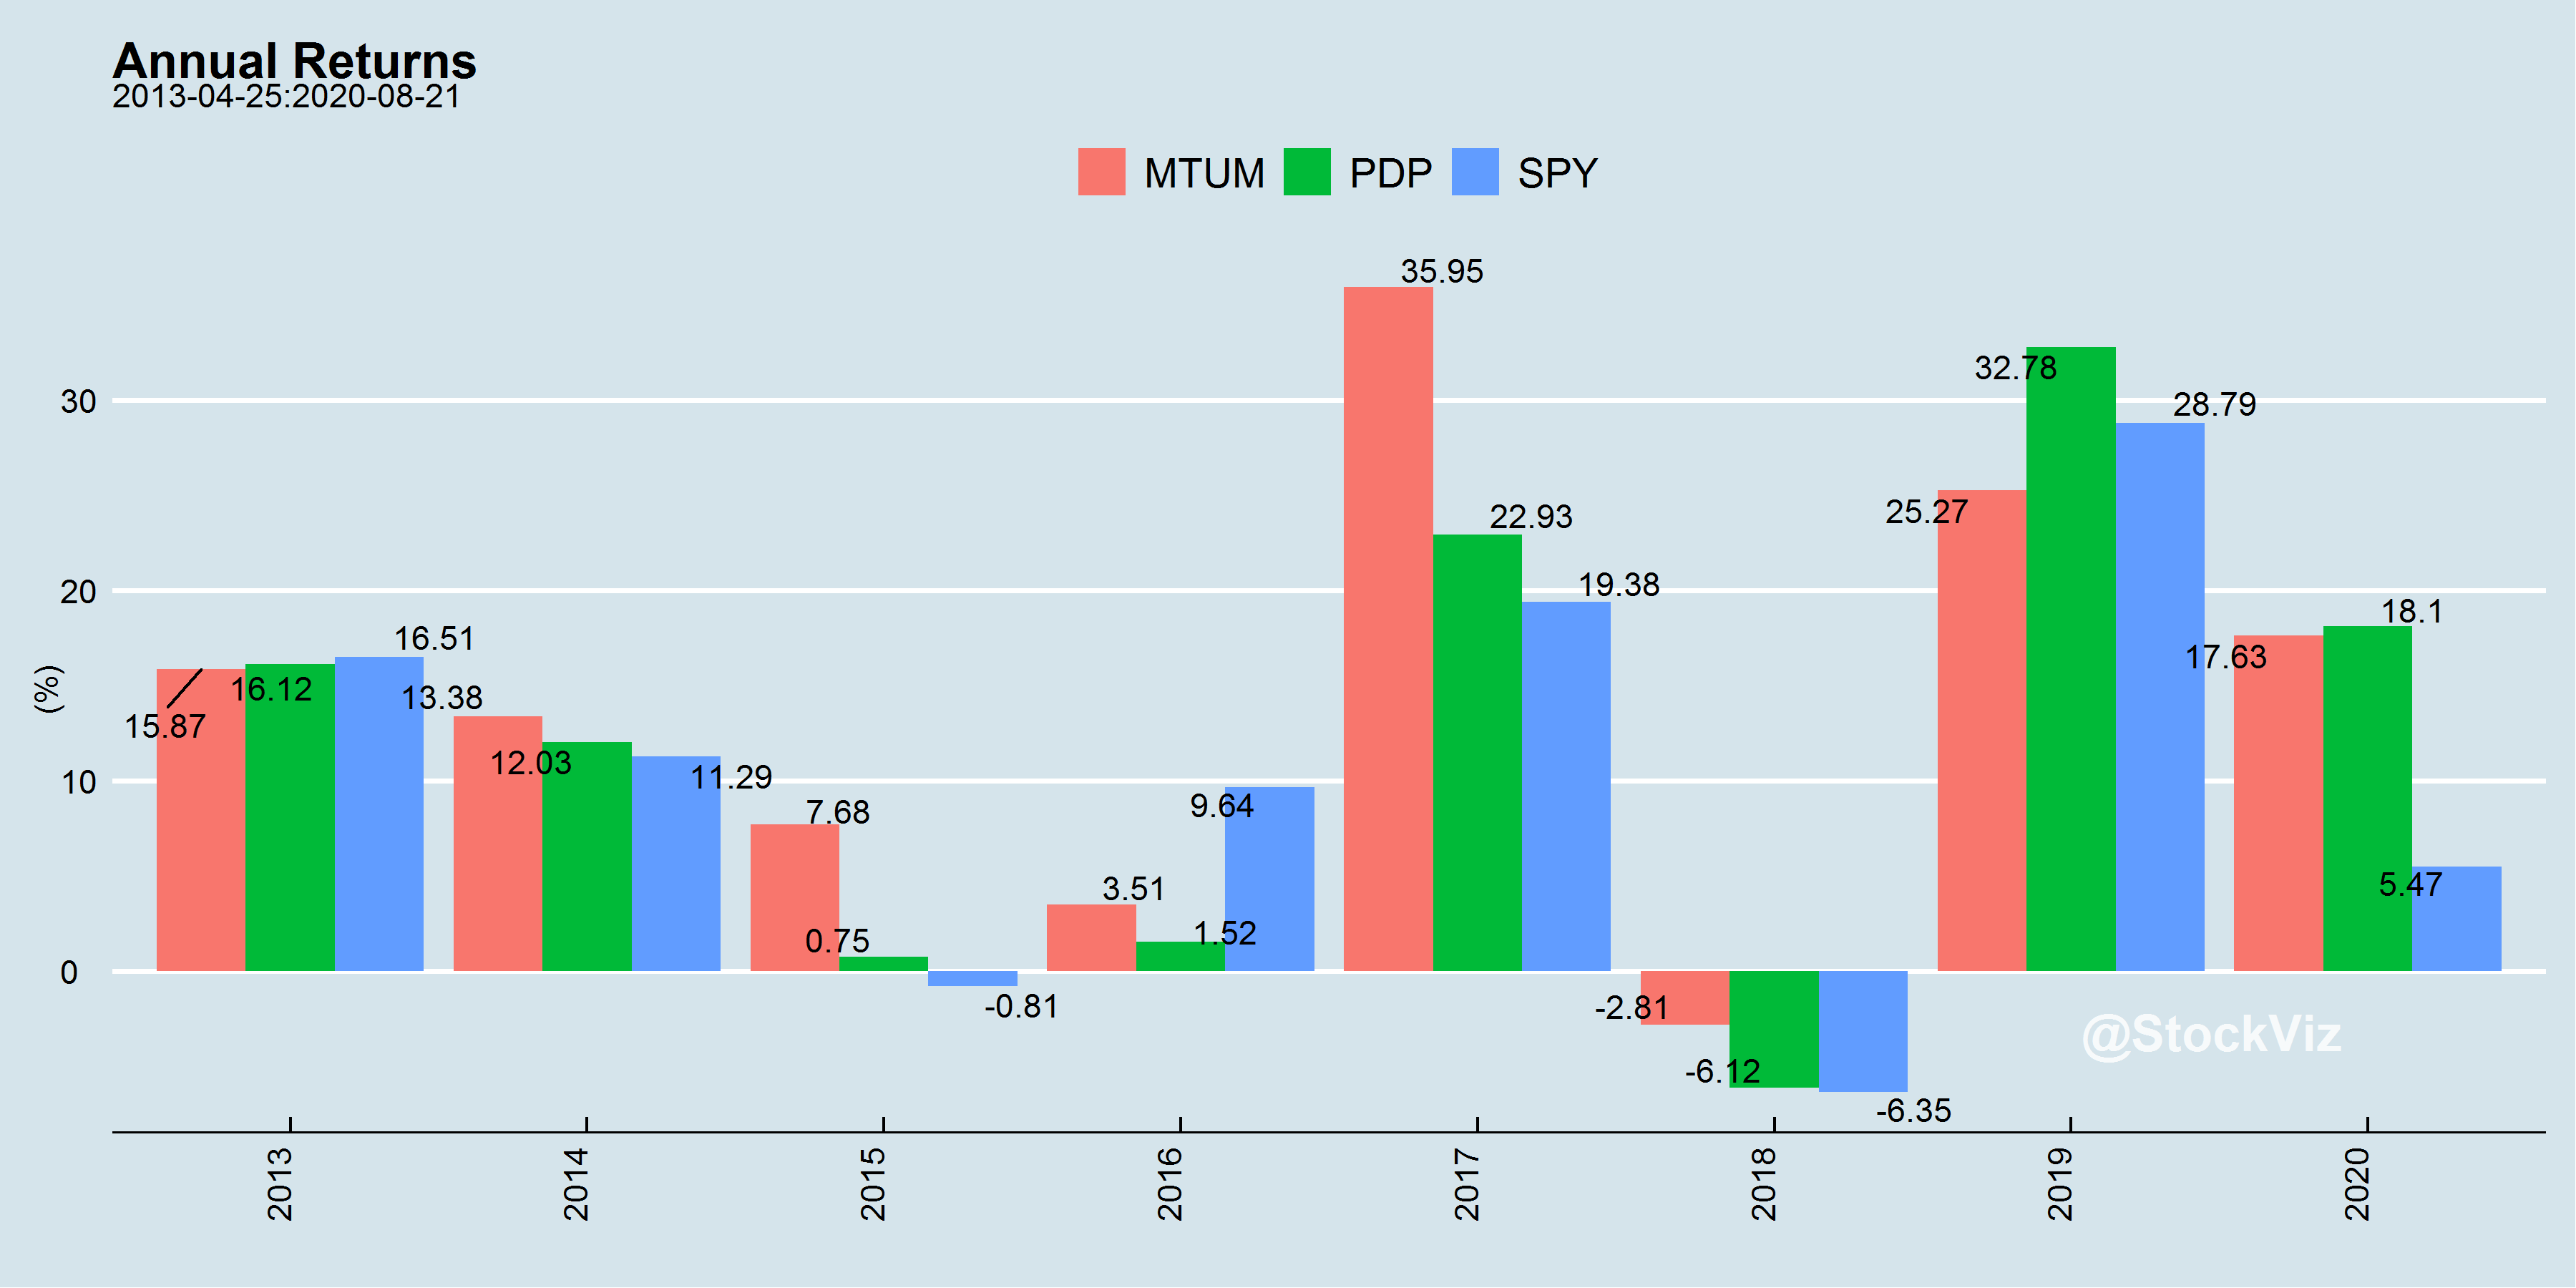
Momentum strategies have been packaged as an ETF for retail investors in the US for a while now. PDP, the Invesco DWA Momentum ETF, and MTUM, the iShares MSCI USA Momentum Factor ETF, are the 800-pound gorillas in the room.
The differences in performance highlight the different ways momentum strategies can be implemented.
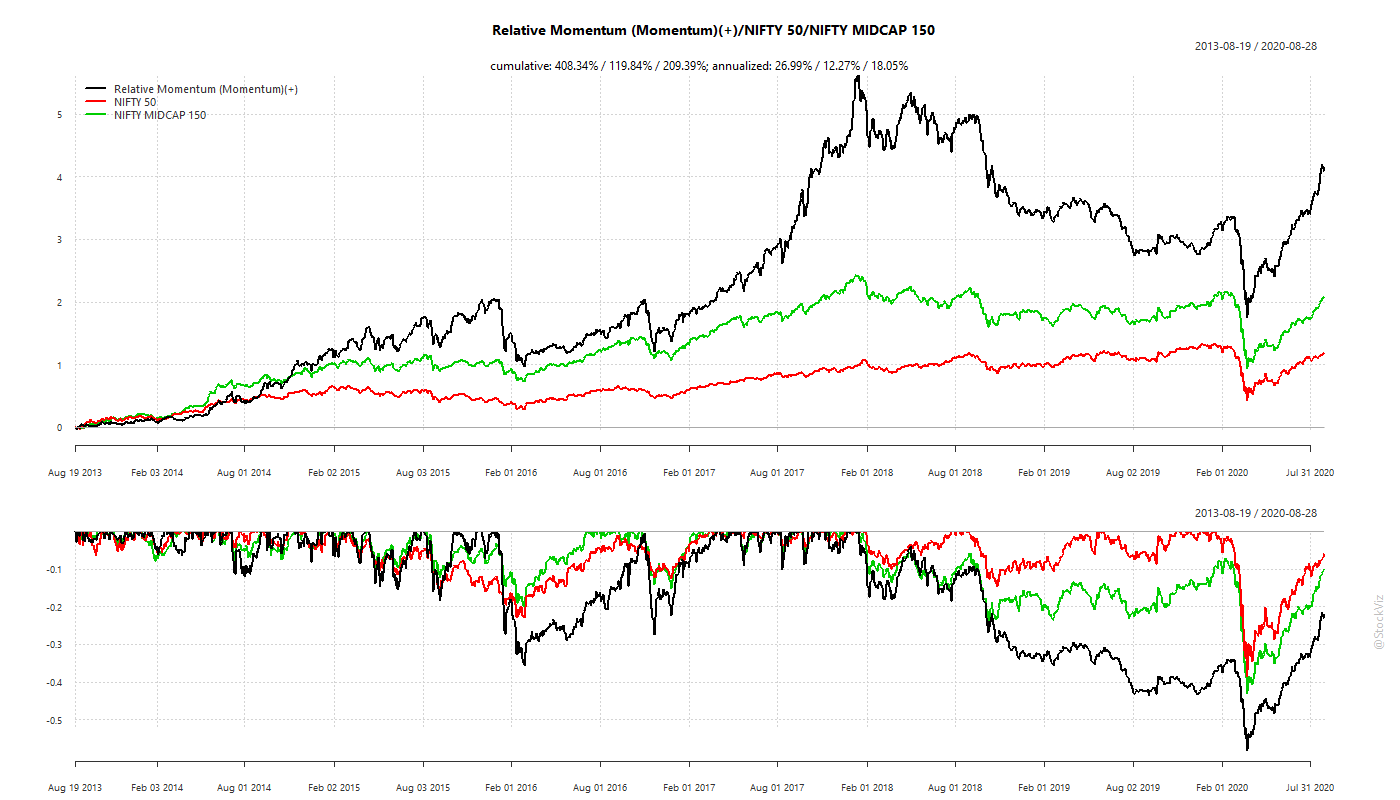
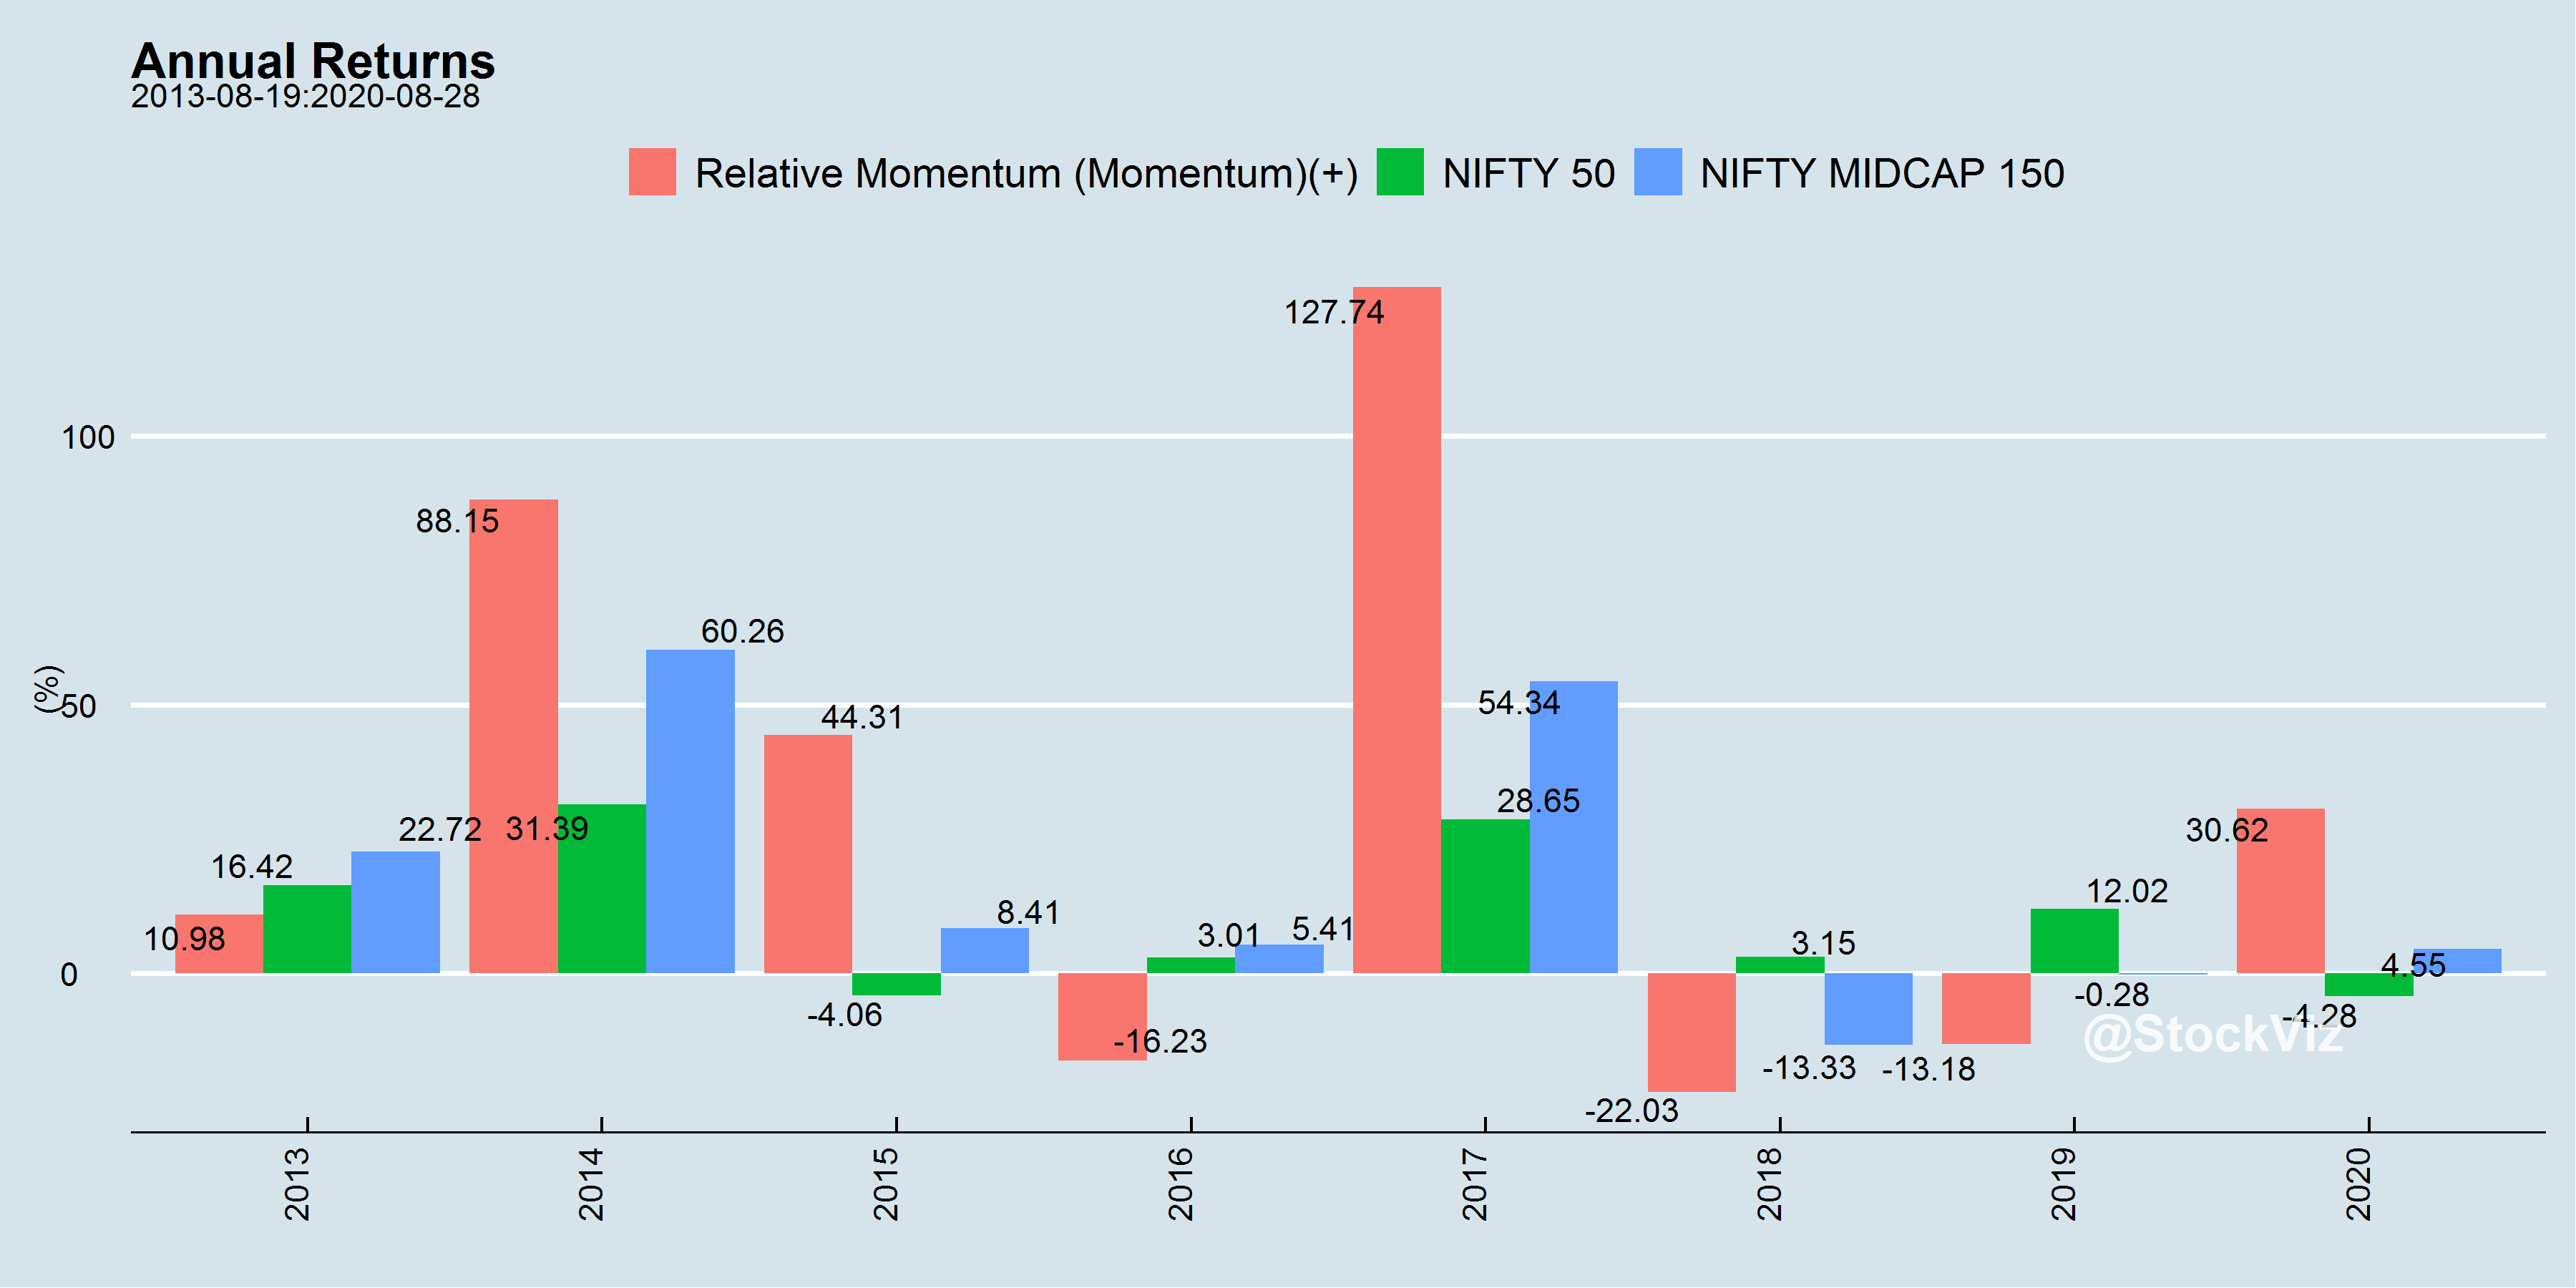
The Indian story is relatively new. A monthly-rebalance momentum strategy has delivered superior returns (although, with a massive dose of heartburn.)
Measures of Momentum
Once the J/T paper was out, academics got to work and systematically mapped out more than a dozen different ways to setup up momentum portfolios. The most common ones are:
12_2/12_1/12_0: These are the “original” momentum portfolios formed by only looking at absolute returns.
Relative: For each stock, create a distribution of relative returns over every other stock in the universe and use it to drive portfolio formation.
Acceleration: Rank stocks based on how well they have performed over the last 6-months vs. their preceding 6-month returns.
CAPM-α: Rank stocks based on their α over an index.
Sharpe ratio: Rank stocks based on their Sharpe ratios.
Idiosyncratic/Residual: Rank stocks based on what is left after fitting a Fama-French 5-factor model. i.e., whatever cannot be explained by the 5-factors.
52-week or All-time Highs: A portfolio of stocks who’s prices have hit either one-year of all-time highs.
These are further combined with some sort of risk management measure, like a stop-loss or a trend overlay. So, based on the universe of stocks, frequency of rebalancing, momentum measures and risk-management technique applied, there are hundreds of different “momentum” portfolios that can be created.
Conclusion
While momentum is now a well established investment strategy, it is not an easy one to be married to. Differences in portfolio construction: formation periods, skip months/weeks, stock universe, stop-losses, etc. have a big impact on overall performance.
While momentum definitively underlines the “no pain, no returns” maxim, in a twist of irony, academics discovered the “low-volatility” anomaly. What if, investors can take less pain for more returns? Stay tuned for our next Free Float!
Introducing the All Star Portfolio
Given the large number of choices in front of investors these days, we felt that there should be an on-ramp for those who want to just follow along a systematic strategy without committing their portfolios.
So, we built a momentum portfolio that is easy for first-time investors to follow along. We call this the All Star Portfolio and is based on stocks hitting their all-time-highs. Just subscribe to our substack and receive emails whenever there is a change in the portfolio.
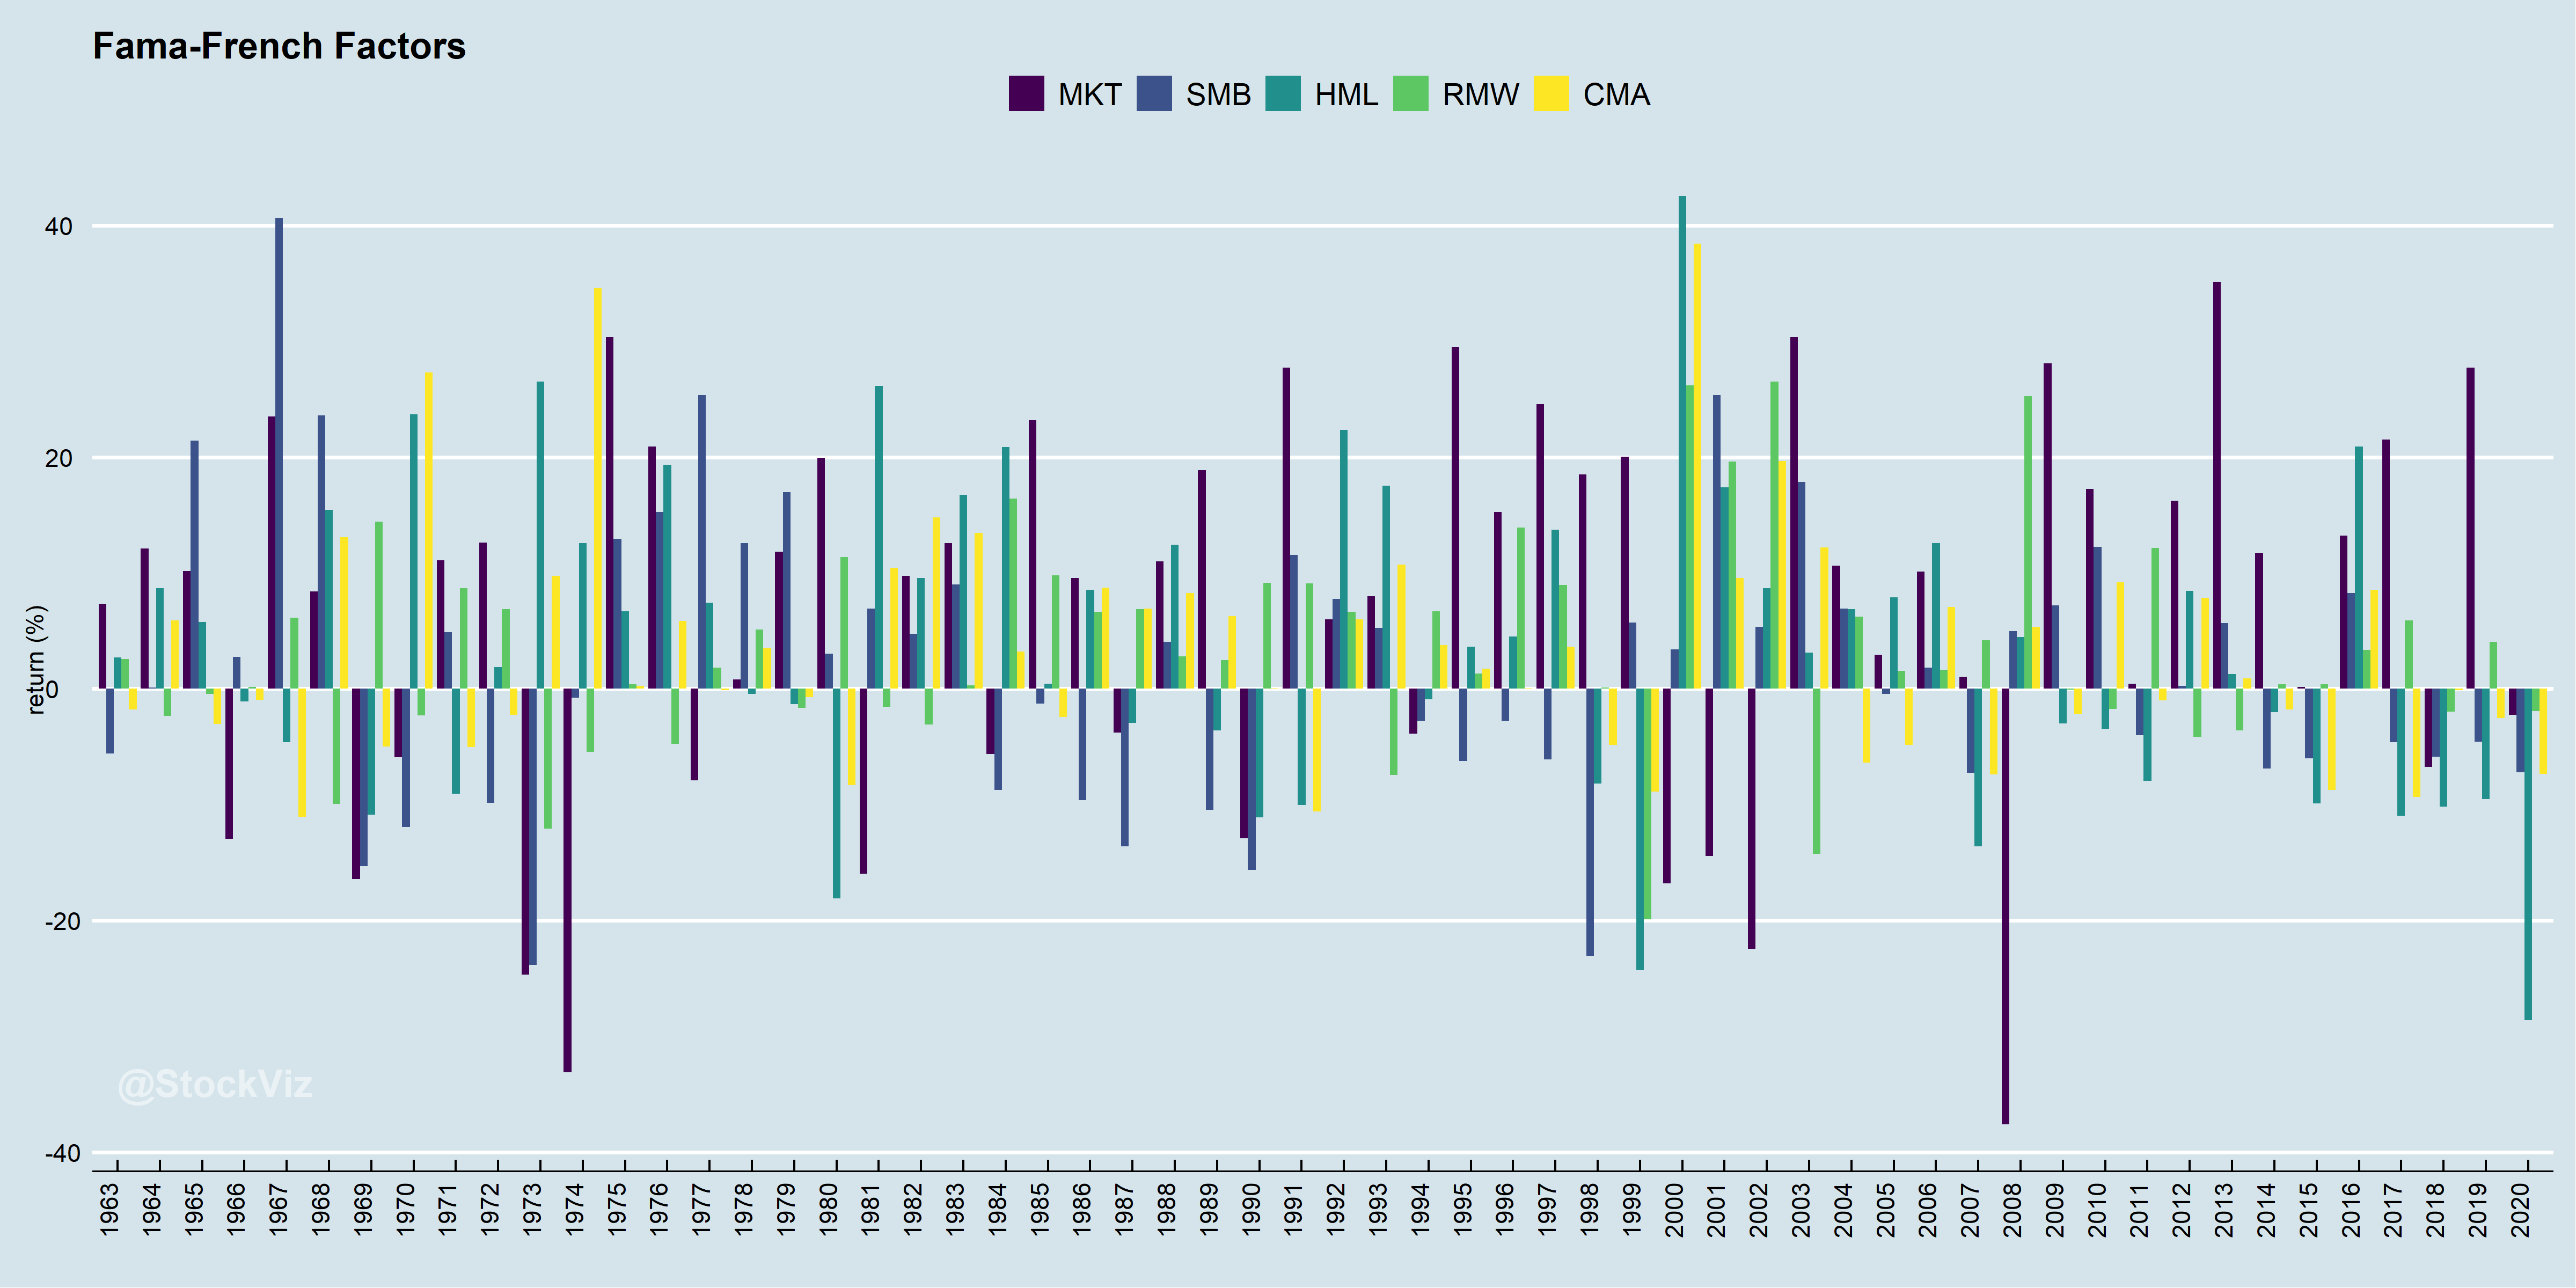
In our post on Intro to Factors, we showed how Fama and French added value (HML) and small-caps (SMB) to the original market-risk model to account for the relative out-performance of small-cap/value investment strategies. The genesis of their idea was basically that certain portfolio returns deviated significantly from the market-risk-only model and they wanted to see if they could account for it systematically.
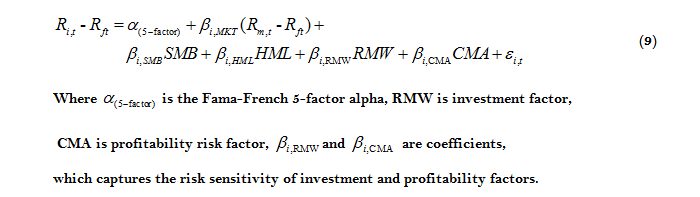
In 2014, they updated their model by adding 2 more factors: profitability (RWM) and investment (CMA) – stocks with a high operating profitability perform better and stocks of companies with the high total asset growth have below average returns.
No Free Lunch
Investors can construct long-only portfolios with a single leg of any one of these factors to exploit it.
For example, one can rank stocks by high book-to-price ratio, take the first 100 of them and create a value portfolio. Such a portfolio will have a high factor loading (ß) for HML.
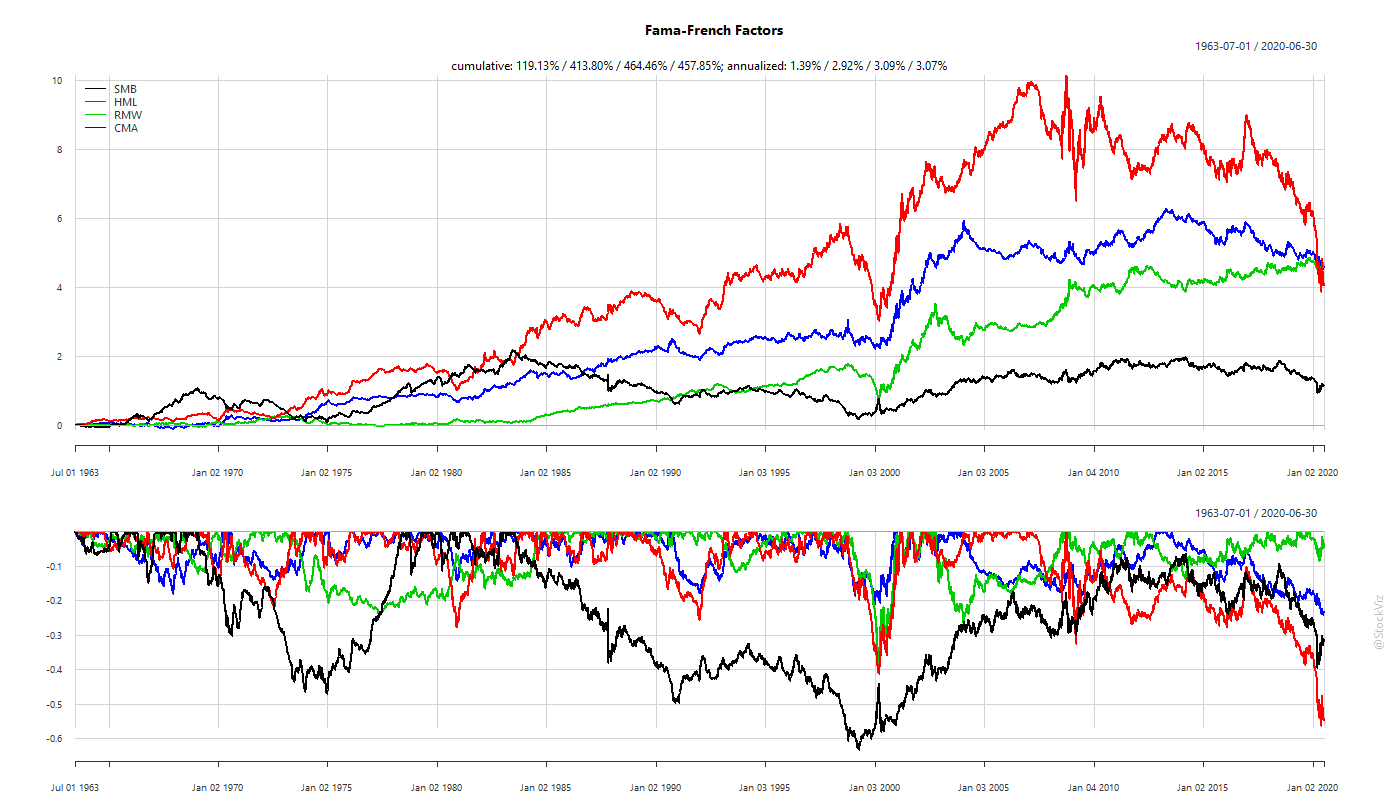
But just because you can do something like this, should you do it? Depends on your motivations. Factor returns ebb and flow. To visualize the cumulative effect of their spreads, you can plot them as a return series:
As you can see, single factors can spend years in negative territory. During that time, plain-old, low-cost market-beta would be racing ahead while a factor portfolio will be an expensive drag.
This leads us to posit that single factor portfolios are not buy-and-hold-forever investments. For example, during the final phases of a bull market, everything is expensive. So a portfolio of “pure value” stocks will be basically junk that no investor cares about. If you were to invest in such a portfolio, then when the market turns, these stocks are likely to drawdown way more than the rest of the market. If they were unloved in a bull, they will be massacred at the turn.
So unless you thoroughly understand the dynamics of how different factors behave in different market environments, you should stick to market beta.
The Factor Zoo
Fama and French opened the flood-gates for factor research. Academics rushed to discover and publish increasingly esoteric and often overlapping factors. At last count, there were over 400 factors published in various academic journals.
While some of them are a result of p-hacking and not all of them result in lasting alpha, there are a couple that have confounded academics and practitioners alike with their persistence: momentum and low-volatility.
Two economists walk down a road and they see a twenty dollar bill lying on the side-walk. One of them asks “is that a twenty dollar bill?” Then the other one answers “It can’t be, because someone would have picked it up already,” and they keep walking. (source)
In 1965, Eugene Fama published his dissertation arguing for the random walk hypothesis. i.e., stock market prices evolve according to a random walk (so price changes are random) and thus cannot be predicted. This was followed by Paul Samuelson, who published a proof showing that if the market is efficient, prices will exhibit random-walk behavior. (source)
Together, they form the basis of the efficient market hypothesis (EMH).
The efficient market hypothesis (EMH), is a hypothesis that states that share prices reflect all information and consistent alpha generation is impossible. According to the EMH, stocks always trade at their fair value on exchanges, making it impossible for investors to purchase undervalued stocks or sell stocks for inflated prices. Therefore, it should be impossible to outperform the overall market through expert stock selection or market timing, and the only way an investor can obtain higher returns is by purchasing riskier investments. (source)
Inefficiencies are opportunities
Any market practitioner knows that this is not entirely true. There are numerous hurdles in the way of pure efficiency:
Information is not free.
Liquidity is not unlimited.
Prices are not continuous.
Market statistics are forever in flux.
Investors have different goals and pursue different outcomes.
Taxes, rules and regulations.
According to EMH, a portfolio’s return could be fully explained by the market (source):
r = rf+ ß(rm – rf) + α
Where:
r = Expected rate of return
rf = Risk-free rate
ß= Beta
(rm – rf)= Market risk premium
This is a single-factor model. i.e., portfolio returns are only explained by market risk (rm – rf: market risk premium.) Whatever cannot be explained by the market is α, or the portfolio manager’s skill.
However, if you setup a portfolio in certain ways, you consistently ended up with higher returns, implying that there was something about the market, something systematic, that was not being captured by this equation. So, if you were rewarding a portfolio manager only on the basis of α calculated from the above equation, then you were probably over-paying the PM for harvesting something that the market offered for “free.”
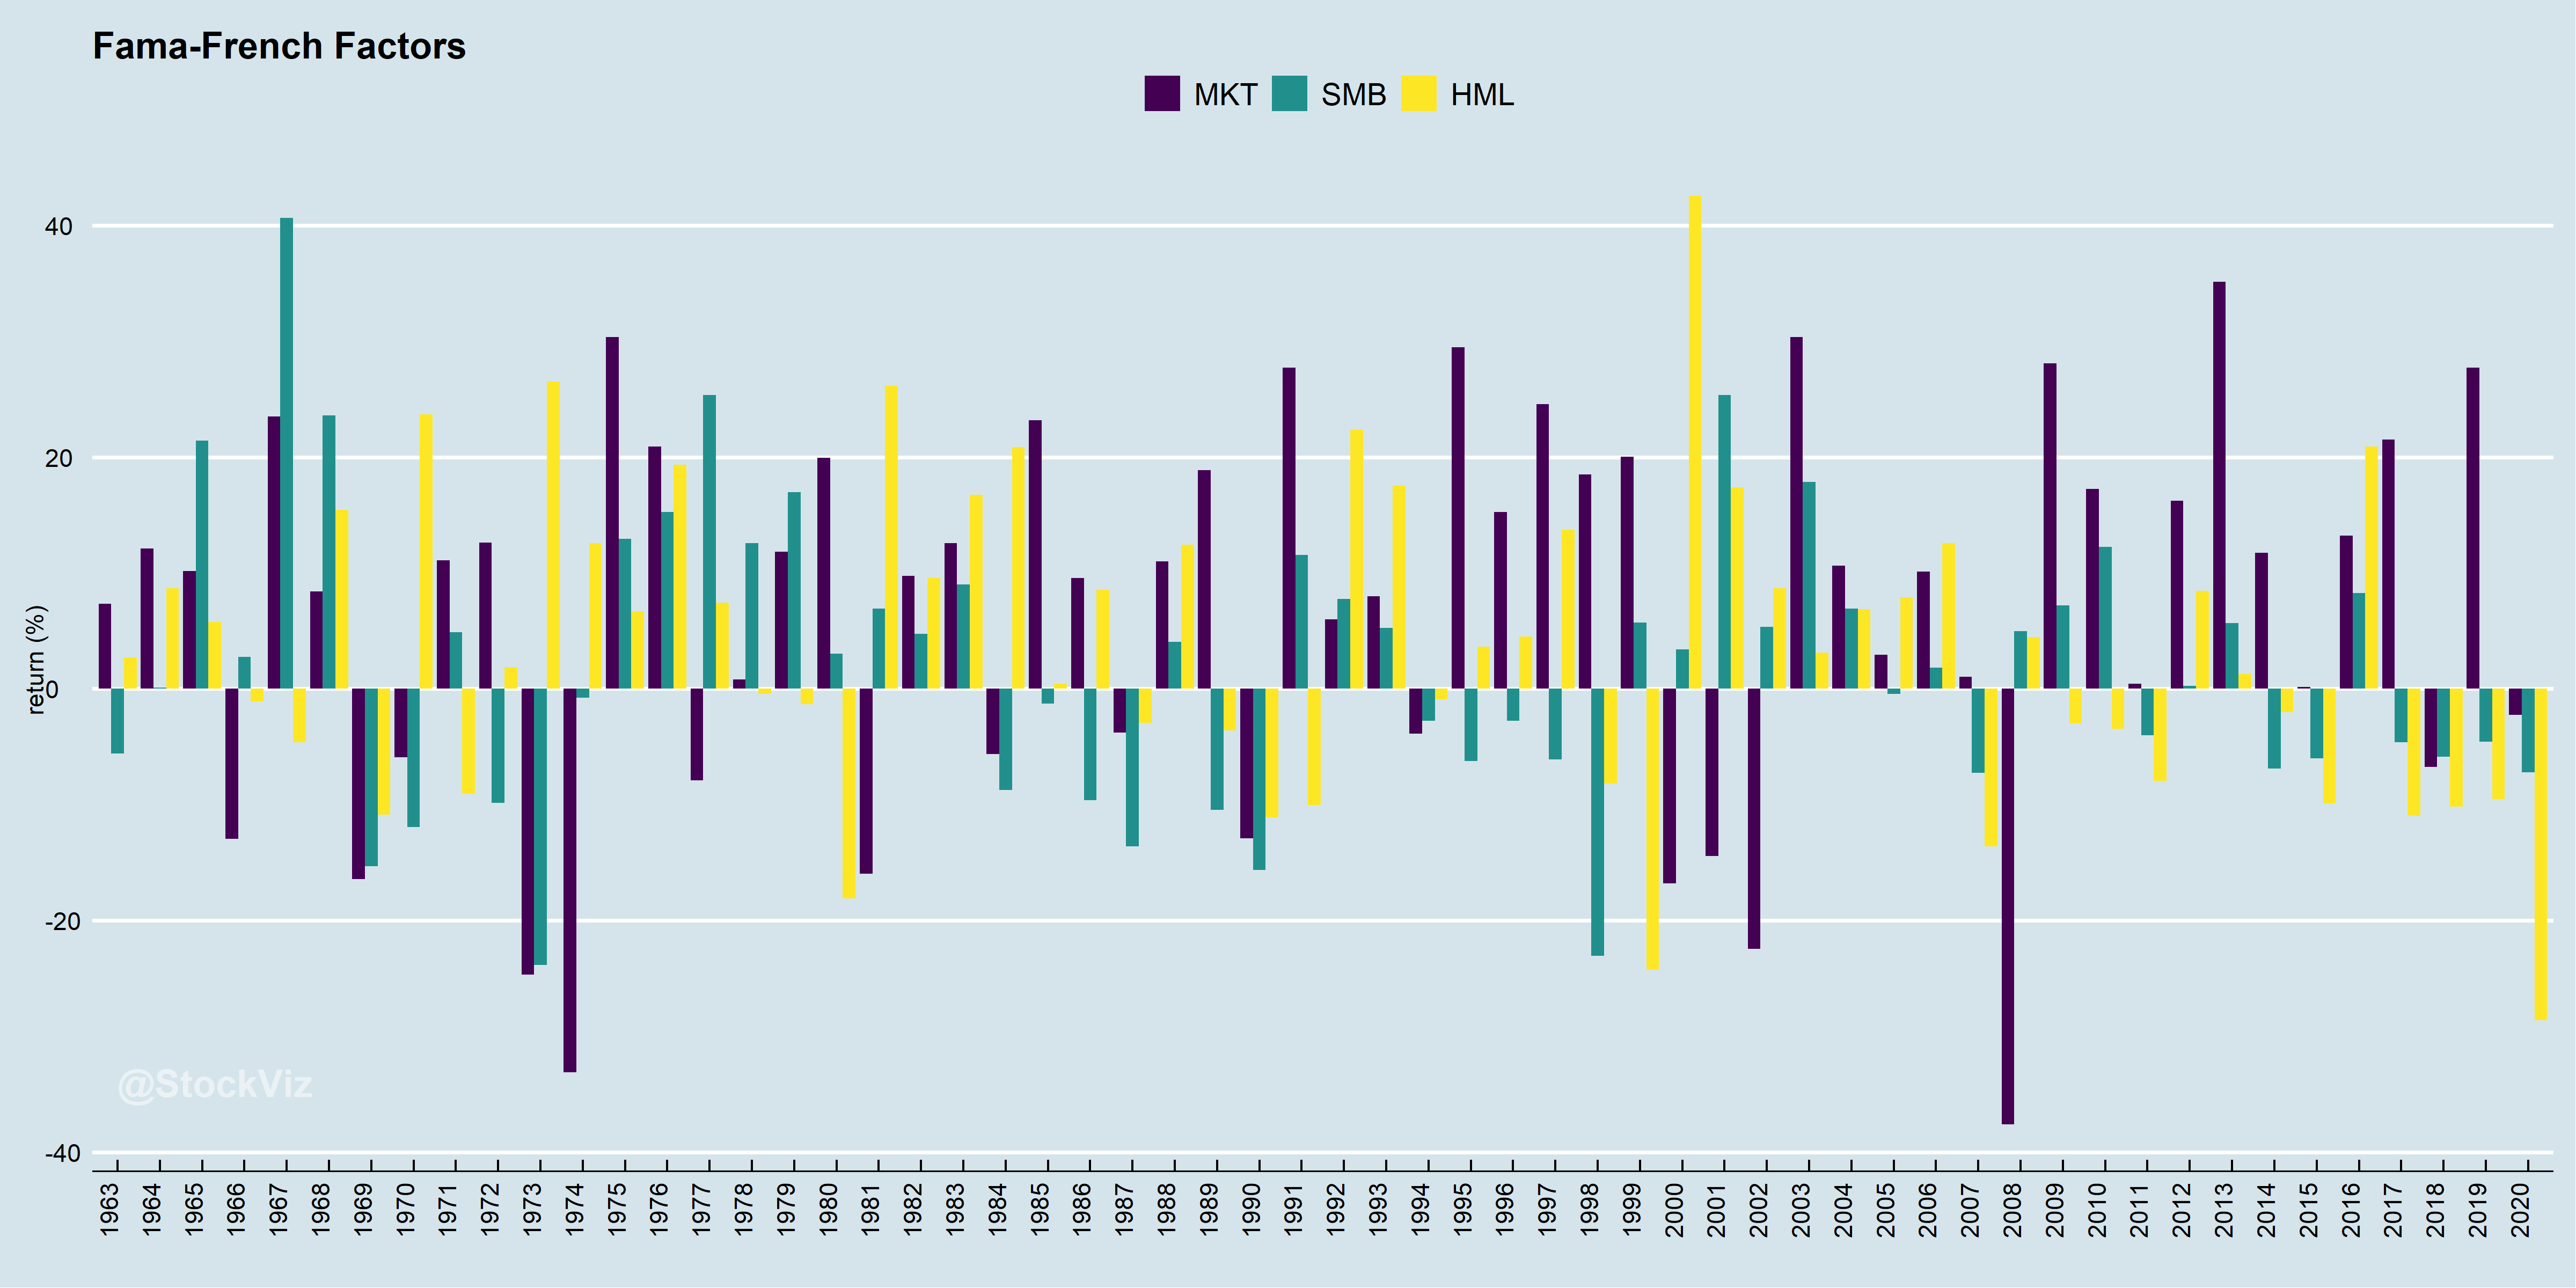
In 1992, Eugene Fama and Kenneth French designed a model to fix this – the Fama–French three-factor model.
The Fama-French model aims to describe stock returns through three factors: (1) market risk (rm – rf: market risk premium,) (2) the outperformance of small-cap companies relative to large-cap companies (SMB: Small Minus Big,) and (3) the outperformance of high book-to-market value companies versus low book-to-market value companies (HML: High Minus Low.) The rationale behind the model is that high value and small-cap companies tend to regularly outperform the overall market. (source)
Where:
r= Expected rate of return
rf = Risk-free rate
ß = Factor’s coefficient (sensitivity)
(rm – rf)= Market risk premium
SMB(Small Minus Big) = Historic excess returns of small-cap companies over large-cap companies
HML(High Minus Low) = Historic excess returns of value stocks (high book-to-price ratio) over growth stocks (low book-to-price ratio)
↋= Risk, or α
Think of SMB and HML as “base-rates.” A portfolio’s returns can now be explained by the degree of tilt (factor cofficients, ßs) it has towards value (HML) and small-caps (SMB). Furthermore, you can set up incentives for the portfolio manager that incorporates these factors so that he is rewarded only if he can out-perform a generic small-cap/value portfolio.
The academic definition of value (HML) and small-caps (SMB) is quite different from what investors are used to colloquially. Fama and French were interested in the decomposition of portfolio returns into sub-components (factors) and the persistence of these factors over many years/decades. They did this by constructing SMB and HML as long-short portfolios and analyzing the spread. It is very different from what the media refers to by these terms. It is useful to think of these as spreads and not as typical long-only “value” portfolio.
No pain, No gain
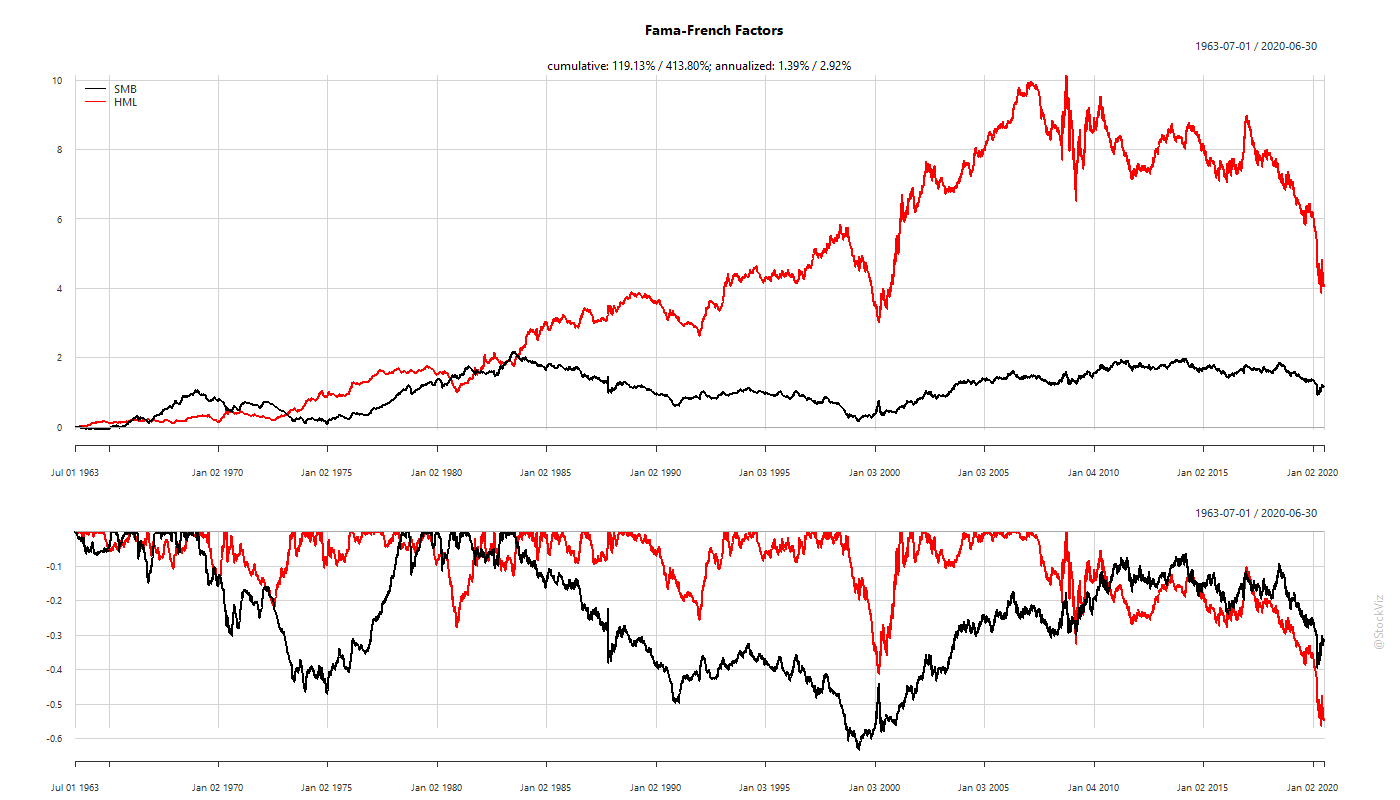
Just because these factors are persistent, doesn’t mean that they are always positive. A simple way to visualize this is to see the cumulative returns of the market risk premium (MKT = rm – rf) over SMB and HML.
There are periods of both out-performance and under-performance. In fact, one of the theories proposed to explain the persistence of these factors is behavioral: investors herd into value or small-caps based on recent out-performance. Thus, setting them up for subsequent under-performance. Upon which, they will exit en masse, allowing the factors to out-perform once again.
The real world is messy
Most investors are long-only. Whey we buy a value fund, for example, we are not really buying a Fama-French HML long-short portfolio. Our portfolios have a market beta and a bunch of other things affecting it besides high book-to-price ratio.
To visualize this, if we decompose the iShares Russell 1000 Value ETF, IWD, to its 3-factors, we get:
rf + 0.92*(rm – rf) –0.06*SMB +0.35*HML + α
Compared to iShares Russell 1000 Growth ETF, IWF:
rf + 1.03*(rm – rf) –0.05*SMB –0.27*HML + α
Conclusion
The Fama-French 3-Factor model is a useful tool to analyze investment portfolios. It allows us to decompose returns to different factors so that we can better understand the drivers of returns.
In Range: Why Generalists Triumph in a Specialized World (Amazon,) David Epstein write about how people with a wider array of skills and experience end up having a larger impact on society than people who go deep.
There are certain domains that are kind learning environments, like chess or golf, where patterns repeat over and over, and feedback is extremely accurate and usually very rapid. A learner improves simply by engaging in the activity and trying to do better. In wicked domains, like investing, the rules of the game are often unclear or incomplete, there may or may not be repetitive patterns and they may not be obvious, and feedback is often delayed, inaccurate, or both. In the most devilishly wicked learning environments, experience will reinforce the exact wrong lessons.
The story of why Stanley Druckenmiller was appointed the director of equity research in 1978 at the age of only 25 comes to mind. Speros Drelles, the director of investments, demoted Stanley Druckenmiller’s boss after his boss having been with the bank for over 25 years and was approximately 50 years old. [‘You know why I’m doing this, don’t you?’ –Speros Drelles] No. [‘For the same reason they send eighteen-year-olds into war.’ –Speros Drelles] Why is that? [‘Because they’re too dumb to know not to charge. The small cap [capitalization] stocks have been in a bear market for ten years, and I think there’s going to be a huge, liquidity-driven bull market sometime in the next decade. Frankly, I have a lot of scars from the past ten years, while you don’t. I think we’ll make a great team because you’ll be too stupid and inexperienced to know not to try to buy everything. That other guy out there [referring to Stanley Druckenmiller’s boss who he was just replacing] is just as stale as I am. (source)
One of my favorites from the book is this quote from Steven Levitt: “admonitions such as ‘winners never quit and quitters never win,’ while well-meaning, may actually be extremely poor advice.” Levitt identified one of his own most important skills as “the willingness to jettison” a project or an entire area of study for a better fit.
To solve tough problems, go wide rather than deep. And don’t hesitate to kill your darlings.