This is a review of the fifth chapter of John J. Murphy’s Technical Analysis of the Financial Markets.
Triple Tops and Bottoms
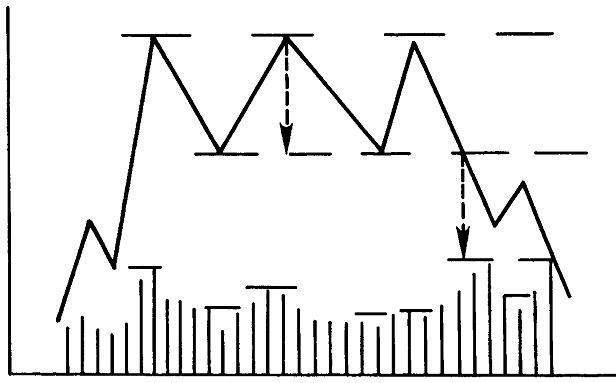 Triple Tops, as the name indicates, are identified as three peaks at the same level. Volume decreases with each successive peak at the top and should increase at the breakdown point.
Return moves to the lower lines are not uncommon.
Double Tops and Bottoms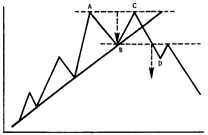
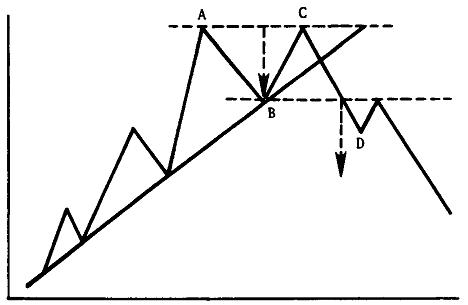
This pattern has two peaks (A&C) at about the same levels. The pattern is complete once the middle trough (B) is broken on a closing basis. Volume is lighter on the 2nd peak (C) and increases on the breakdown (D).
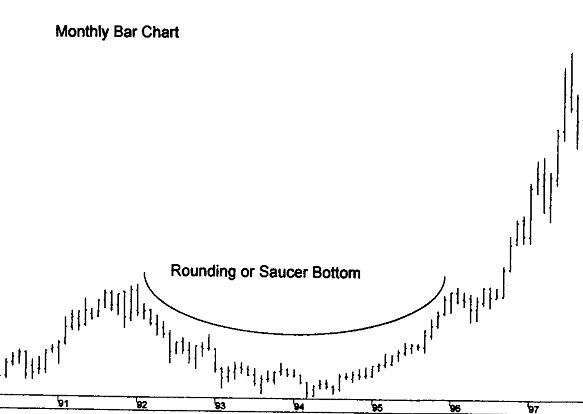
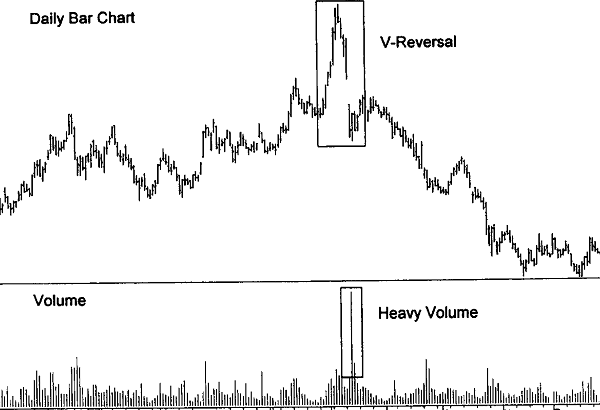
Saucers and Spikes
The saucer pattern shows a gradual turn from down to sideways to up and take a long time to form. Spikes are the most difficult to predict and usually occur when the markets are so overextended on one side that a piece of news or event triggers a sudden movement to the other side.
Next: Chapter 6 – Continuation Patterns