As the saying goes, all good things must come to an end. Even in these difficult times, gold loan non-banking finance companies (NBFCs) saw roaring sales and record margins. According to ratings agency ICRA, “`Gold loan companies have reported an estimated compounded annual growth rate (CAGR) of over 100% during the last three years, with the portfolios of the top three companies cumulatively exceeding Rs. 410 billion as on Dec. 31, 2011.
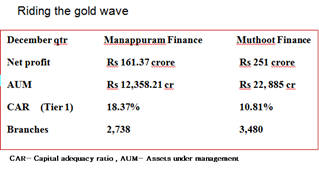
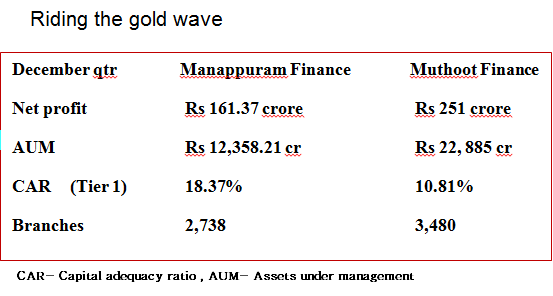
Consider this- During the third quarter of the current fiscal, Manappuram Finance [stockquote]MANAPPURAM[/stockquote] more than doubled its net profit from a year ago to Rs. 161.37 crore, loan disbursements surged 86% while assets under management rose 90% to Rs. 12,358.21 crore. Industry leader Muthoot Finance [stockquote]MUTHOOTFIN[/stockquote] posted a 61% growth in net profit to Rs 251 crore, while total income galloped 91% to Rs 1,231crore and assets under management increased by Rs 1,944 crore to Rs 22,885crore.
 But the honeymoon is over. Fearing risks to banking system and retail investors due to the sharp surge in loan against gold, the Reserve Bank of India (RBI) tightened lending rules saying these companies can’t lend more than 60% of the value of gold jewelry. It also directed them to maintain a minimum tier-1 capital of 12% by April 2014 while depriving them of granting loans against bullion, primary gold and gold coins.
![clip_image001[6]](http://stockviz.biz/wp-content/uploads/2012/03/clip_image0016_thumb1.png) RBI’s moves are not without reason. The sharp surge in gold prices has resulted in an equally sharp increase in demand for gold loans, especially in rural areas. Since these NBFCs depend heavily on public funds like bank loans and non-convertible debentures, any reversal in gold prices will not only catch NBFCs off guard but may also pose a systemic threat, affecting banks and retail investors.
RBI’s moves are not without reason. The sharp surge in gold prices has resulted in an equally sharp increase in demand for gold loans, especially in rural areas. Since these NBFCs depend heavily on public funds like bank loans and non-convertible debentures, any reversal in gold prices will not only catch NBFCs off guard but may also pose a systemic threat, affecting banks and retail investors.
While the prudential norms has found favour with experts who believe it would improve the sector’s asset quality in the long-run and help them absorb any sharp volatility in gold prices, they maintain that the lower loan-to-value- (LTV) ratio will moderate disbursement volumes and result in business ![clip_image001[8]](http://stockviz.biz/wp-content/uploads/2012/03/clip_image0018_thumb.png) shifting to unorganized players like moneylenders who can still extend loans at higher LTV ratios.
shifting to unorganized players like moneylenders who can still extend loans at higher LTV ratios.
Gold NBFCs, which are used to high profit margins, may have to reduce interest rates to prevent borrowers from shifting elsewhere, which will take the sheen out of their high flying business. Business growth is likely to fall from 80 per cent per annum to 20-25 per cent per annum and return on assets (RoA)may moderate from the current high level of 4.5 per cent to 2.5-3.0 per cent.


![clip_image001[6]](http://stockviz.biz/wp-content/uploads/2012/03/clip_image00161.png)
![clip_image001[8]](http://stockviz.biz/wp-content/uploads/2012/03/clip_image0018.png)


![clip_image001[7]](http://stockviz.biz/wp-content/uploads/2012/03/clip_image0017.png)
![clip_image001[17]](http://stockviz.biz/wp-content/uploads/2012/03/clip_image00117.png)
![clip_image001[19]](http://stockviz.biz/wp-content/uploads/2012/03/clip_image00119.png)

