It is the season of scams and the cozy nexus between the Great Indian political class, babus and corporate India has exploded. Apart from unraveling the Indian style of doing business, the expose threatens to lay bare ‘the dirty picture’ of crony capitalism. The coal block allocation scam is the latest loot of national resource in various sectors like coal, oil, gas, power, mobile-phone licenses etc.
The sharp spurt in economic growth has been matched by an equally sharp increase in the quantum of frauds. While the ruling Congress-led UPA has sunk deep into corruption, history reveals that other parties like the BJP, SP and other regional parties are not any better.
Just like the 2G scam where a scarce resource like spectrum was doled out by Union Telecom Minister A Raja to his hand-picked companies, the latest CAG report on coal block allocation shows how land was given at throwaway price to GMR’s Delhi airport, coal was given to private players like Essar Group, Jindal, Adani, ArcelorMittal and Tata Steel without bidding. [stockquote]TATASTEEL[/stockquote] [stockquote]ADANIENT[/stockquote] [stockquote]JINDALSTEL[/stockquote]
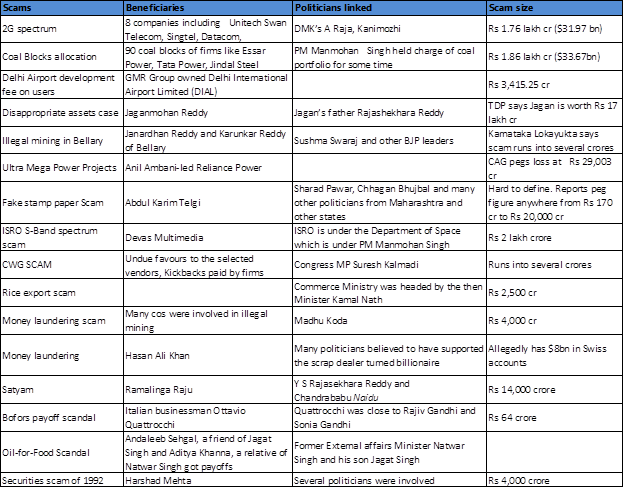
While the recent CAG reports have thrown the spotlight back on crony capitalism, India is no alien to business-politics nexus. Jagan Mohan Reddy created a multi-million dollar empire in no time, thanks to undue favors from his then Chief Minister father late Rajasekhara Reddy.
The Bellary brothers including billionaire and mining magnate G. Janardhana Reddy ran their illegal iron ore mining business with impunity, thanks to BJP’s patronage. Their political clout ran across party lines and they were also linked to both Jagan Reddy and his father.
Even BCCI’s billion-dollar baby, the Indian Premier League, which included businessman, politicians and film stars, has been implicated for financial irregularities that run into crores.
The controversial S-Band spectrum deal between ISRO’s commercial arm Antrix and private firm Devas Multimedia was scrapped after it emerged that undue favors were given to the private company. The loss from the scandal was pegged at more than Rs 2 lakh crore.
The issue of black money, currently the toast of the nation, gathered steam after Pune stud farm owner Hasan Ali Khan was nabbed in a massive money laundering scam and accused of amassing wealth of over $8bn in Swiss banks. While many influential politicians have been linked to the scrap dealer turned billionaire, none have so far been substantiated.
 Seasoned watchers explain that the perfect example of crony capitalism was played out in one of the country’s largest companies. Till Murli Deora was at the helm of the oil ministry, Reliance Industries, run by Mukesh Ambani had a free run as Deora was seen close to the Ambanis. Ever since he was shunted out and Jaipal Reddy took over, the fortunes of RIL turned worse and the company’s run-in with regulators over KG-D6 gas basin has intensified. [stockquote]RELIANCE[/stockquote]
Coming back to scams, who can forget Ramalinga Raju and his Satyam Computers [stockquote]SATYAMCOMP[/stockquote]. Raju was seen as close to both former CMs of Andhra Pradesh Y S Rajasekhara Reddy and N Chandrababu Naidu. While both ministers rode on the back of Satyam Computers and Raju to showcase the city as an IT den, once the Rs 14,000 crore scam exploded, none wanted to associate themselves with the fallen hero.
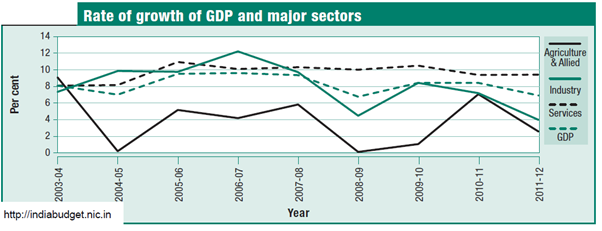
Even as the tainted government battles to save its skin, the fallout of such scams has been widespread. Parliament functioning has been stalled due to political gridlock, macro environment for investment has worsened, policy reforms are in deep freeze, risk aversion has increased, decision-making at the government’s administrative machinery has completely slowed down and business sentiment has taken a beating. Is it any surprise that the country’s GDP growth is languishing at a decade low of 5.5% in Q1?