When you read about Ponzi schemes, “chit funds”, teak plantations, ULIPs, variable annuities, etc… you might be led to think that these are because people don’t know any better. So maybe we only try and educate them, they’ll know how to spot these scams and stay way from them. However, that doesn’t seem to be the case.
Ponzi schemes are everywhere
You would think that in the US, after all the billions of dollars spent on education, regulation and enforcement, people would know better. From ponzitracker.com:
Nearly six years after the word “Ponzi scheme” became a household name thanks to Bernard Madoff, Ponzi schemes continue to proliferate and leave a trail of financial destruction in their wake as demonstrated by newly-compiled data showing more than $1 billion of newly-uncovered schemes and over 600 years in prison sentences handed down in the first half of 2014. In the first six months of 2014, at least 37 Ponzi schemes were uncovered, with a total of more than $1 billion in potential losses. This equated to the discovery of a Ponzi scheme (1) more than once per week, (2) every 4.9 days, or (3) every 118 hours. Included in this list are at least three Ponzi schemes with estimated losses of at least $100 million or more, with the estimated $300 million in losses in the alleged TelexFree Ponzi scheme ranking as the largest Ponzi scheme exposed in the first half of 2014.
“Real” Finance is strange
Morgan Housel at fool.com:
- People are ignorant around costs.
- If I want to be a firefighter, I need extensive training. If I want to manage the firefighters’ retirement fund, I need a nice suit and a sales pitch.
- Finance is filled with people who remain in business despite awful track records.
- Finance is taught overwhelmingly as a math-based field, in which students learn how to calculate beta by hand and dissect a balance sheet in their sleep. In the real world, finance is overwhelmingly a psychology-based field, where the best investors are those who control their emotions.
- There are few other subjects in which people have an obligation to understand something, yet so many willingly choose not to.
The Behavior gap is as wide as ever
In the US, over the past 20 years, “equity fund” investors achieved an average 5.02% annualized return, which is 4.2% less than the 9.22% that he/she could have achieved by simply investing funds in an S&P500 index-tracking fund.
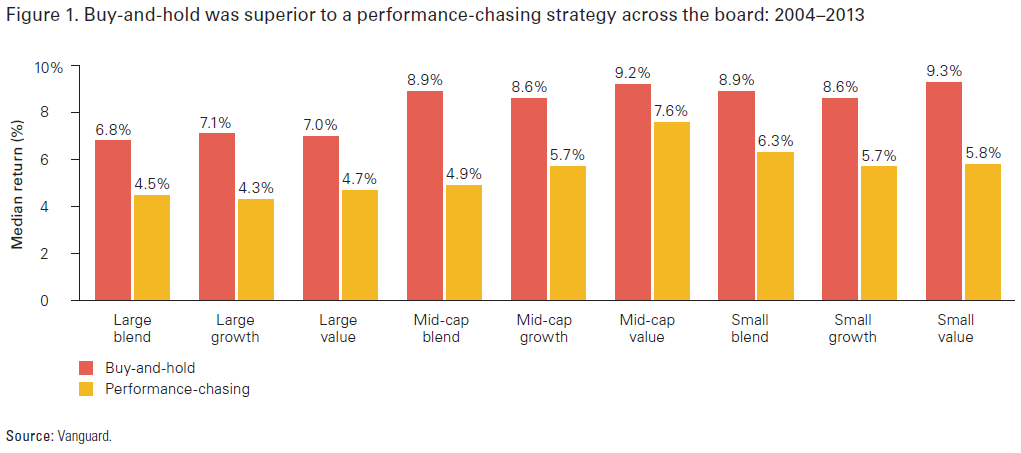
Investors chase performance. Here’s how Vanguard simulated performance chasing behavior in a recent study:
Initial investment: At the start of the analysis period, we invested in any fund in existence for the full three-year period from 2004 through 2006 that had an above-median three-year annualized return.
Sell rule: Using three-year rolling periods of returns, we moved forward one calendar year at a time. Funds that achieved below-median three-year annualized returns at any time were sold, as were funds that were discontinued.
Reinvestment rule: After any sale, we immediately reinvested in each fund that achieved an average annualized return within the top-20 performing funds in the style box over the prior three-year rolling period.
Here are the results:
Sounds legit
Real Step Pashupalan brought to you by Step Up Marketing Pvt. Ltd (SUMPL) (Source)
SUMPL is engaged in rearing of livestock mainly goats etc. for its customers long with the rearing of the livestock, SUMPL has also been selling livestock to the customers for a consideration wherein the purchaser has the option of keeping the purchased livestock with SUMPL for breeding and rearing purposes only for a period of 3.5 years as per the terms and conditions laid down in the application form given to the purchaser at the time of purchase of the livestock. In case the purchaser of the livestock decides to keep the same with SUMPL for rearing, a Certificate of Goat Keeping would be issued by SUMPL bearing a registration number against the goats which purchaser opted to keep with them.
And if owning goat certificates is not your thing, how about real estate? Viswas Real Estates and Infrastructures India Limited (VREIL) came out with these gems: (Source)
- Own Your Property Advance Scheme Monthly Plans
- Lumpsum Property Advance Schemes
- LPAS-MIS Platinum Plan, and
- Own Your Property Advance Scheme (Daily) Plans
It was sort of like a layaway plan for real estate combined with insurance. The customer pays a monthly installment of 500/- which at the end of the year becomes 6,000/- which is the total property advance paid. On this amount, the estimated compensation value (ECV) is 600/- and thus, the refund amount with ECV after one year is 6,600/-. On receipt of the total advance amount, VREIL executes simple mortgage deed (without possession) in favour of the investor. VREIL also offers insurance coverage in conjunction with its schemes.
Yes, regular people invested in these plans and SEBI recently busted them.
Conclusion
Regulators and policy makers would do well to study the behavioral and psychological forces that cause investors to make irrational decisions. The focus so far has been on the brain, it should be on the investors’ hearts instead.