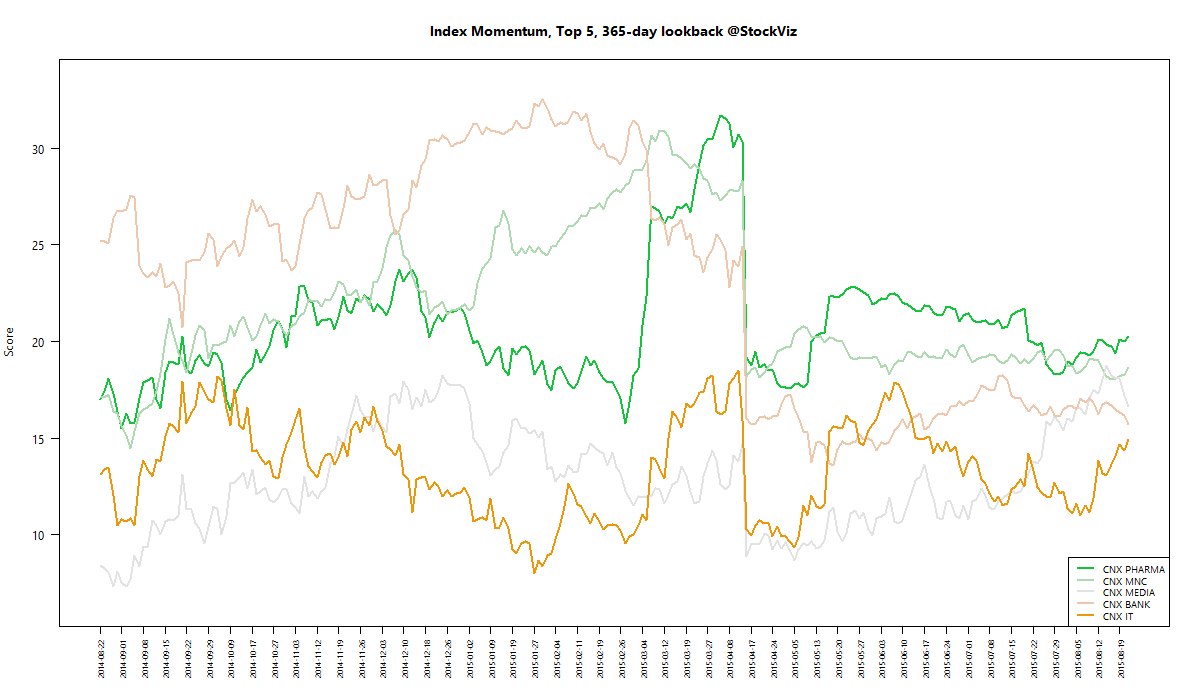
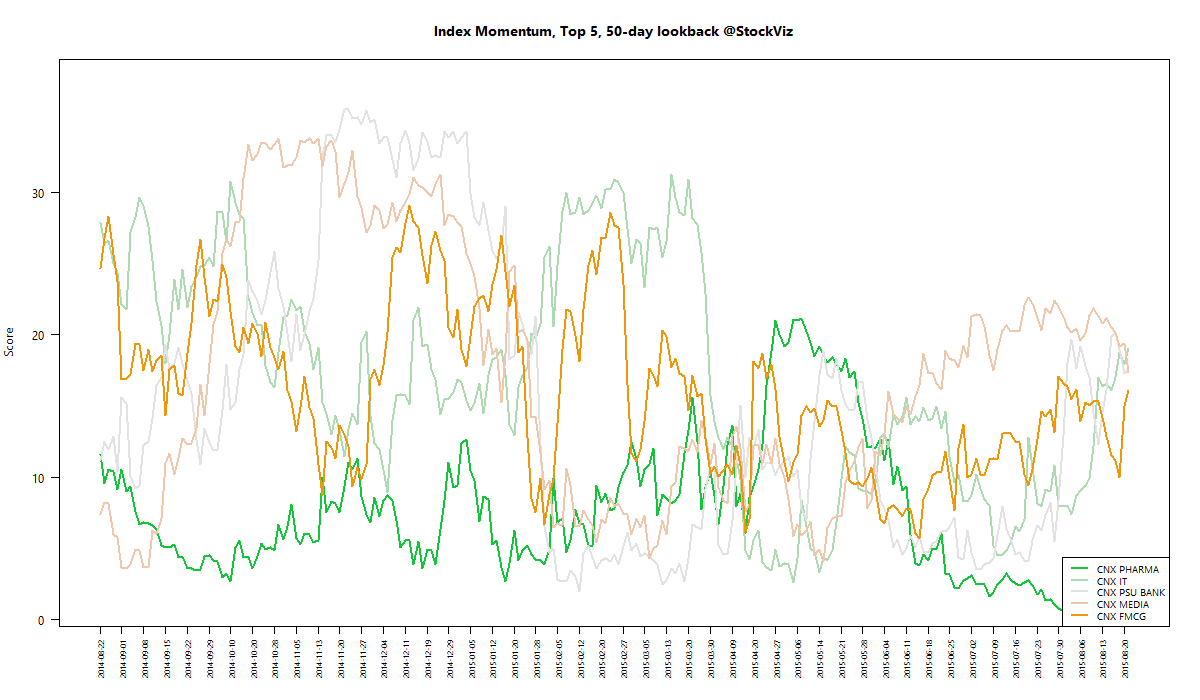
MOMENTUM
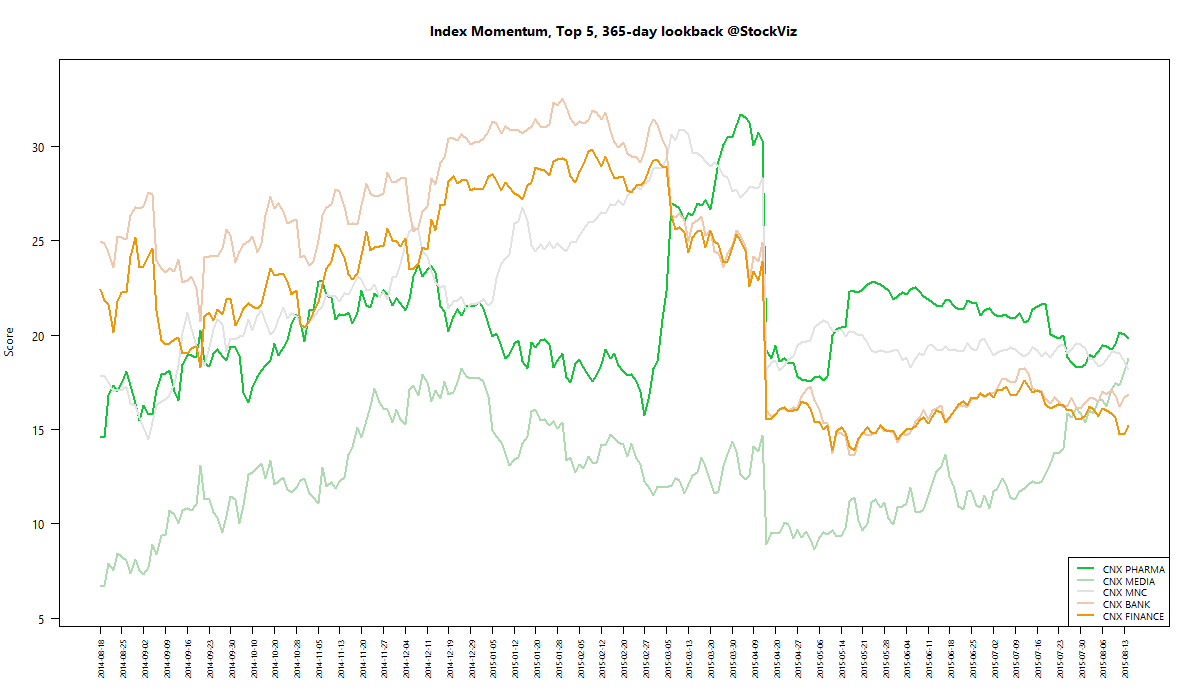
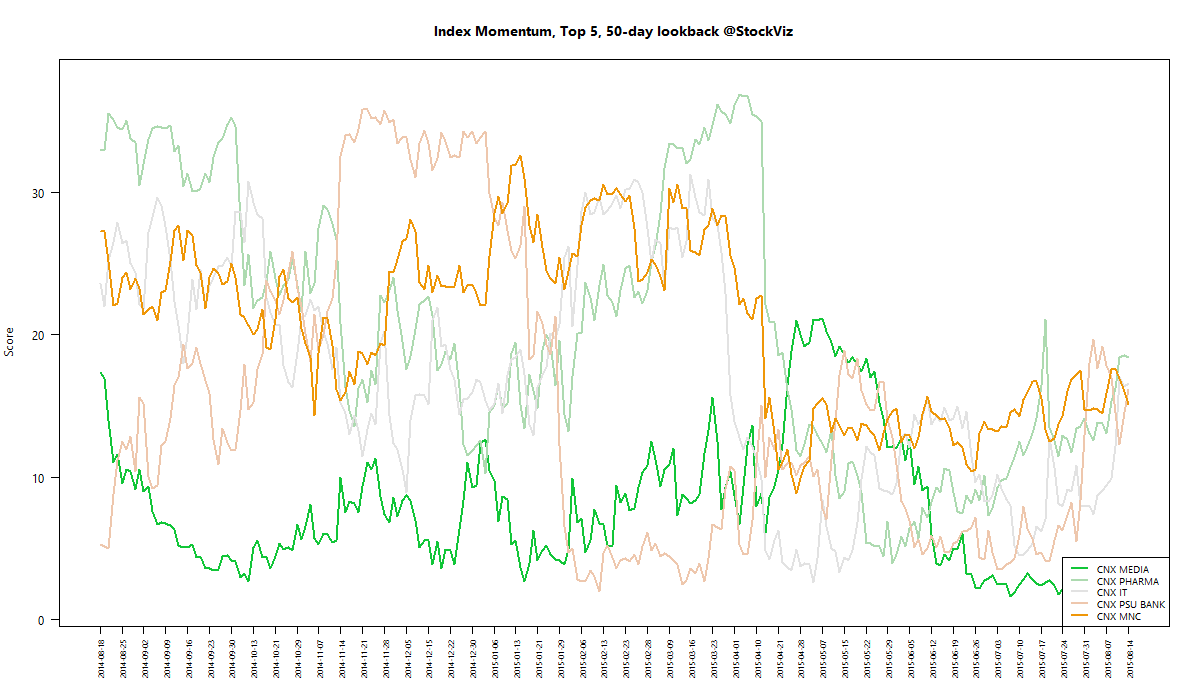
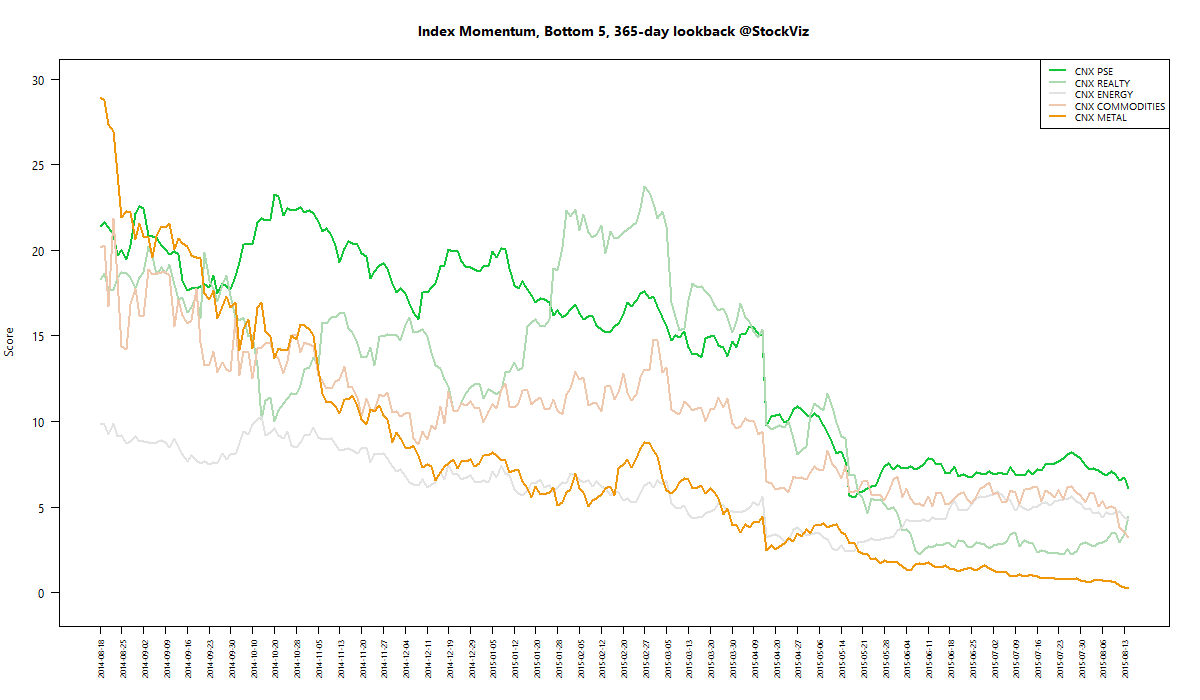
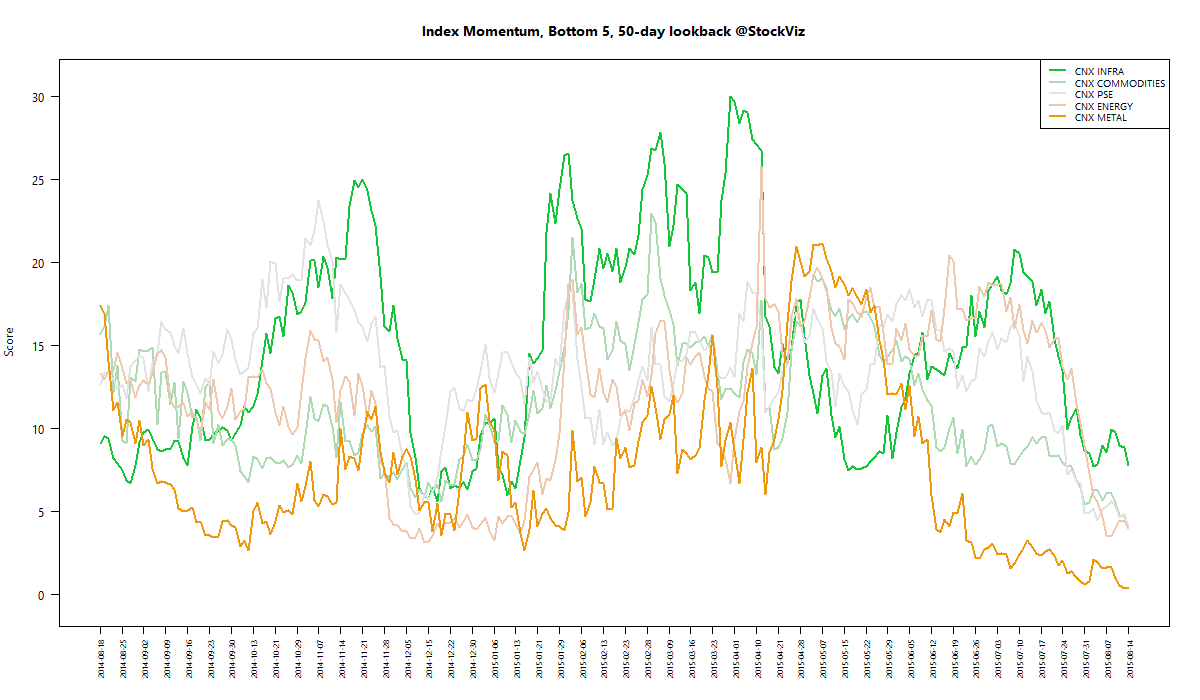
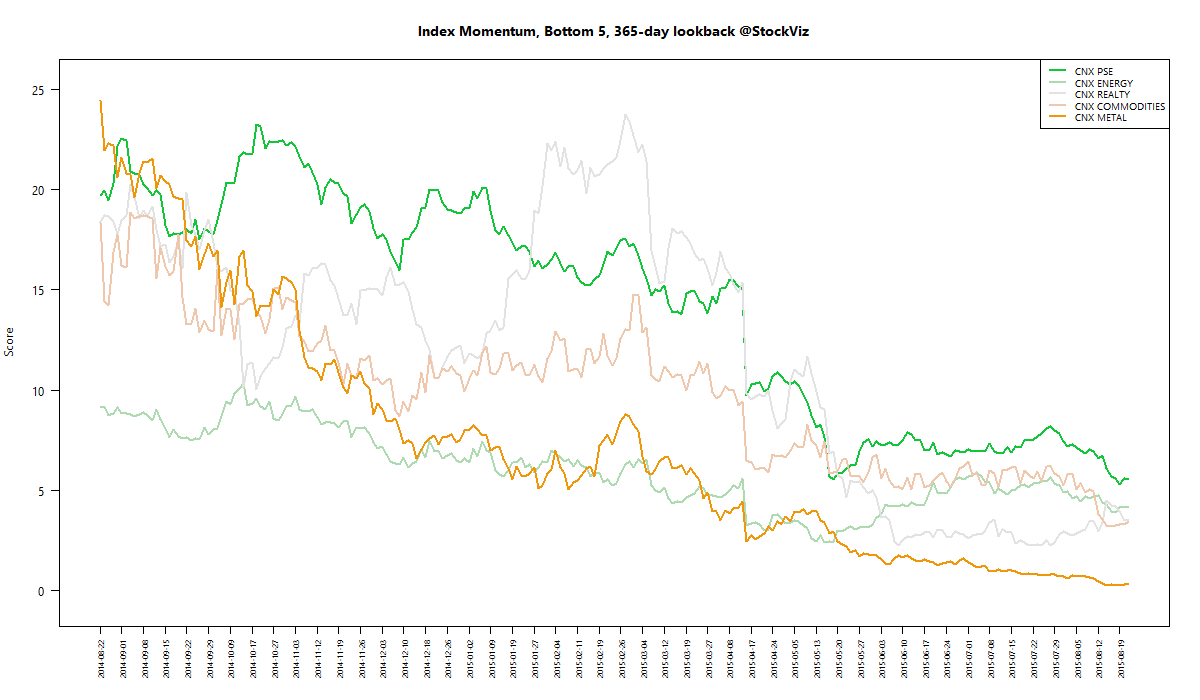
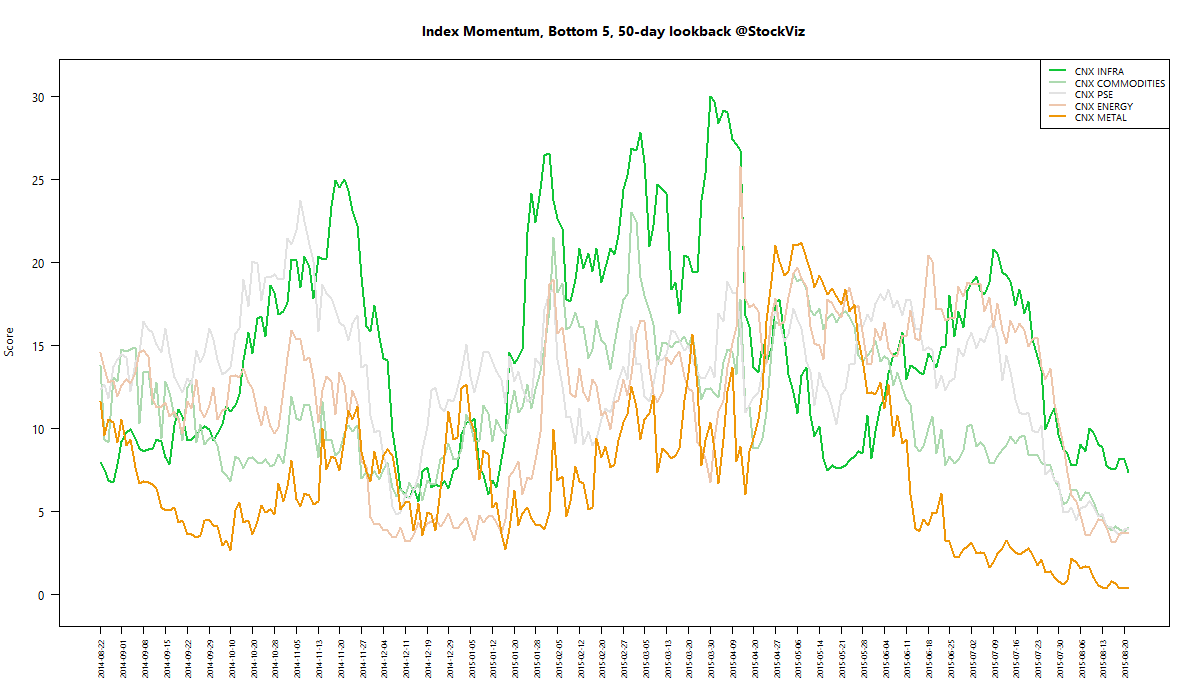
We run our proprietary momentum scoring algorithm on indices just like we do on stocks. You can use the momentum scores of sub-indices to get a sense for which sectors have the wind on their backs and those that are facing headwinds.
Traders can pick their longs in sectors with high short-term momentum and their shorts in sectors with low momentum. Investors can use the longer lookback scores to position themselves using our re-factored index Themes.
You can see how the momentum algorithm has performed on individual stocks here.
Here are the best and the worst sub-indices:
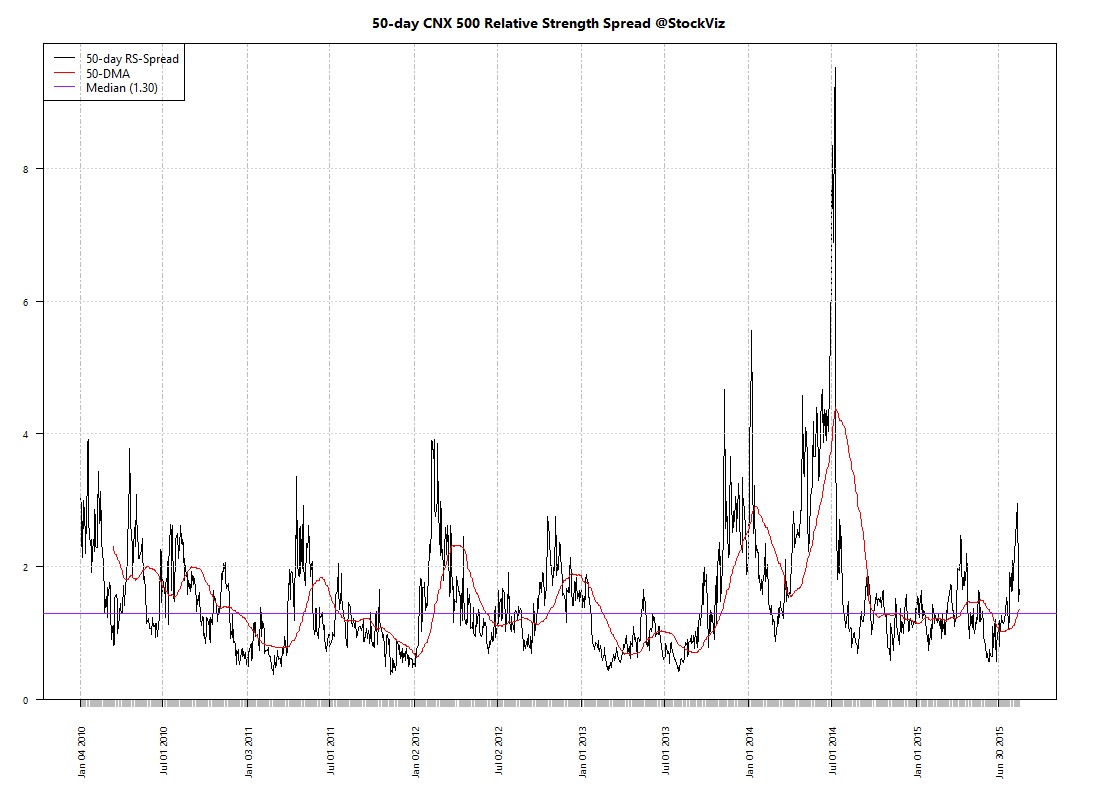
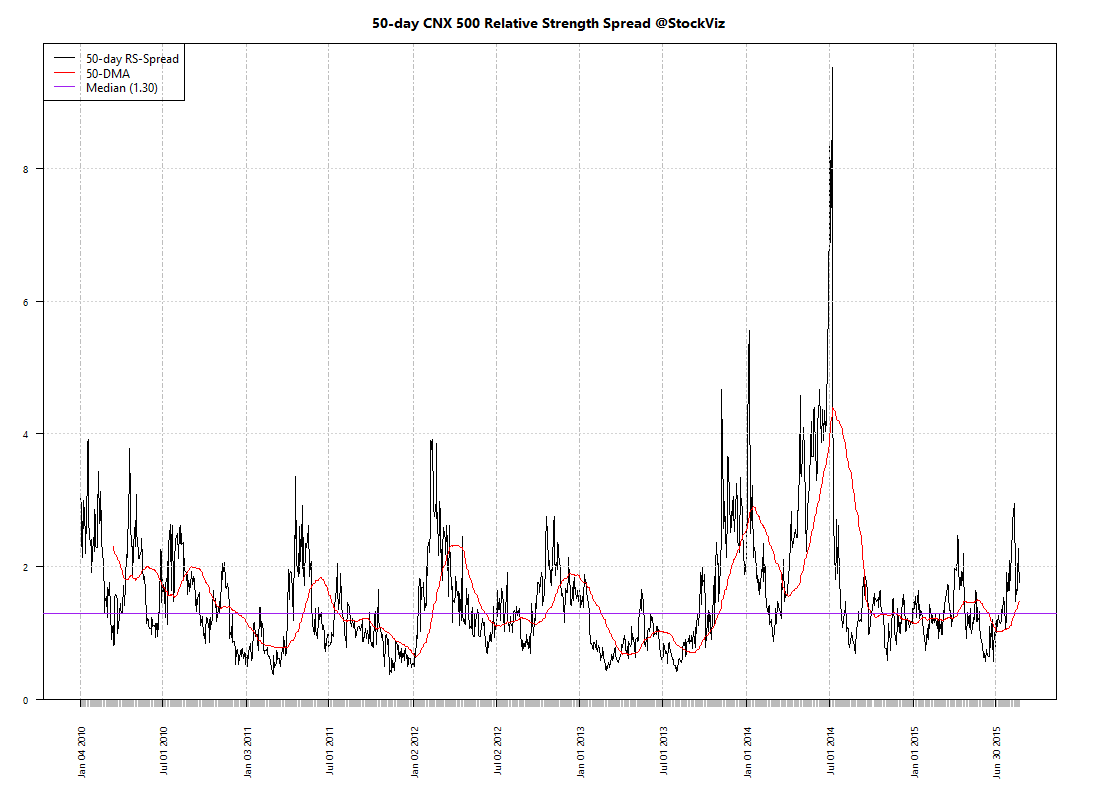
Relative Strength Spread
Refactored Index Performance
50-day performance, from June 15, 2015 through August 21, 2015:
Trend Model Summary
| Index |
Signal |
% From Peak |
Day of Peak |
| CNX AUTO |
SHORT |
7.89
|
2015-Jan-27
|
| CNX BANK |
LONG |
12.15
|
2015-Jan-27
|
| CNX COMMODITIES |
LONG |
34.50
|
2008-Jan-04
|
| CNX CONSUMPTION |
SHORT |
3.78
|
2015-Aug-05
|
| CNX ENERGY |
LONG |
33.41
|
2008-Jan-14
|
| CNX FMCG |
SHORT |
7.13
|
2015-Feb-25
|
| CNX INFRA |
LONG |
50.11
|
2008-Jan-09
|
| CNX IT |
LONG |
87.40
|
2000-Feb-21
|
| CNX MEDIA |
LONG |
20.08
|
2008-Jan-04
|
| CNX METAL |
LONG |
66.83
|
2008-Jan-04
|
| CNX MNC |
SHORT |
3.39
|
2015-Aug-10
|
| CNX NIFTY |
SHORT |
7.74
|
2015-Mar-03
|
| CNX PHARMA |
LONG |
2.61
|
2015-Apr-08
|
| CNX PSE |
LONG |
31.90
|
2008-Jan-04
|
| CNX PSU BANK |
SHORT |
35.02
|
2010-Nov-05
|
| CNX REALTY |
SHORT |
91.14
|
2008-Jan-14
|
| CNX SERVICE |
SHORT |
8.30
|
2015-Mar-03
|
The few areas of strength were in CONSUMPTION, MNC and PHARMA. Momentum strategies would have gotten shellacked given the brutal mean reversion in relative strength spread.