Equities
| MINTs | |
|---|---|
| JCI(IDN) | +1.24% |
| INMEX(MEX) | +2.96% |
| NGSEINDX(NGA) | -4.11% |
| XU030(TUR) | +2.72% |
| BRICS | |
|---|---|
| IBOV(BRA) | +8.65% |
| SHCOMP(CHN) | +0.32% |
| NIFTY(IND) | +1.04% |
| INDEXCF(RUS) | +2.54% |
| TOP40(ZAF) | +0.26% |
Commodities
| Energy | |
|---|---|
| Brent Crude Oil | +1.43% |
| Ethanol | +2.70% |
| Heating Oil | -0.44% |
| Natural Gas | +4.52% |
| RBOB Gasoline | +1.21% |
| WTI Crude Oil | +1.54% |
| Metals | |
|---|---|
| Copper | -0.33% |
| Gold 100oz | +1.09% |
| Palladium | +2.78% |
| Platinum | +1.12% |
| Silver 5000oz | +3.21% |
Currencies
| MINTs | |
|---|---|
| USDIDR(IDN) | -0.55% |
| USDMXN(MEX) | +0.77% |
| USDNGN(NGA) | +3.17% |
| USDTRY(TUR) | -0.45% |
| BRICS | |
|---|---|
| USDBRL(BRA) | -3.02% |
| USDCNY(CHN) | -0.08% |
| USDINR(IND) | +0.09% |
| USDRUB(RUS) | -3.12% |
| USDZAR(ZAF) | -1.54% |
| Agricultural | |
|---|---|
| Cattle | +0.68% |
| Cocoa | +0.64% |
| Coffee (Arabica) | -1.43% |
| Coffee (Robusta) | -0.29% |
| Corn | -3.32% |
| Cotton | -0.47% |
| Feeder Cattle | -1.49% |
| Lean Hogs | -2.37% |
| Lumber | +4.66% |
| Orange Juice | +9.06% |
| Soybean Meal | -1.38% |
| Soybeans | +0.80% |
| Sugar #11 | +1.58% |
| Wheat | -2.14% |
| White Sugar | -0.43% |
Credit Indices
| Index | Change |
|---|---|
| Markit CDX EM | +0.15% |
| Markit CDX NA HY | -0.52% |
| Markit CDX NA IG | +1.57% |
| Markit CDX NA IG HVOL | +3.01% |
| Markit iTraxx Asia ex-Japan IG | +0.10% |
| Markit iTraxx Australia | +1.12% |
| Markit iTraxx Europe | +1.12% |
| Markit iTraxx Europe Crossover | +8.18% |
| Markit iTraxx Japan | +3.92% |
| Markit iTraxx SovX Western Europe | -0.58% |
| Markit LCDX (Loan CDS) | +0.00% |
| Markit MCDX (Municipal CDS) | +0.59% |
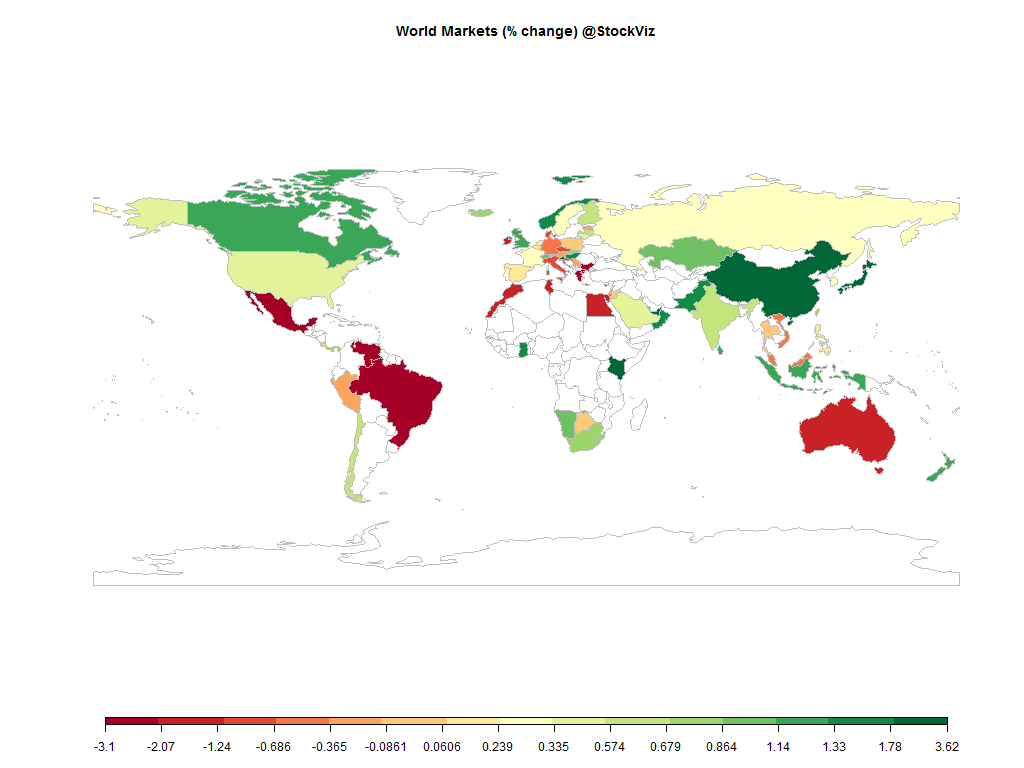
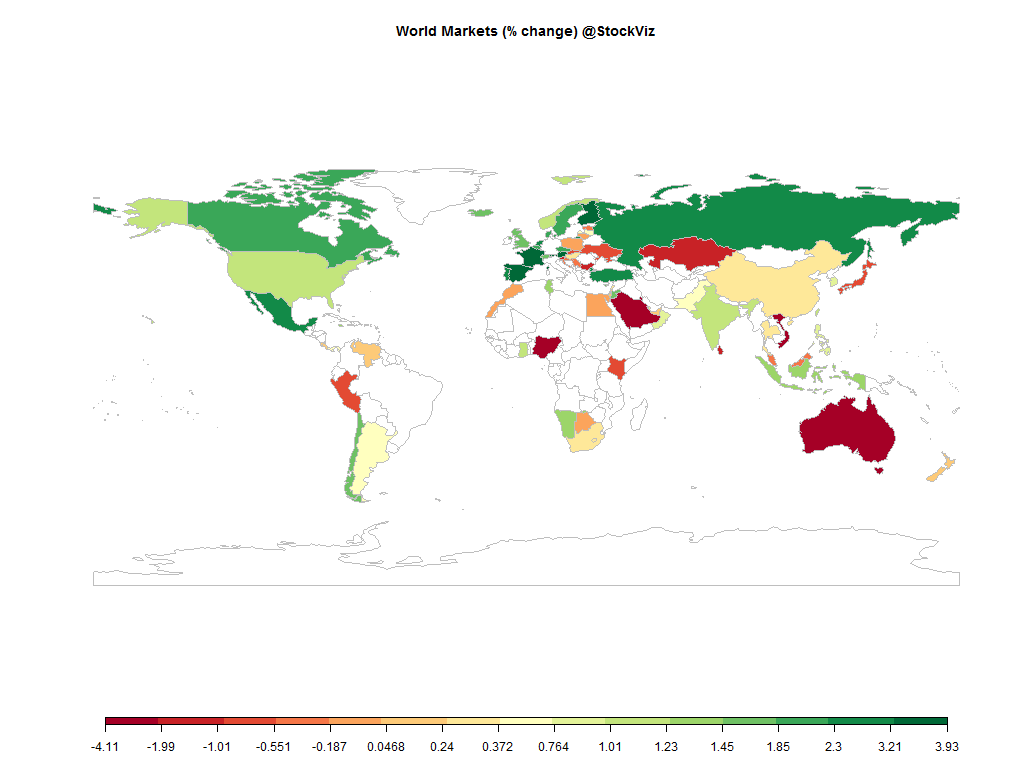
The SPX continued to make fresh highs but the best performing market was Brazil.
And, the dollar rally paused for the cause…
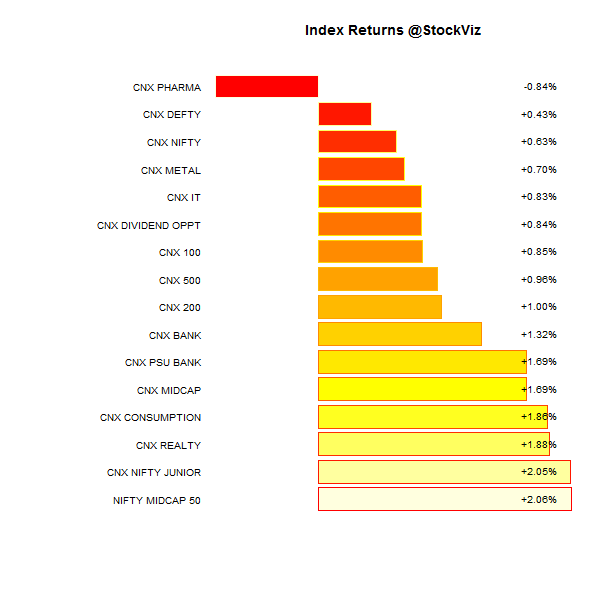
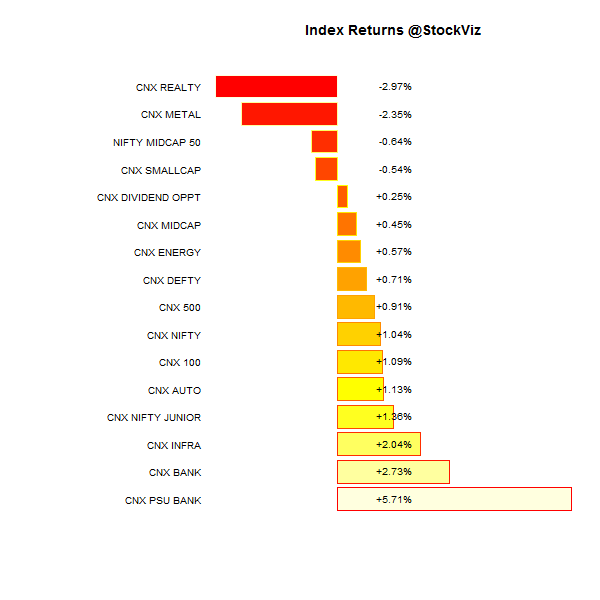
Index Returns
Market Cap Decile Performance
| Decile | Mkt. Cap. | Adv/Decl |
|---|---|---|
| 1 (micro) | -1.34% | 66/73 |
| 2 | -0.29% | 75/64 |
| 3 | -0.58% | 68/72 |
| 4 | -0.16% | 67/71 |
| 5 | -0.40% | 67/72 |
| 6 | +0.23% | 80/59 |
| 7 | +0.57% | 71/69 |
| 8 | +0.45% | 72/66 |
| 9 | +0.90% | 74/65 |
| 10 (mega) | +1.16% | 73/67 |
Top Winners and Losers
ETF Performance
| PSUBNKBEES | +5.99% |
| BANKBEES | +3.04% |
| INFRABEES | +1.80% |
| GOLDBEES | +1.70% |
| NIFTYBEES | +0.71% |
| JUNIORBEES | +0.64% |
| CPSEETF | -0.24% |
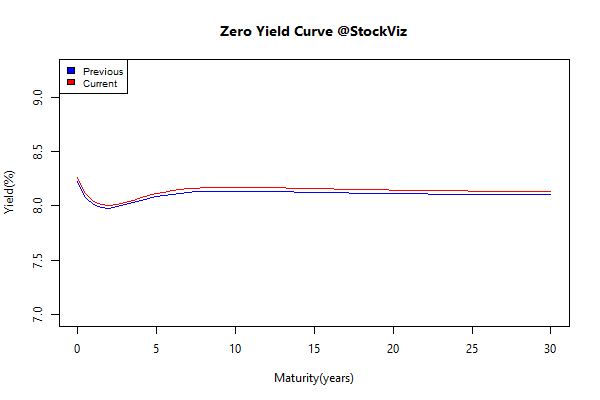
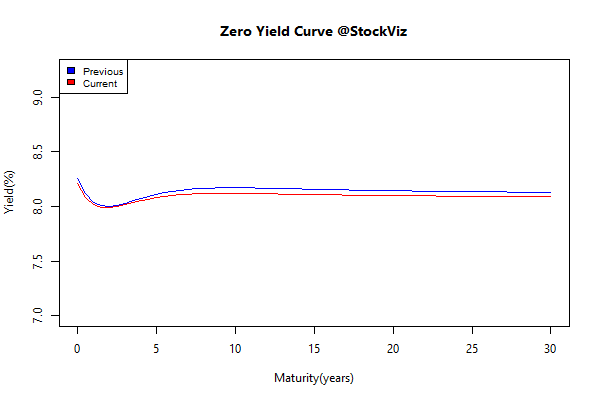
Yield Curve
Bond Indices
| Sub Index | Change in YTM | Total Return(%) |
|---|---|---|
| GSEC TB | -0.09 | +0.18% |
| GSEC SUB 1-3 | +0.04 | +0.26% |
| GSEC SUB 3-8 | +0.03 | +0.21% |
| GSEC SUB 8 | +0.01 | +0.19% |
Investment Theme Performance
| Growth with Moat | +5.57% |
| Auto | +4.89% |
| Market Elephants | +4.11% |
| ADAG Mania | +2.29% |
| Efficient Growth | +1.16% |
| IT 3rd Benchers | +1.14% |
| Magic Formula Investing | +0.97% |
| CNX 100 50-Day Tactical | +0.68% |
| Financial Strength Value | +0.67% |
| Balance-sheet Strength | +0.62% |
| Refract: PPFAS Long Term Value Fund | +0.41% |
| Momentum Long-Short | +0.00% |
| Piotroski ROC Small Caps | -0.15% |
| Enterprise Yield | -0.26% |
| Quality to Price | -0.44% |
| Industrial Value | -0.66% |
| Momentum 200 | -0.71% |
| Old Economy Value | -0.93% |
| The Other Value | -1.10% |
| Market Fliers | -1.60% |
Thought for the weekend
Emotions are life’s “beta”.
The concept that a stock moves with either more or less volatility than the market seems a neat analog for life. Sometimes you are the windshield, sometimes you’re the bug. We’ve all had beta 3 days, both for good or for bad. But no one except a finance person would try to quantify that with a number.
“How was your day, honey?”
Answer: “Oh, a gap up open when I got a new customer to trade with me, but a lousy close when the market went nuts after the Fed meeting. Definitely a beta 2 day. Hopefully tomorrow will be calmer.”
Source: Nick Colas: Ten Signs You’ve Been on Wall Street Too Long