Category: Your Money

Weekly Recap: Time is not money

nifty performance heatmap

The market opened October with a bang, rallying 3% (+5.3% in USD terms).

Index Performance

Pretty much everything except FMCG ended in green.

index performance

Top Winners and Losers

YESBANK +9.74%
SAIL +10.21%
BANKINDIA +10.48%
APOLLOHOSP -4.91%
HINDUNILVR -3.30%
NTPC -3.29%
SAIL away…

ETFs

BANKBEES +5.00%
PSUBNKBEES +2.83%
NIFTYBEES +2.61%
INFRABEES +2.52%
JUNIORBEES +1.12%
GOLDBEES -1.88%
Banks staged an impressive rally…

Advancers and Decliners

advancers and decliners

Yield Curve

The curve seems to be normalizing…

india yield curve chart

Interbank Rates

… and so are interbank lending rates.

mibor

Sector Performance

sector performance

Thought for the weekend

Thinking about time has the opposite effect on people from thinking about money. It makes them more honest than normal, rather than less so. Moreover, the more reflective they are, the more honest they become.

Source: Time is not money

Machine Learning Stocks

There are no “new new” things in finance, there are no “unique” opportunities and the stock that you labored so hard to pick is no “diamond in the rough.”

The perils of static classification

In the olden days, stocks were classified either based on the industry they operated in (i.e., sectors) or based on their market cap (i.e. cap-weighted indices.) But neither of them do justice to the underlying risk or technical behavior of the stocks themselves. Not all stocks in an index are similar, nor do they have a 100% overlap with other stocks within the same sector. Buy say you really liked a stock, like ACCELYA for example, but found its valuation unattractive, how do you go about finding a substitute?

Finding substitutes using clustering

This is where machine learning can help. Using clustering algorithms, stocks can be grouped based on parameters different from just industry or market-cap. What if stocks are grouped based on risk metrics (alpha, beta, Sharpe…) and technicals (RSI, ADX…)?

This was the question we set out to answer and we are now proud to present the results in the “Quant” tab in the equities page. Here’s how the Quant section looks like for Accelya:

ACCELYA Quantitative Analysis

It shows that Accelya, although a retail value favorite, is not alone when it comes to its risk profile and technicals. There are other fish in the sea that is worth a gander.

This might be a scary thought for most investors: their favorite stocks are not alone, and there might be cheaper substitutes to the stocks that they like.

Geek Note

  • All factors are equally weighted and normalized.
  • A lot depends on whether the underlying data is actually clustered or not. For example, if you only cluster based on risk metrics, then by definition, most stocks will cluster around Alpha=0 and Beta=1.
  • Risk metrics look back 365 calendar days whereas technical metrics look back over shorter time-frames.
  • In case you are wondering, there is no information content in observing “cluster migration.”

Related:
Alpha, Beta, Sharpe and Information Ratio
Risk Adjusted Returns

Monthly Recap: September 2013

Nifty monthly performance heatmap

The NIFTY ended the month up 4.82% (+11.16% in USD) on the back of improving sentiment regarding the economy and the US Fed’s continued QE program.

Index Performance

FMCG was the leader but commodities was not too far behind.

Index performance

Top Winners and Losers

ULTRACEMCO +22.68%
ASHOKLEY +26.25%
JSWSTEEL +34.76%
RANBAXY -19.01%
TCS -5.18%
SESAGOA -4.24%
The perfecta: Cement, Auto and Steel

ETFs

JUNIORBEES +8.00%
BANKBEES +7.33%
NIFTYBEES +5.71%
INFRABEES +0.61%
GOLDBEES -2.39%
PSUBNKBEES -6.51%
Better quality midcaps seem to have caught a bid…

Advancers and Decliners

advancers and decliners

Yield Curve

It was the month of the “surprise” rate hike…
Indian yield curve

Interbank Rates

The volatility in the interbank rates over the last month has been phenomenal…

india interbank rates

Sector Performance

sector performance

[stockquote]NEULANDLAB[/stockquote]

Weekly Recap: The fallacy of inept bad guys

Nifty performance

The Nifty ended the week -2.98% (-2.30% in USD terms.) Banks took much of the heat.

Index Performance

index performance

Top Winners and Losers

ZEEL +6.59%
ASHOKLEY +6.74%
APOLLOHOSP +9.39%
YESBANK -14.45%
DLF -12.97%
BANKINDIA -11.42%
Yesbank continued its roller-coaster ride…

ETFs

INFRABEES +2.50%
JUNIORBEES -0.08%
GOLDBEES -0.44%
NIFTYBEES -2.79%
PSUBNKBEES -5.90%
BANKBEES -6.64%
Is infrastructure finally turning the corner or is this a dead-cat bounce after tumbling last week?

Advancers and Decliners

advance decline ratio

Yield Curve

Long term rates ended higher – it looks like the market is pricing in 50bps rate hike?

yield curve

Interbank Rates

The rates that banks charge each other has come down over the last 30 days. Does it mean that the liquidity crunch is nearing an end?

interbank rates

Sector Performance

sector performance

Thought for the Weekend

It means assuming the opposition is a legitimate threat until they prove otherwise, rather than assuming that they’re incompetent. Most of all, it means abandoning the belief that we deserve to win, and instead believing we have to earn all of our victories the hard way.

Source: The fallacy of inept bad guys

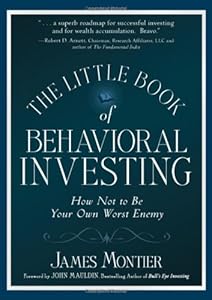
The Little Book of Behavioral Investing: Forecasting is a Sham

Prepare – Don’t Predict!

On encountering a teacher from hell and believe me, they’ve been some, I would console myself with the quote “Those who can’t do, teach.” But 6th century poet and philosopher, Lao Tzu’s quote in Chapter 5 of The Little Book of Behavioral Investing: How not to be your worst enemy wins the deal for me: “Those who have knowledge don’t predict. Those who predict don’t have knowledge.”

It appears that Lao Tzu had a premonition of coming times when common man would be inundated with predictions from financial soothsayers and projectionists. He guessed right that we’d need some hard-core wisdom to pull ourselves away from the damaging influence.

Cover of "The Little Book of Behavioral I...

Author James Montier ties the fatality of financial predictions to the over-confidence of economists and investment experts. If you remember, we discussed this aspect of investors in Chapter 4, along with a depressing succession of human flaws outlined in earlier chapters – procrastination, temporary paralysis, illusional control, and the empathy gap. Mercifully, Montier also provides a practicable solution that can save us.

But coming back to the folly of believing in forecasts: Did you know that the consensus of economists failed to predict any of the last four recessions, including the 2008 crash? In fact, the track record of economist predictions is abysmal in both short and long-term issues. Stocks that analysts profess will go up at an accelerated pace over a 5 year trajectory have tended to move at a snail’s tempo.

But why only forecasting, analysts also try setting the target price of securities even after overwhelming evidence of their colossal failure in this regard. For example, in 2000, target prices were 37% above the market price. Analysts predicted that the stocks would go up 24% in 2008. Instead they fell, that too by 40%. It reminds me of the time we bought our house in 2008. After waiting for years for property rates to stabilize or fall (hey, optimism is a default trait), we finally invested. And the very next month, prices fell.

As Keynes says, “We simply do not know.” And that is literally the only thing we know for sure about the future.

The failure of economists and analysts are well documented. Economic forecasters even missed recessions when they were already underway. And it is not just economists who are consistently wrong. Experts of all “soft” sciences are overconfident about their own predictive prowess. For instance, Nate Silver points out that if political scientists couldn’t predict the downfall of the Soviet Union – perhaps the most important event in the latter half of the twentieth century – then what exactly were they good for?

So now we know that economists are bad forecasters. Worse, unlike weathermen, they don’t even own up to it. So why is it that financial predictions are featured everywhere?

It’s a simple case of demand and supply. People want it, media provides it. Add to that our own indolence in going with “ready-to-eat” rather than cooking from scratch. Investors want actionable information to justify their buy or sell decisions so economists provide it in bulk. It’s easier for us to have them do our homework. The only problem with this approach is that when predictions fall flat, the economist slinks away mouthing a disclaimer while we are stuck with a red face, a loss or worse, a debt.

Don’t put yourself in this situation.

Montier points out another evil of forecasts – a trait called anchoring. Research shows that if given a number, we tend to stick with it. In an experiment, when people wrote a number, it stuck in their mind such that when asked to write another random number later, they didn’t go too far from the first. This happened even when participants were aware that the first and second numbers were isolated entities with no relation to each other.

This means that even if we read a forecast and don’t believe it, our mind subconsciously deviates to it in our mental processes. Solution? Stay clear of forecasts altogether.

But what then should we base our investment decisions on? Montier says – nothing but penetrating research and analysis. Instead of imagining future value, evaluate the current value of a business, its nature and intrinsic worth. He suggests a backtracking methodology: Take the current price and go back to assess growth. Compare the growth rate with that of other firms in the same timeframe. If the company is already at the limits of the growth patterns, reconsider your buy decision.

An alternative approach is offered by Bruce Greenwald at Columbia University but Montier’s sympathies lie with Howard Marks of Oaktree Capital who says: “You can’t predict, you can prepare.” Meaning that you need to know where you are even if you don’t know where you are going for sure. And to be sure of where you are, you need to do your homework yourself.


Monica Samuel is doing a chapter-wise review of the book: The Little Book of Behavioral Investing: How not to be your worst enemy by James Montier. You can follow the series by following this tag: tlbbinvesting or by subscribing to this rss feed: tlbbifeed