A simple moving average of an index is nothing but the average of closing prices of that index over a specified period of time. We did a quick backtest to see how an SMA based toggle between going long an index vs. cash performed.
Cumulative returns
NIFTY 50

NIFTY MIDCAP 100

NIFTY SMLCAP 100

Feasibility
The backtest, unsurprisingly, shows that shorter the SMA look-back period, better the performance. However, the boost in performance comes at the expense of higher number of trades. Lower look-backs are only viable now thanks to brokerages where you would pay zero for these trades (however, you still pay the securities transaction tax.) To see how this would shake out in the real world, have a look at how our Tactical Midcap 100 Theme has performed in the last ~2 years:
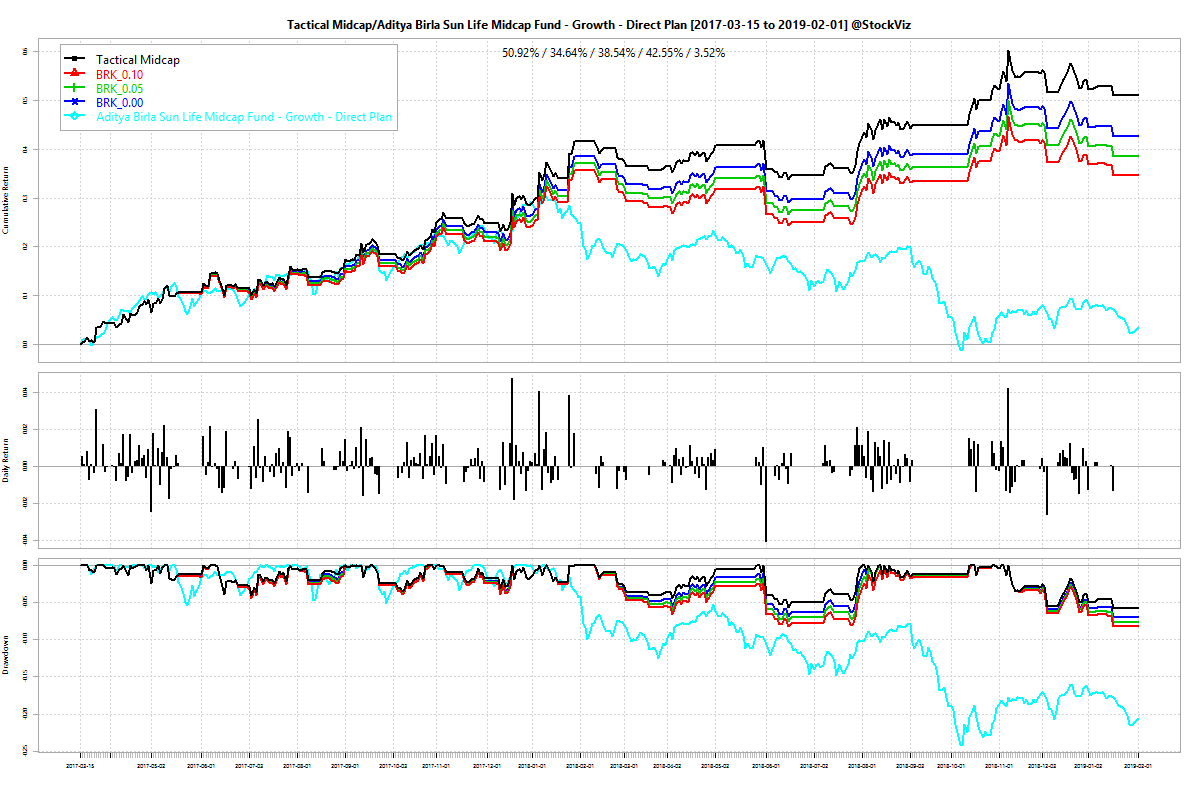
The Theme used the M100 ETF (Motilal Oswal Midcap 100 ETF) with a 10-day SMA toggle to switch between the ETF and LIQUIDBEES. The blue line represents zero brokerage and 0.1% STT and the green line represents a brokerage of 5p and 0.1% STT. The chart shows it beating an actively managed midcap fund across all transaction fee scenarios.
The snag is that this strategy is tough to scale. The M100 ETF just doesn’t trade enough for this strategy to absorb more than Rs. 10 lakhs. And there is no small cap ETF on the horizon to implement the strategy in that space.
The second problem is that M100 trades to a wide premium/discount to NAV (see: ETF Premium/Discount to NAV.) This is another layer of risk that an investor could do without.
However, things seem to be moving in the right direction. Reliance Capital launched a new ETF recently that tracks the NIFTY MIDCAP 150 index. Their ETFs usually trade better – tighter spreads, narrower tracking errors, better liquidity. Hopefully, it will emerge as a stronger alternative to M100 and allow these strategies to scale. We setup the Tactical Midcap 150 Theme that uses the RETFMID150 ETF instead of the M100 ETF for those who are interested.
In Part II, we will see how adding a simple check on the SMA can reduce drawdowns.
Code and charts are on github.