Equities
| MINTs | |
|---|---|
| JCI(IDN) | +2.30% |
| INMEX(MEX) | -2.01% |
| NGSEINDX(NGA) | -6.51% |
| XU030(TUR) | -4.51% |
| BRICS | |
|---|---|
| IBOV(BRA) | -1.23% |
| SHCOMP(CHN) | +2.18% |
| NIFTY(IND) | -1.37% |
| INDEXCF(RUS) | +3.58% |
| TOP40(ZAF) | -4.05% |
Commodities
| Energy | |
|---|---|
| RBOB Gasoline | -5.10% |
| Brent Crude Oil | -11.02% |
| Ethanol | -7.28% |
| Heating Oil | -9.08% |
| Natural Gas | -4.35% |
| WTI Crude Oil | -11.31% |
| Metals | |
|---|---|
| Silver 5000oz | -8.39% |
| Gold 100oz | -6.35% |
| Platinum | -14.84% |
| Palladium | -18.51% |
| Copper | -10.39% |
Currencies
| MINTs | |
|---|---|
| USDIDR(IDN) | +0.73% |
| USDMXN(MEX) | +0.06% |
| USDNGN(NGA) | -0.76% |
| USDTRY(TUR) | -0.98% |
| BRICS | |
|---|---|
| USDBRL(BRA) | +0.40% |
| USDCNY(CHN) | +1.29% |
| USDINR(IND) | +1.88% |
| USDRUB(RUS) | +4.88% |
| USDZAR(ZAF) | +4.55% |
| Agricultural | |
|---|---|
| Cocoa | +1.63% |
| Feeder Cattle | -14.79% |
| Lean Hogs | -1.22% |
| Orange Juice | +5.55% |
| Sugar #11 | +2.00% |
| Cattle | -6.61% |
| Cotton | -3.22% |
| Lumber | -3.23% |
| Soybean Meal | -5.11% |
| Wheat | -11.24% |
| White Sugar | +2.58% |
| Coffee (Arabica) | -3.65% |
| Corn | -3.66% |
| Coffee (Robusta) | -7.95% |
| Soybeans | +0.45% |
Credit Indices
| Index | Change |
|---|---|
| Markit CDX EM | +0.54% |
| Markit CDX NA HY | -0.97% |
| Markit CDX NA IG | +5.91% |
| Markit iTraxx Asia ex-Japan IG | -1.93% |
| Markit iTraxx Australia | +7.62% |
| Markit iTraxx Europe | -0.81% |
| Markit iTraxx Europe Crossover | -7.97% |
| Markit iTraxx Japan | +9.43% |
| Markit iTraxx SovX Western Europe | -0.27% |
| Markit LCDX (Loan CDS) | -0.04% |
| Markit MCDX (Municipal CDS) | -0.50% |
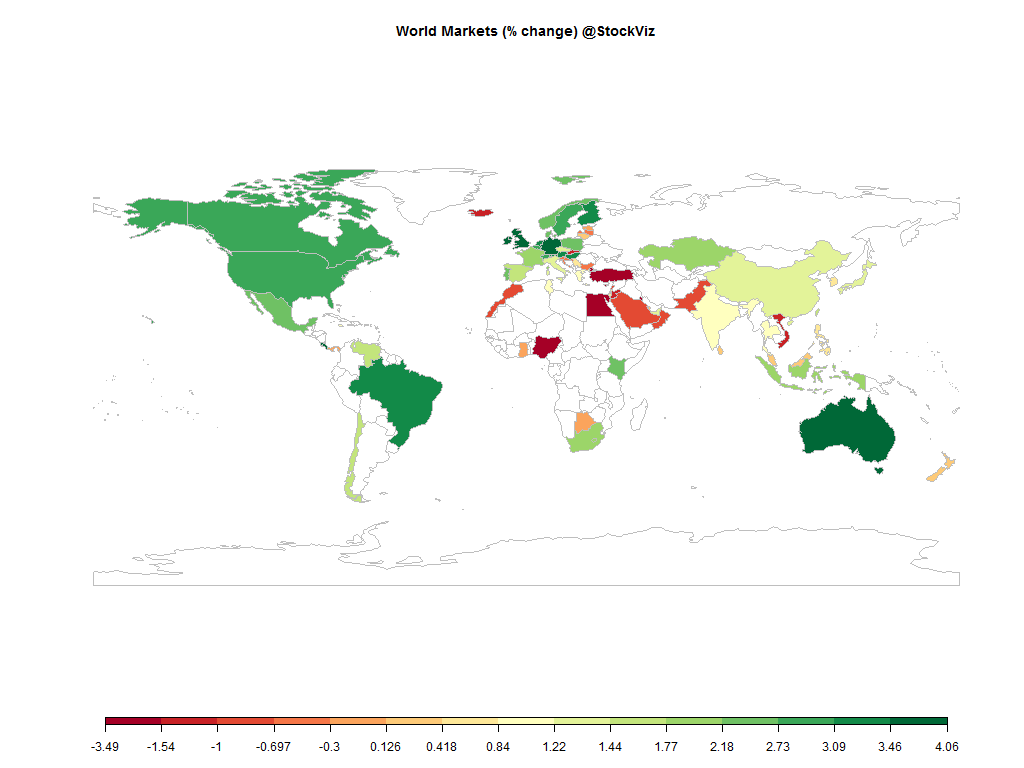
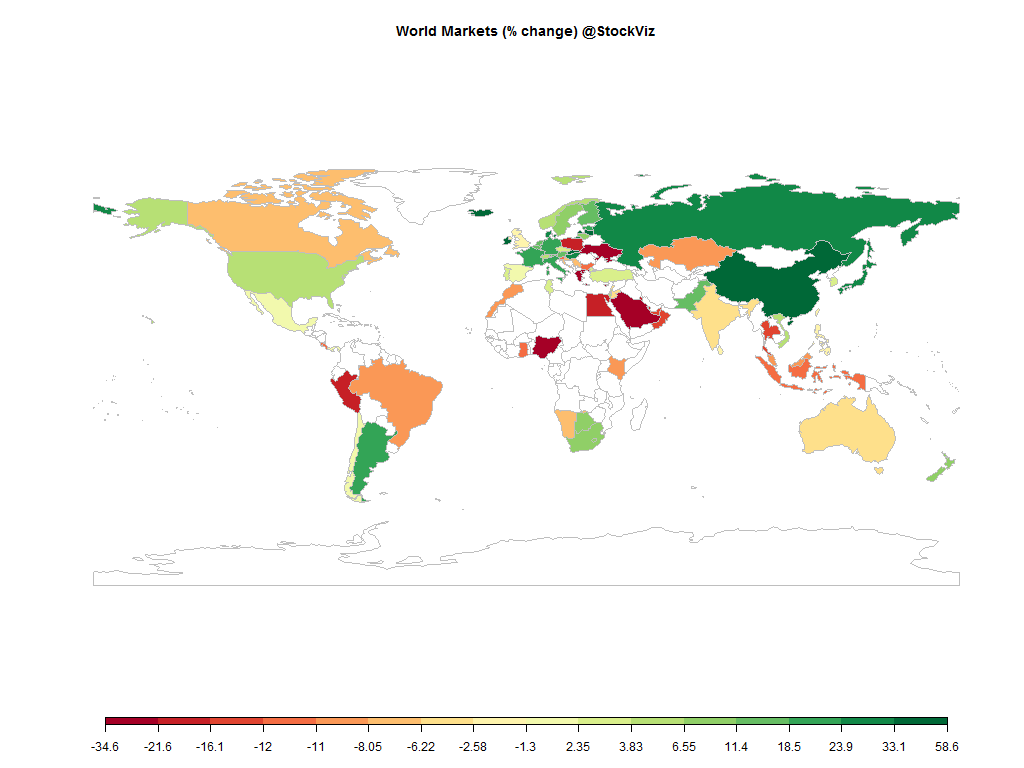
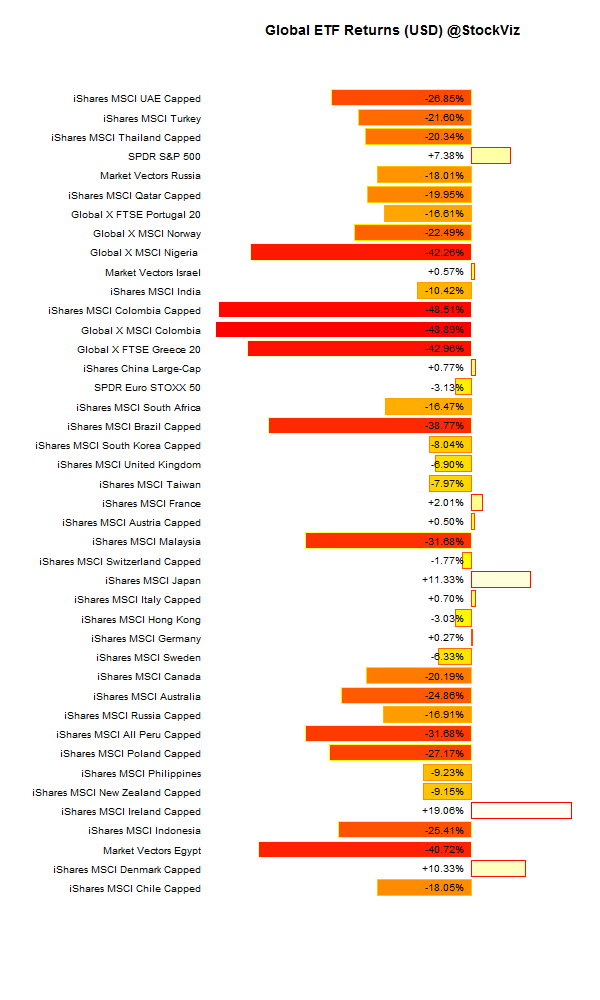
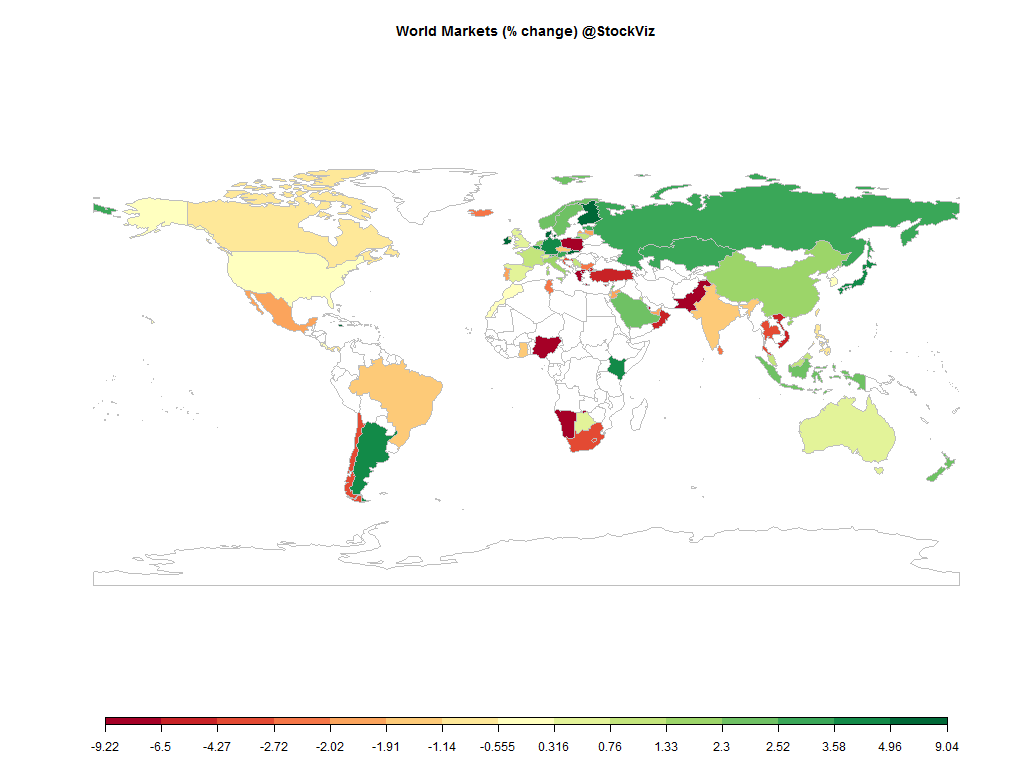
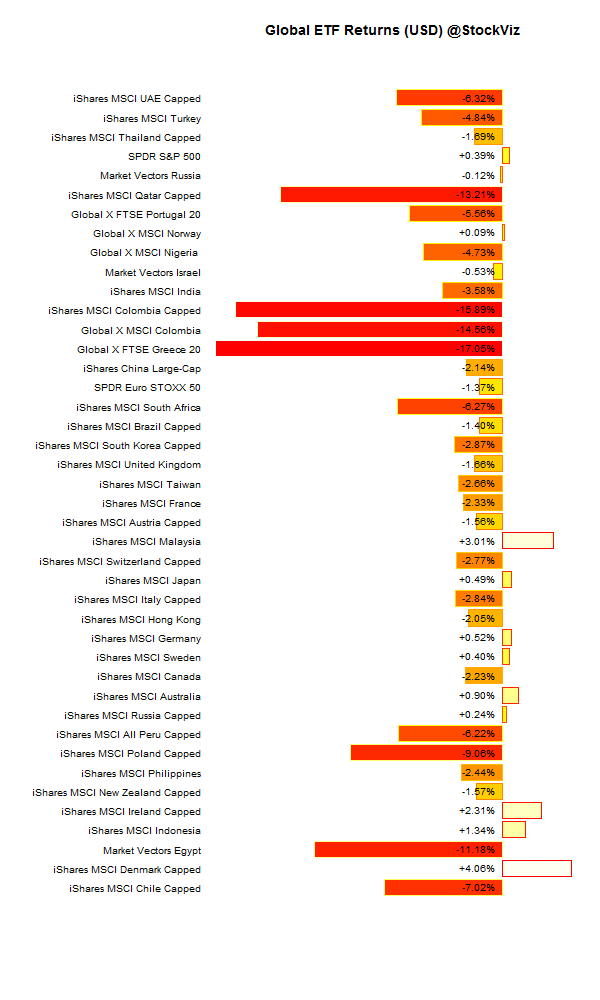
Most global indices ended the month in the red. The US Dollar rallied against most major currencies and the market seems to have come to terms with a December liftoff in US interest rates.
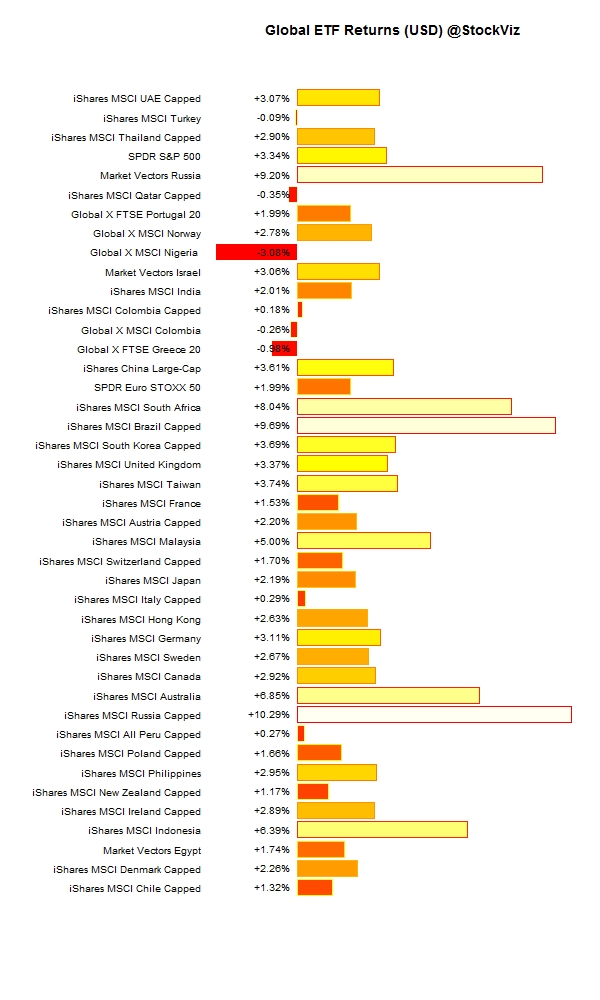
International ETFs (USD)
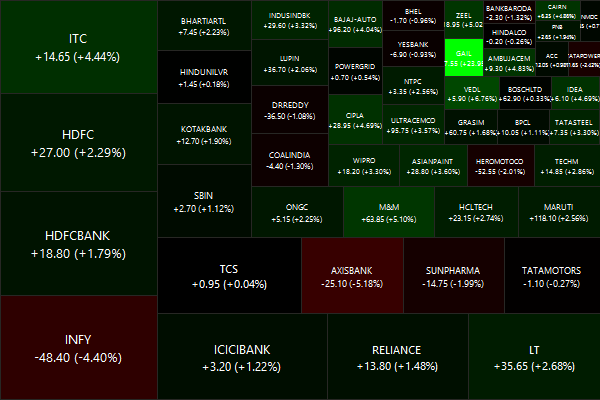
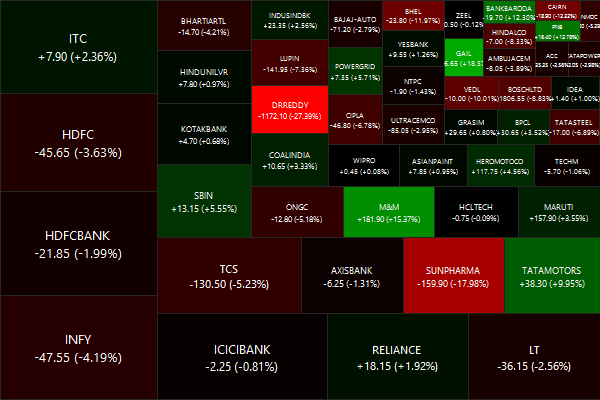
Nifty Heatmap
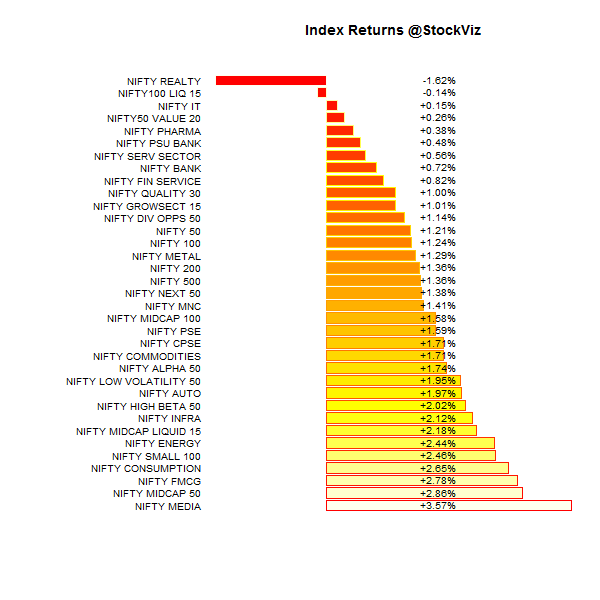
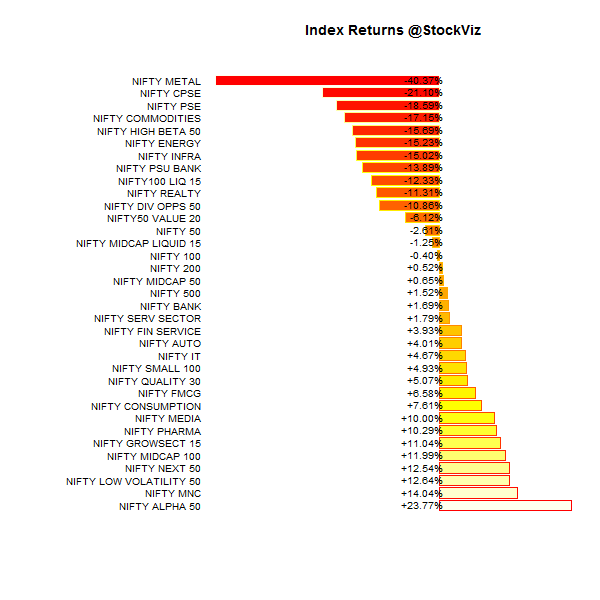
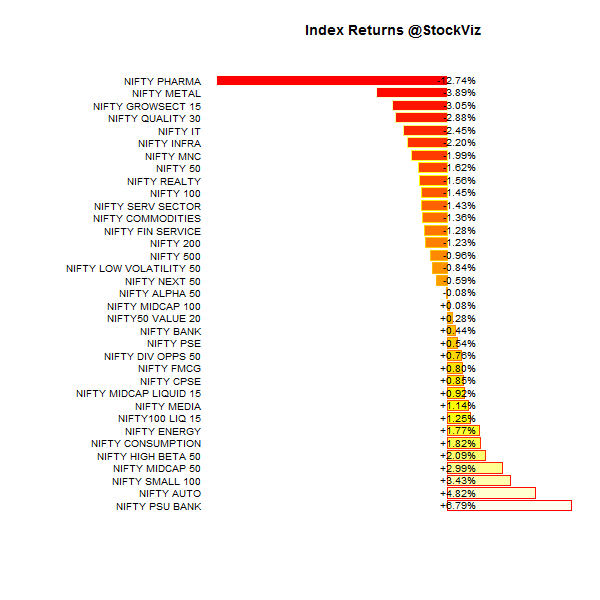
Index Returns
Market Cap Decile Performance
| Decile | Mkt. Cap. | Adv/Decl |
|---|---|---|
| 1 (micro) | +9.56% | 68/67 |
| 2 | +10.94% | 78/56 |
| 3 | +9.16% | 78/56 |
| 4 | +5.00% | 74/60 |
| 5 | +4.13% | 84/50 |
| 6 | +4.99% | 78/56 |
| 7 | +2.13% | 71/63 |
| 8 | +1.53% | 65/69 |
| 9 | +0.87% | 67/67 |
| 10 (mega) | -1.62% | 64/71 |
Large caps trailed mid and small caps…
Top Winners and Losers
Biggest moves where brought about by regulatory events…
ETF Performance
| PSUBNKBEES | +6.77% |
| CPSEETF | +1.19% |
| BANKBEES | +0.34% |
| JUNIORBEES | -0.22% |
| NIFTYBEES | -1.87% |
| INFRABEES | -2.50% |
| GOLDBEES | -6.07% |
PSU Banks: dead cat bounce or are government efforts finally turning things around?
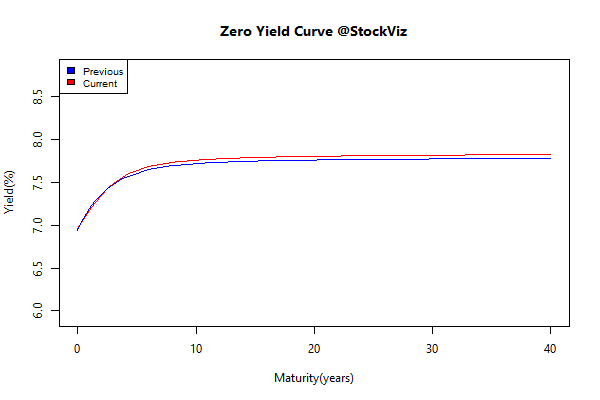
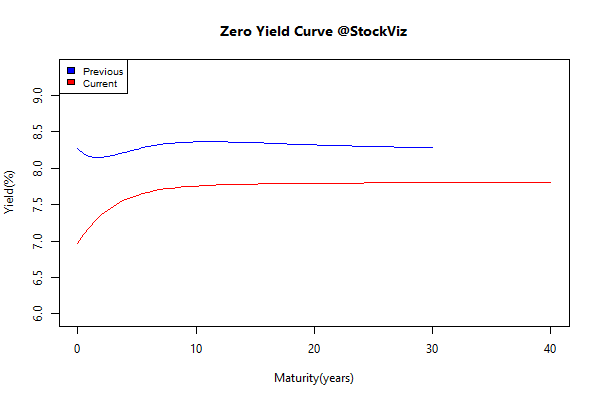
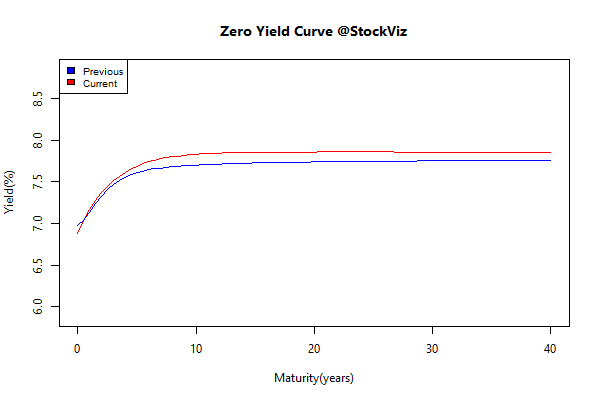
Yield Curve
Bond Indices
| Sub Index | Change in YTM | Total Return(%) |
|---|---|---|
| 0 5 | +0.08 | +0.38% |
| 5 10 | +0.13 | -0.07% |
| 10 15 | +0.13 | -0.28% |
| 15 20 | +0.15 | -0.83% |
| 20 30 | +0.13 | -0.72% |
Next rate cuts are probably six months away…
Investment Theme Performance
| Quality to Price | +16.23% |
| Momentum | +12.69% |
| Magic Formula | +10.72% |
| Velocity | +10.23% |
| The RBI Restricted List | +9.46% |
| ADAG stocks | +5.99% |
| Financial Strength Value | +2.97% |
| PPFAS Long Term Value | +2.69% |
| High Beta | +1.35% |
| Balance Sheet Strength | -0.91% |
| Enterprise Yield | -0.91% |
| Tactical CNX 100 | -2.00% |
| ASK Life | -3.82% |
| Next Trillion | -4.49% |
| Low Volatility | -6.96% |
Most investment strategies did well… November saw Quality to Price post over +250% and Momentum post over +200% gains since their inception in August 2013.
Equity Mutual Funds
| Best | |
|---|---|
| Sahara Star Value Fund-Growth Option | +8.92% |
| Escorts Tax Plan-Growth | +5.84% |
| Escorts Growth Plan-GROWTH OPTION | +5.73% |
| HDFC Core and Satellite Fund – GROWTH | +5.14% |
| HDFC Premier Multi-Cap Fund-Growth | +4.53% |
| Sundaram S.M.I.L.E.Fund-iNST Growth | +4.45% |
| Sundaram S.M.I.L.E.Fund-Growth | +4.40% |
Bond Mutual Funds
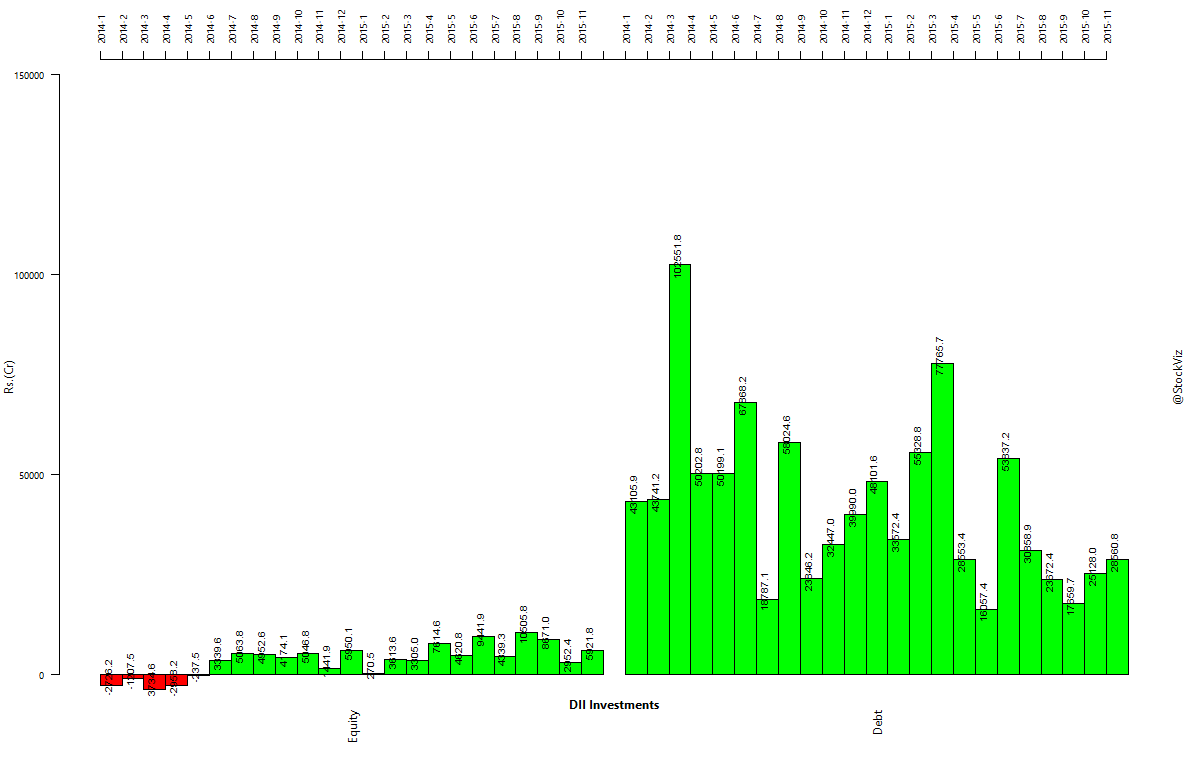
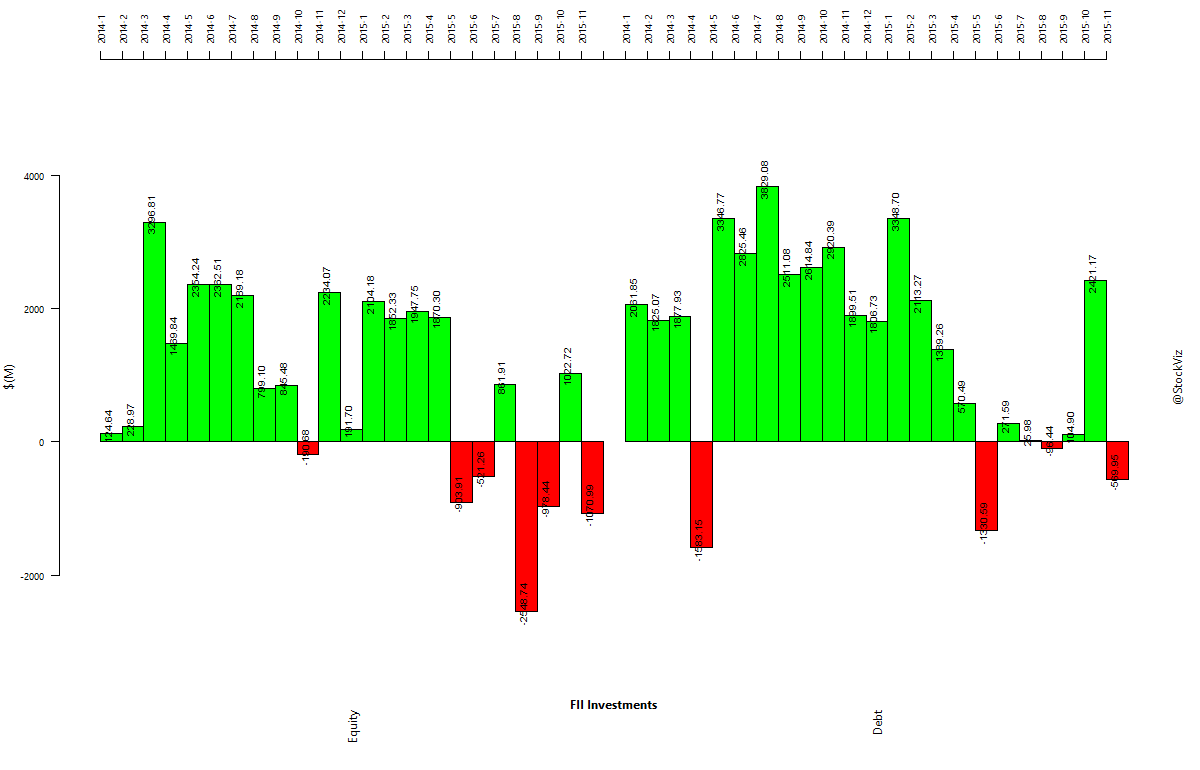
Institutional flows
FPIs sold off both bonds and equities…
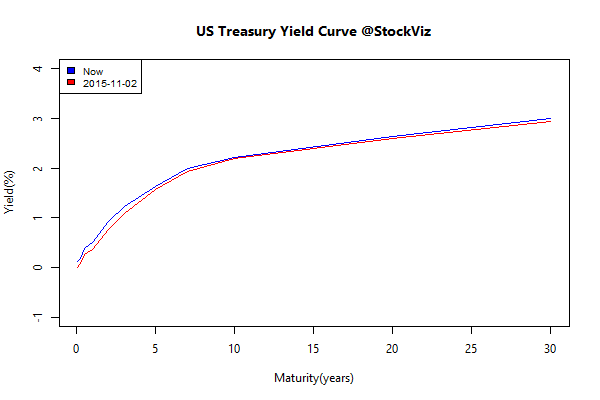
US Yield Curve
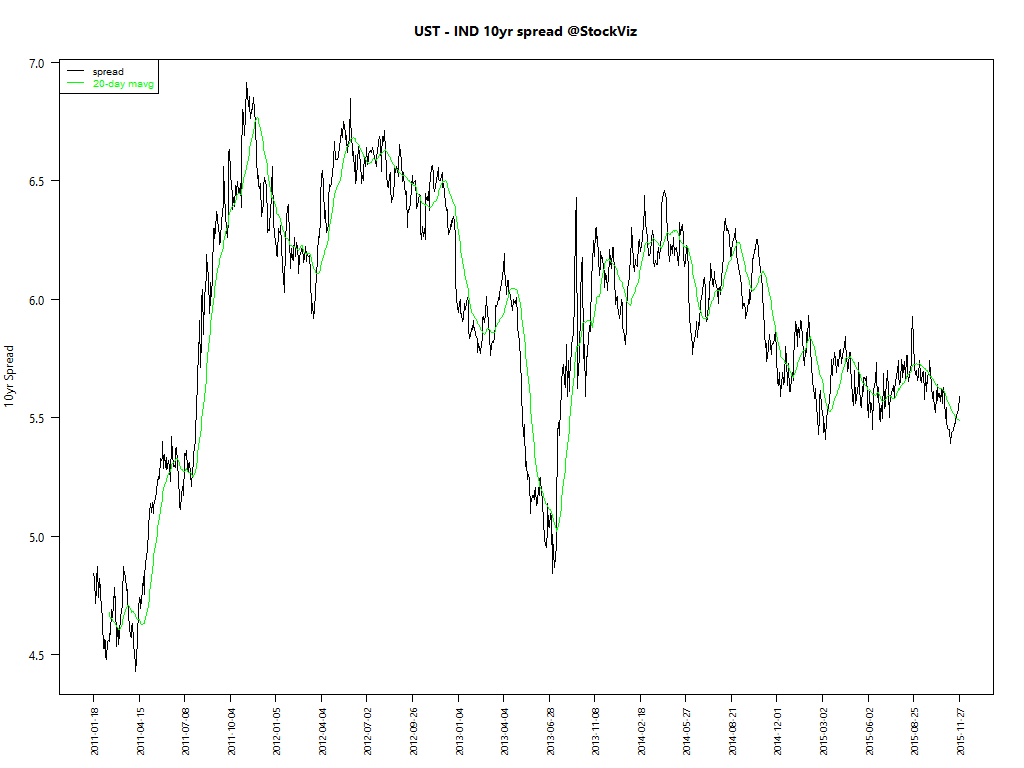
Spread between Indian and US long bonds