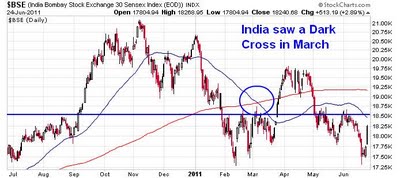
Bear are in control around the world.
Invest Without Emotions
Image via Wikipedia
I recently posted a link to an FT.com article that said that volume in the cash market has been dropping. I decided to do some digging myself to see how the trends are in the NSE.
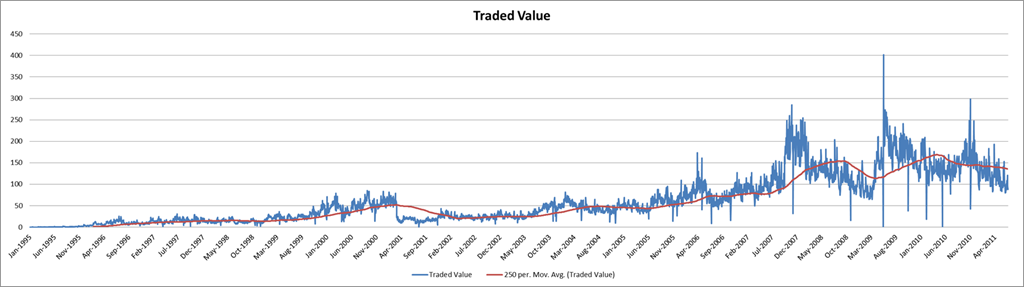
Turns out, there is some truth to it. If you look at the value traded since 1995, it does look its flat lined.
You see the crash of 2000 and the recovery in this chart:

However, post-2005, it looks like there’s been a very tepid bounce back in value traded (volume x price) and it has been dipping lately.
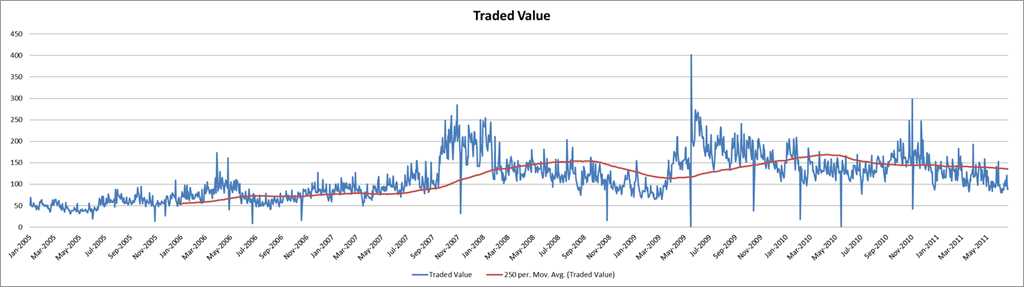
Doesn’t bode well for the capital markets in general if everybody wants to be a derivatives trader. Ask the CDO bankers at Merrill Lynch!
Source: StockViz @ Microsoft Azure

Lenders want time; bankers want capital; the agencies want calm; and investors just want out.
Why 2011 is much worse than 2008 Outside the Box – MarketWatch.

Image by roberthuffstutter via Flickr
The purpose of any business is, at the end of the day, to make money. It could be through providing a service, selling a product, acting as an intermediary or investing in other companies. All of these activities should lead to free cash-flow being generated. At some point, companies have to decide what to do with the excess cash.
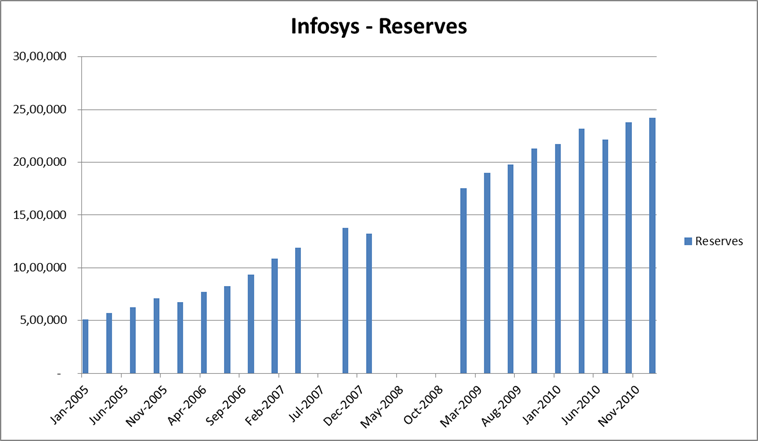
What should Infosys do with Rs. 2,42,14,00,00,000 ($5.38 Billion) in cash?
Infosys could try and grow bigger by acquiring smaller companies. However, IT services is a cashflow business; a bigger company will end up stock-piling more cash. For example OFSS (Oracle Financial Services) has more than $1B in cash.
Alternatively, it could buy or fund IT product companies. However, that would mean that Infosys knows more about running or funding IT product companies than the stock holder. Also, what if stock holders don’t want to invest in product companies at all?
Infosys could also buy back its stock. Companies that pay their employees in stock options typically need to buy back their stock to avoid dilution. Infosys’ cash hoard can buy back nearly 25% of its public float and investors benefit from the capital appreciation (higher stock price) that the move would entail. The capital appreciation would result in a tax event for the investor as well.
However, what would Infosys do with all the stock it now owns? It could use it as currency to acquire other companies (pay in equity rather than cash). Or it could start paying out stock options to its employees, etc.
Infosys could choose a third, more simpler alternative: distribute the cash as dividends. Dividends are perhaps the most straight-forward, investor friendly way to return cash to the stock holder. It allow the investor maximum flexibility in deciding what to do with the cash. And since dividends are actual checks that need to get sent out, it means that the accounting profits are actually real profits. In September, Infosys paid out Rs. 40 per share, that is close to $339 million to its public shareholders.
I personally prefer dividends to other forms of returning cash to the stock holder. Its simple, it doesn’t expect the management to work miracles trying to diversify and its cash in the pocket.

Feels like I’m hearing my echo: “The Indian market is narrow, shallow, illiquid and concentrated”.