Author: shyam

Weekly Recap

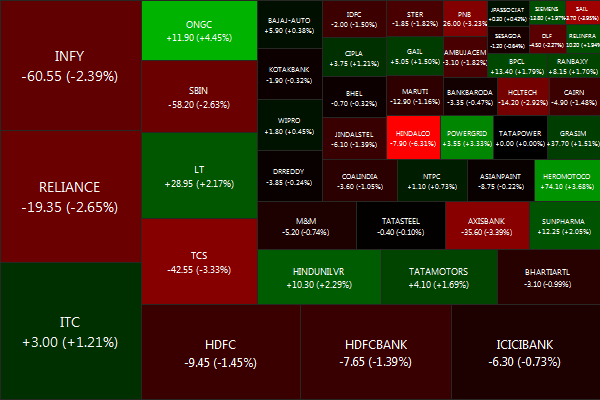
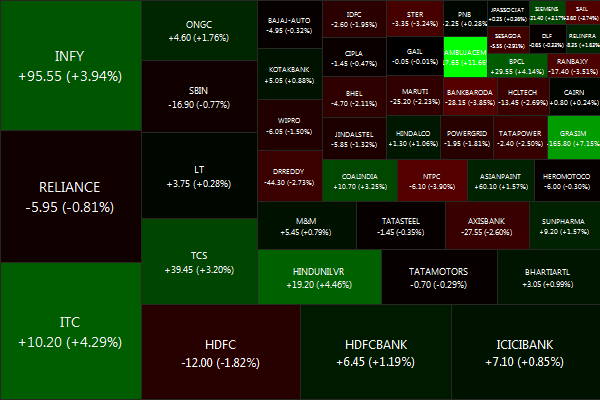
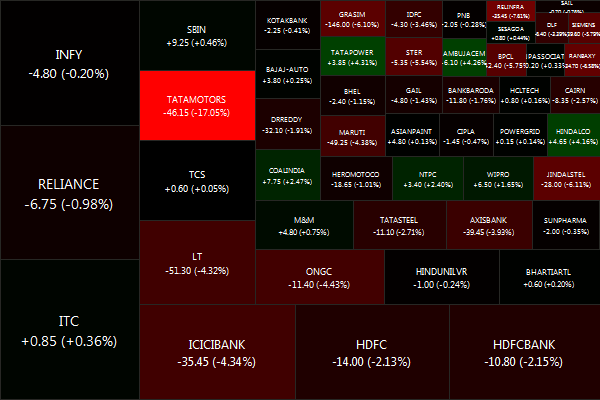
The NIFTY ended on a bearish note, melting down -1.60% for the week.
Biggest losers were DLF(-10.30%), M&M(-7.24%) and HEROMOTOCO(-6.97%). And the biggest winners were ACC(6.88%), AMBUJACEM(6.18%) and RELINFRA(5.38%)
Decliners eclipsed advancers 32 vs 18
Gold: -2.83%, Infrastructure: 0.90% and Banks: -0.18%
Daily news summaries are here.

The biggest news of the week was the Veritas report hammering DLF and the tepid response to ONGC’s divestment.

Veritas: DLF should be at half of where it is trading today

DLF [stockquote]DLF[/stockquote] got hammered following a report from Veritas Investment Research. Key highlights:

  1. Current valuation seems to be based on an a rosy scenario about its ability to de-leverage its balance sheet as well as to generate cash flows from its operation.
  2. They do not have the execution capability, and they are unable to keep their promises.
  3. DLF is finding it difficult to execute on converting the land it owns into cash flow generating assets. DLF should be in the business of generating revenues and developing land and not in the business of holding land and selling it.
  4. The company wanted to be one of the largest in hospitality business in India and wanted to have 4000 rooms in operation by 2010 or 2011 and now their entire hotel business is up for sale. They keep on changing their plans and continue to not deliver in the marketplace.
  5. DLF might have to hold on to these assets for a much longer time period than it is perhaps guiding the marketplace. And may need to restructure loans and dilute equity to get out of the hole it finds itself in, given that it has negative cash flows of Rs 936 crore just this year.

Read more: ET, DNA, Hindu, VCCircle

Alpha, Beta, Sharpe and Information Ratio

ten-year returns

Image via Wikipedia

StockViz now had alpha, beta, Sharpe and information ratio values available for individual stocks. The calculations are done daily using 1 year’s worth of historical data.

“Alpha” is a measure of a manager’s skill by measuring the portion of the managers returns that are not attributable to “Beta”, or the portion of performance attributable to a benchmark. This is how “better” a stock is relative to owning the index (Nifty 50) outright.

“Beta” is similar to correlation. By definition, the market itself has a beta of 1.0. A stock whose returns vary more than the market’s returns has a beta whose absolute value is greater than 1. A stock whose returns vary less than the market’s returns has a beta with an absolute value less than 1.

The “Sharpe” ratio tells us whether a portfolio’s returns are due to smart investment decisions or a result of excess risk. The greater a portfolio’s Sharpe ratio, the better its risk-adjusted performance has been. A negative Sharpe ratio indicates that a risk-less asset would perform better than the security being analyzed.

“Information Ratio” relates the degree to which an investment has beaten the benchmark to the consistency with which the investment has beaten the benchmark.

Read the returns series here.

Returns on Reliance

RIL Logo

Image via Wikipedia

We had discussed how risk and return are two sides of the same coin (read the series here). Also, we looked at the high price correlation of Reliance vs. the Nifty 50 index. The question yet to be answered is this: given a choice between owning Reliance and owning the NIFTYBEES ETF, what should an investor do?

Lets look at the pros of owning the NIFTYBEES:

  1. The NIFTYBEES represent the broader market. Investors get a diversified, market-weighted portfolio.
  2. 8.73% of the NIFTYBEES is, in fact, Reliance. So investors do get a slice of exposure to Reliance.

Now what would be the disadvantages of owning the NIFTYBEES vs. owning Reliance outright?

  1. If Reliance out-performs the index, then investors only get a small (8.73%) of the increase
  2. Investors may not want to buy the entire index and might prefer a concentrated portfolio of just resource stocks, of which Reliance is one.

To answer this question, lets turn our heads to two measures: alpha and beta (discussed here.) Reliance has an alpha of -0.0002946529 and a beta of 1.027928. What this shows is that Reliance actually underperformed the index (a –ve alpha) and it more or less tracked the index (a beta close to 1; confirmed by our correlation study.)

We are in the process of rolling out alpha and beta of individual stocks against the Nifty 50 index. Stay tuned!