Author: shyam

Understanding Volatility – Part I

technical analysis chart

Volatility is probably the most widely used but poorly understood concept in finance. When people talk about volatility, they are usually referring to historical volatility. Historical volatility is quite simply, a measure for variation of price over time.

If you look at the chart on the left, you can immediately tell that the stock is highly volatile. The daily candlesticks are long and you see prices break through Bollinger Bands frequently. For an investor, volatility can be, at times, gut wrenching. You might see your stops taken out the day the stock closes up 10%.

Investors in blue-chips might think that they are immune to volatility. That maybe true in bull markets, but in the side-ways/bear that we are in right now, volatility affects everybody.

image

image

By definition, the annualized volatility σ is the standard deviation of the instrument’s yearly logarithmic returns. The math behind calculating volatility gets trickier while adjusting for:

  1. Gaps: if you only use closing prices (close-to-close volatility), then you are not accounting for gap-up and gap-down opens – i.e., stocks don’t necessarily open where they closed the previous day.
  2. Dividend ex-dates: if the stock is paying out significant dividends, when it goes “ex”, your vol will be wrong

What does high volatility have to say about returns? Absolutely nothing. Volatility does not measure the direction of price changes, merely their dispersion. Also, a stock that has a volatility of 1% does not move 1% a day on average. (Taleb)

Side note: At StockViz, we use the Yang and Zhang volatility for stocks and close-to-close estimator for indices.

A sudden spike in volatility can spark a renewed interest in the scrip for speculators and is often used by momentum-chasing strategies to screen for stocks. For example, CMC, SUNDARMFIN, BLUESTARCO and MONSANTO are showing volatilities above their historical averages. Volatilities also spike around earnings seasons, something that option traders take advantage of (more on that later.)

Historical volatilities are important while considering investment/trading decisions. It affects where you put your stops and your time horizon. Higher volatility in long term investments result in a wider distribution of possible final portfolio values, so if you are looking to invest for your retirement, stay away from highly volatile stocks.

Remember: Higher volatility implies higher Risk, and may not come with higher Reward.

IPOs – Are they Worth It?

Warren Buffett had this to say about IPOs: “It’s almost a mathematical impossibility to imagine that, out of the thousands of things for sale on a given day, the most attractively priced is the one being sold by a knowledgeable seller (company insiders) to a less-knowledgeable buyer(investors).”

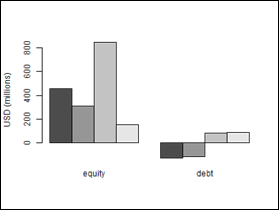
How have Indian IPO investors fared lately? To answer this question, StockViz analyzed over 250 IPOs since 2010 and compared them to returns that an investor would get if he had bought the Nifty [stockquote]NIFTYBEES[/stockquote] or the Junior Nifty [stockquote]JUNIORBEES[/stockquote] ETFs instead. The headline: over 200 trading days, IPOs on an average tanked -20% while the ETFs were -0.1% and -4.5% over the same period. Obviously, performance varies depending on the scrip and IPOs, as a group, tend to exhibit volatile returns (a standard deviation, σ , of 0.66 vs. Nifty’s 0.12 for 200 day returns.) So much for “buy-and-hold.”

image

How did the “flippers” fare? The 5 and 10-day returns are not that much better either: +0.5% and –1.7% on an average, with the Nifty faring better in both the cases.

image

image

So why buy IPOs at all? If you look at the histograms, there are about 20-30 stocks that gave more than 30% returns. For example, Peria Karamalai [stockquote]PERIATEA[/stockquote] 200-day return is at 300%. Anecdotes about “friends-of-friends” making a killing in IPOs is a powerful motivation indeed.

Is there a way to play IPOs while managing downside risks at the same time? Turns out there is. If it’s a dog stock, you’ll know it before 5 days. Stocks that doubled 20-days from the day of listing exhibited an average return of 65% within the first 5 days. Stocks that doubled 50-days from the day of listing exhibited an average return of 50% within the first 5 days. The rule of thumb is: If it doesn’t pop within the first 5 days, chances are that it never will.

Follow the StockViz 5-day rule for IPOs and add that extra juice to your portfolio!

You can follow IPO related news by using your ipo smart tag: http://stockviz.biz/index.php/tag/ipo/
The spreadsheet analysis for this article is available on scribd.


What Is Your Strategy?

StockViz proudly presents StockViz Strategies – an integrated experience to inspect, trade and manage stock option strategies like condors, butterflies and spreads.

image

image

Select from a wide array of built-in option strategies, inspect P&L profiles, option greeks and market liquidity.

image


image

Get a snapshot of how your portfolio is performing, mark-to-market gains, realized profit/loss aggregated across your trades. And when you are ready to exit a trade, a single click will do it!

image

image

So, what is your strategy?

Weekly Recap: What Recovery?

NIFTY 50.2012-07-02.2012-07-06

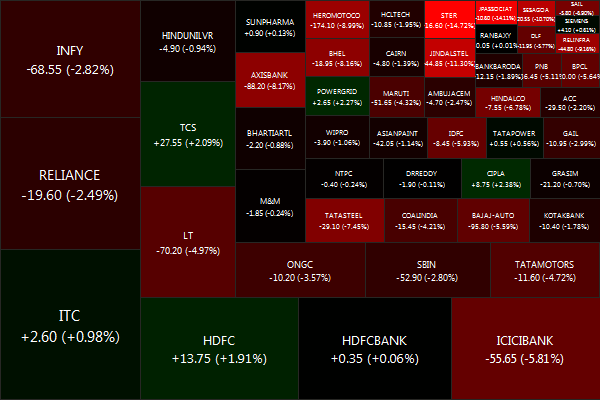
The NIFTY ended tepid, moving just -0.01% for the week.
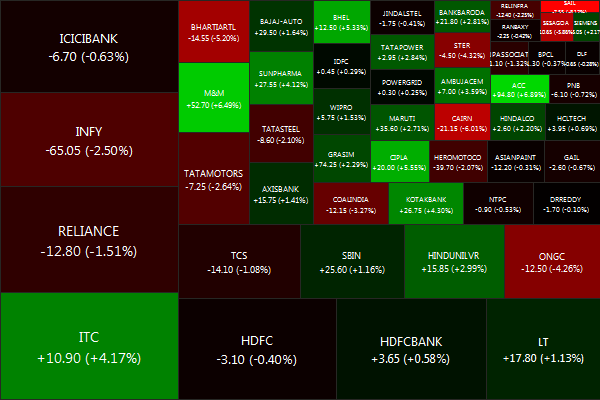
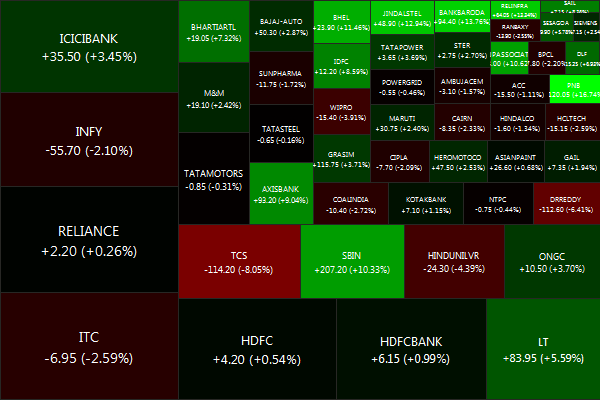
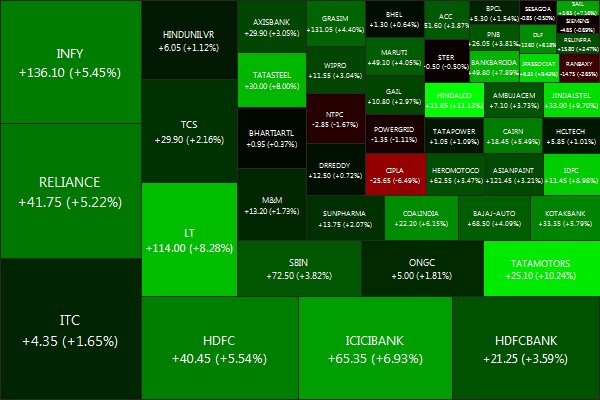
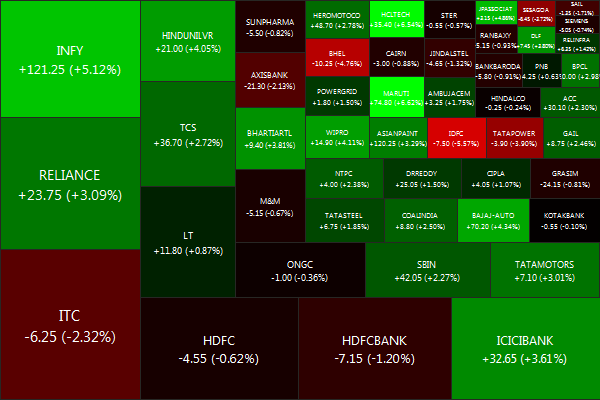
Biggest losers were ASIANPAINT (-4.48%), JINDALSTEL (-3.14%) and HEROMOTOCO (-3.13%). And the biggest winners were DLF (+6.45%), BHARTIARTL (+5.33%) and JPASSOCIAT (+5.17%).
Advancers lead decliners 29 vs 19
Gold: +0.35%, Banks: +3.37%. Infrastructure: +1.05%

Friday saw a big miss in US unemployment numbers. The Dow ended -0.93% to 12777, after being down more than 1.38%. Gold -1.66% to $1582.70, in spite of late-day QE3 chatter. Europe gave up most of its intra-week gains: Stoxx 50 -2.3%, Germany -1.9%, France -1.9%, Italy -2.3%, Spain -3.2%, U.K. -0.5%. The Euro flirted with 2012 lows.

Unless there’s some strong reform measures coming out of the government next week, expect the markets to fade: corporate earnings are likely to be week, any growth in IT earnings are likely to be on account of the week Rupee and domestic growth will continue to be stagflationary.

Should we get ready for a post-capitalistic West?

“The domination of capitalism globally depends today on the existence of a Chinese Communist party that gives de-localised capitalist enterprises cheap labour to lower prices and deprive workers of the rights of self-organisation,” says Jacques Rancière, Professor of Philosophy at the University of Paris VIII.

Daily news summaries are here.