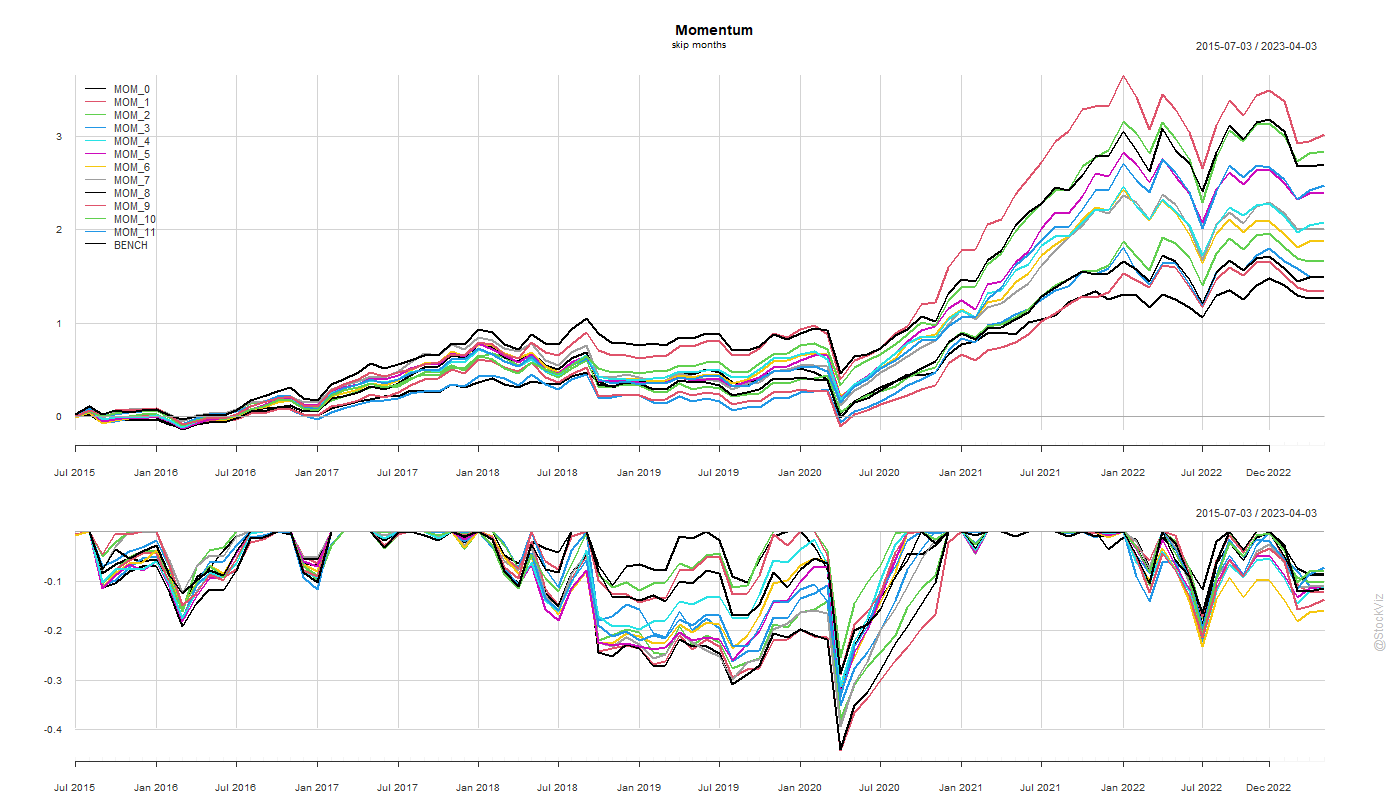
The original Jegadeesh and Titman momentum paper (pdf) used a “skip month” to manage the reversal effect (quant.stackexchange). However, why is it one month and not two, or three or four?
Here’s what the equity curves of different skip month configs look like.
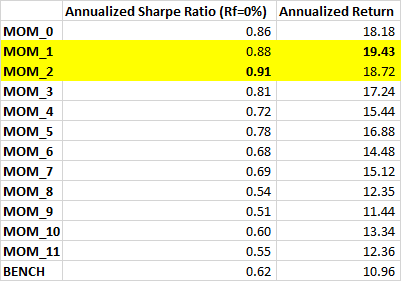
The “skip one month” is indeed a magical config. Also, if you are optimizing for Sharpe, skip two.
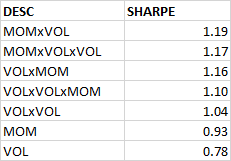
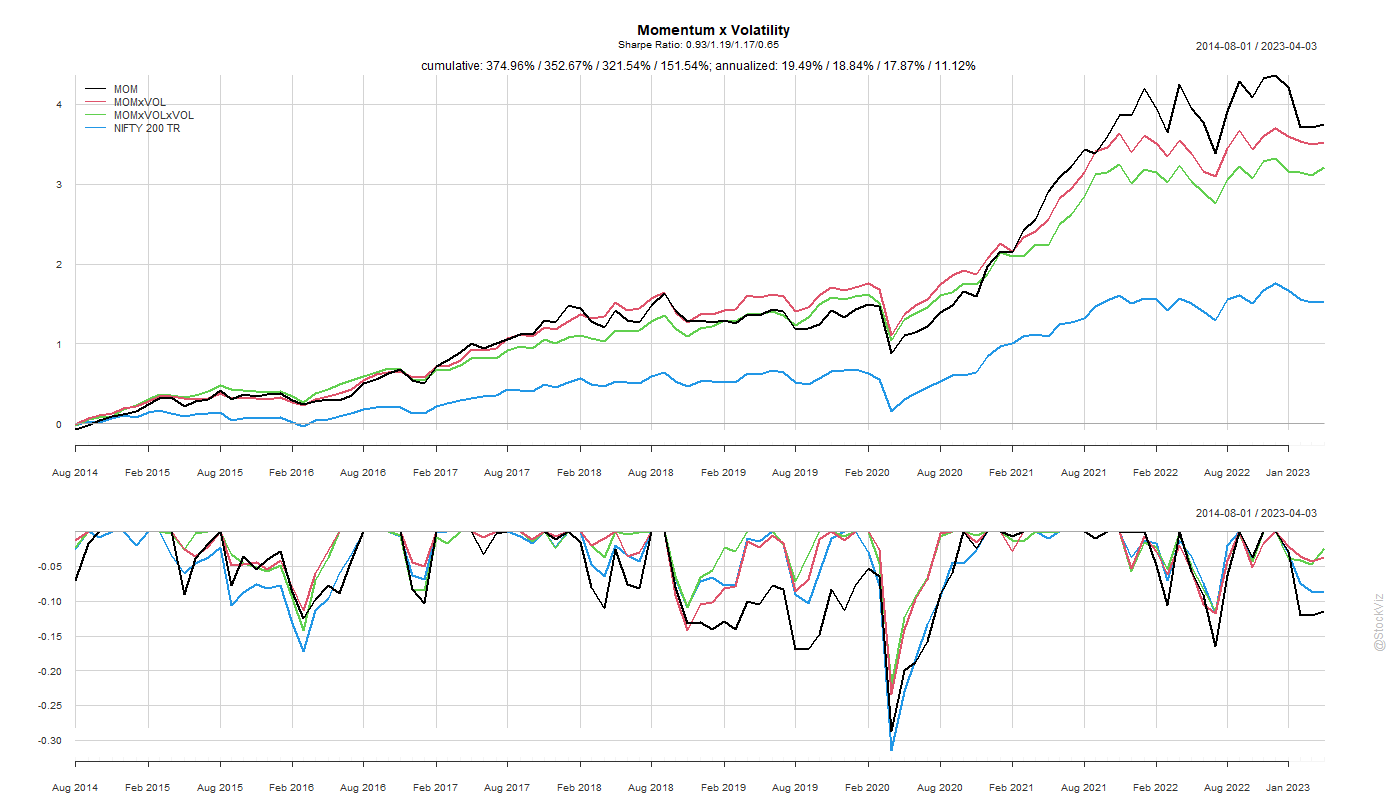
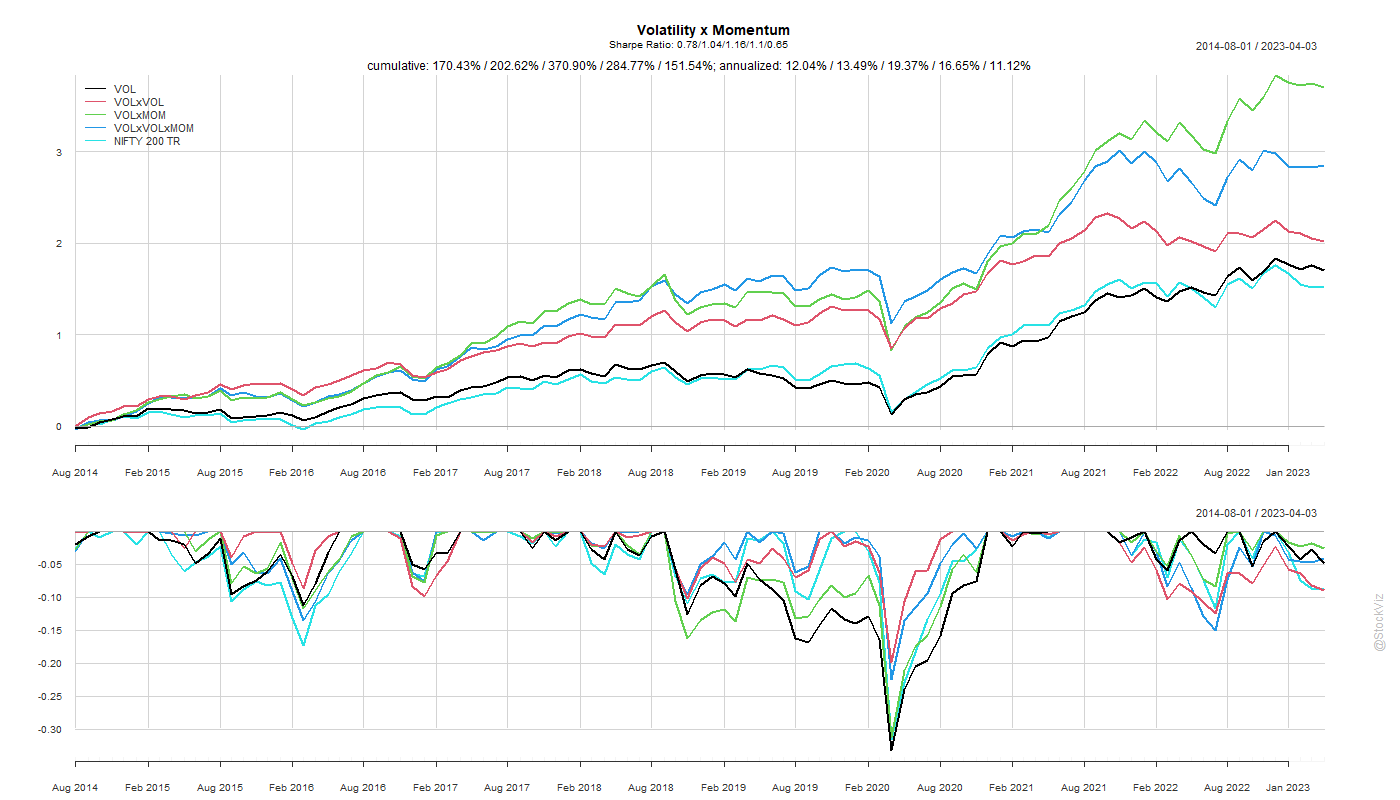
Momentum has proved to be the premier anomaly in different markets. And so has low-volatility. What happens if you combine both of them? Also, what if you also add low volatility of volatility into the mix?
There are a couple of ways to skin this cat. You can start with low-volatility and add momentum. Or, you could go the other way – start with momentum and then add a volatility sort.
tl;dr: go with low-volatility first, momentum second (VOLxMOM).
While a simple momentum sort gives the highest return, adding a low-volatility filter to it gets you a better risk-adjusted return.
The order of the sort – first volatility and then momentum or first momentum and then volatility – doesn’t seem to matter much for the Sharpe rankings but the former ended up with slightly better returns.
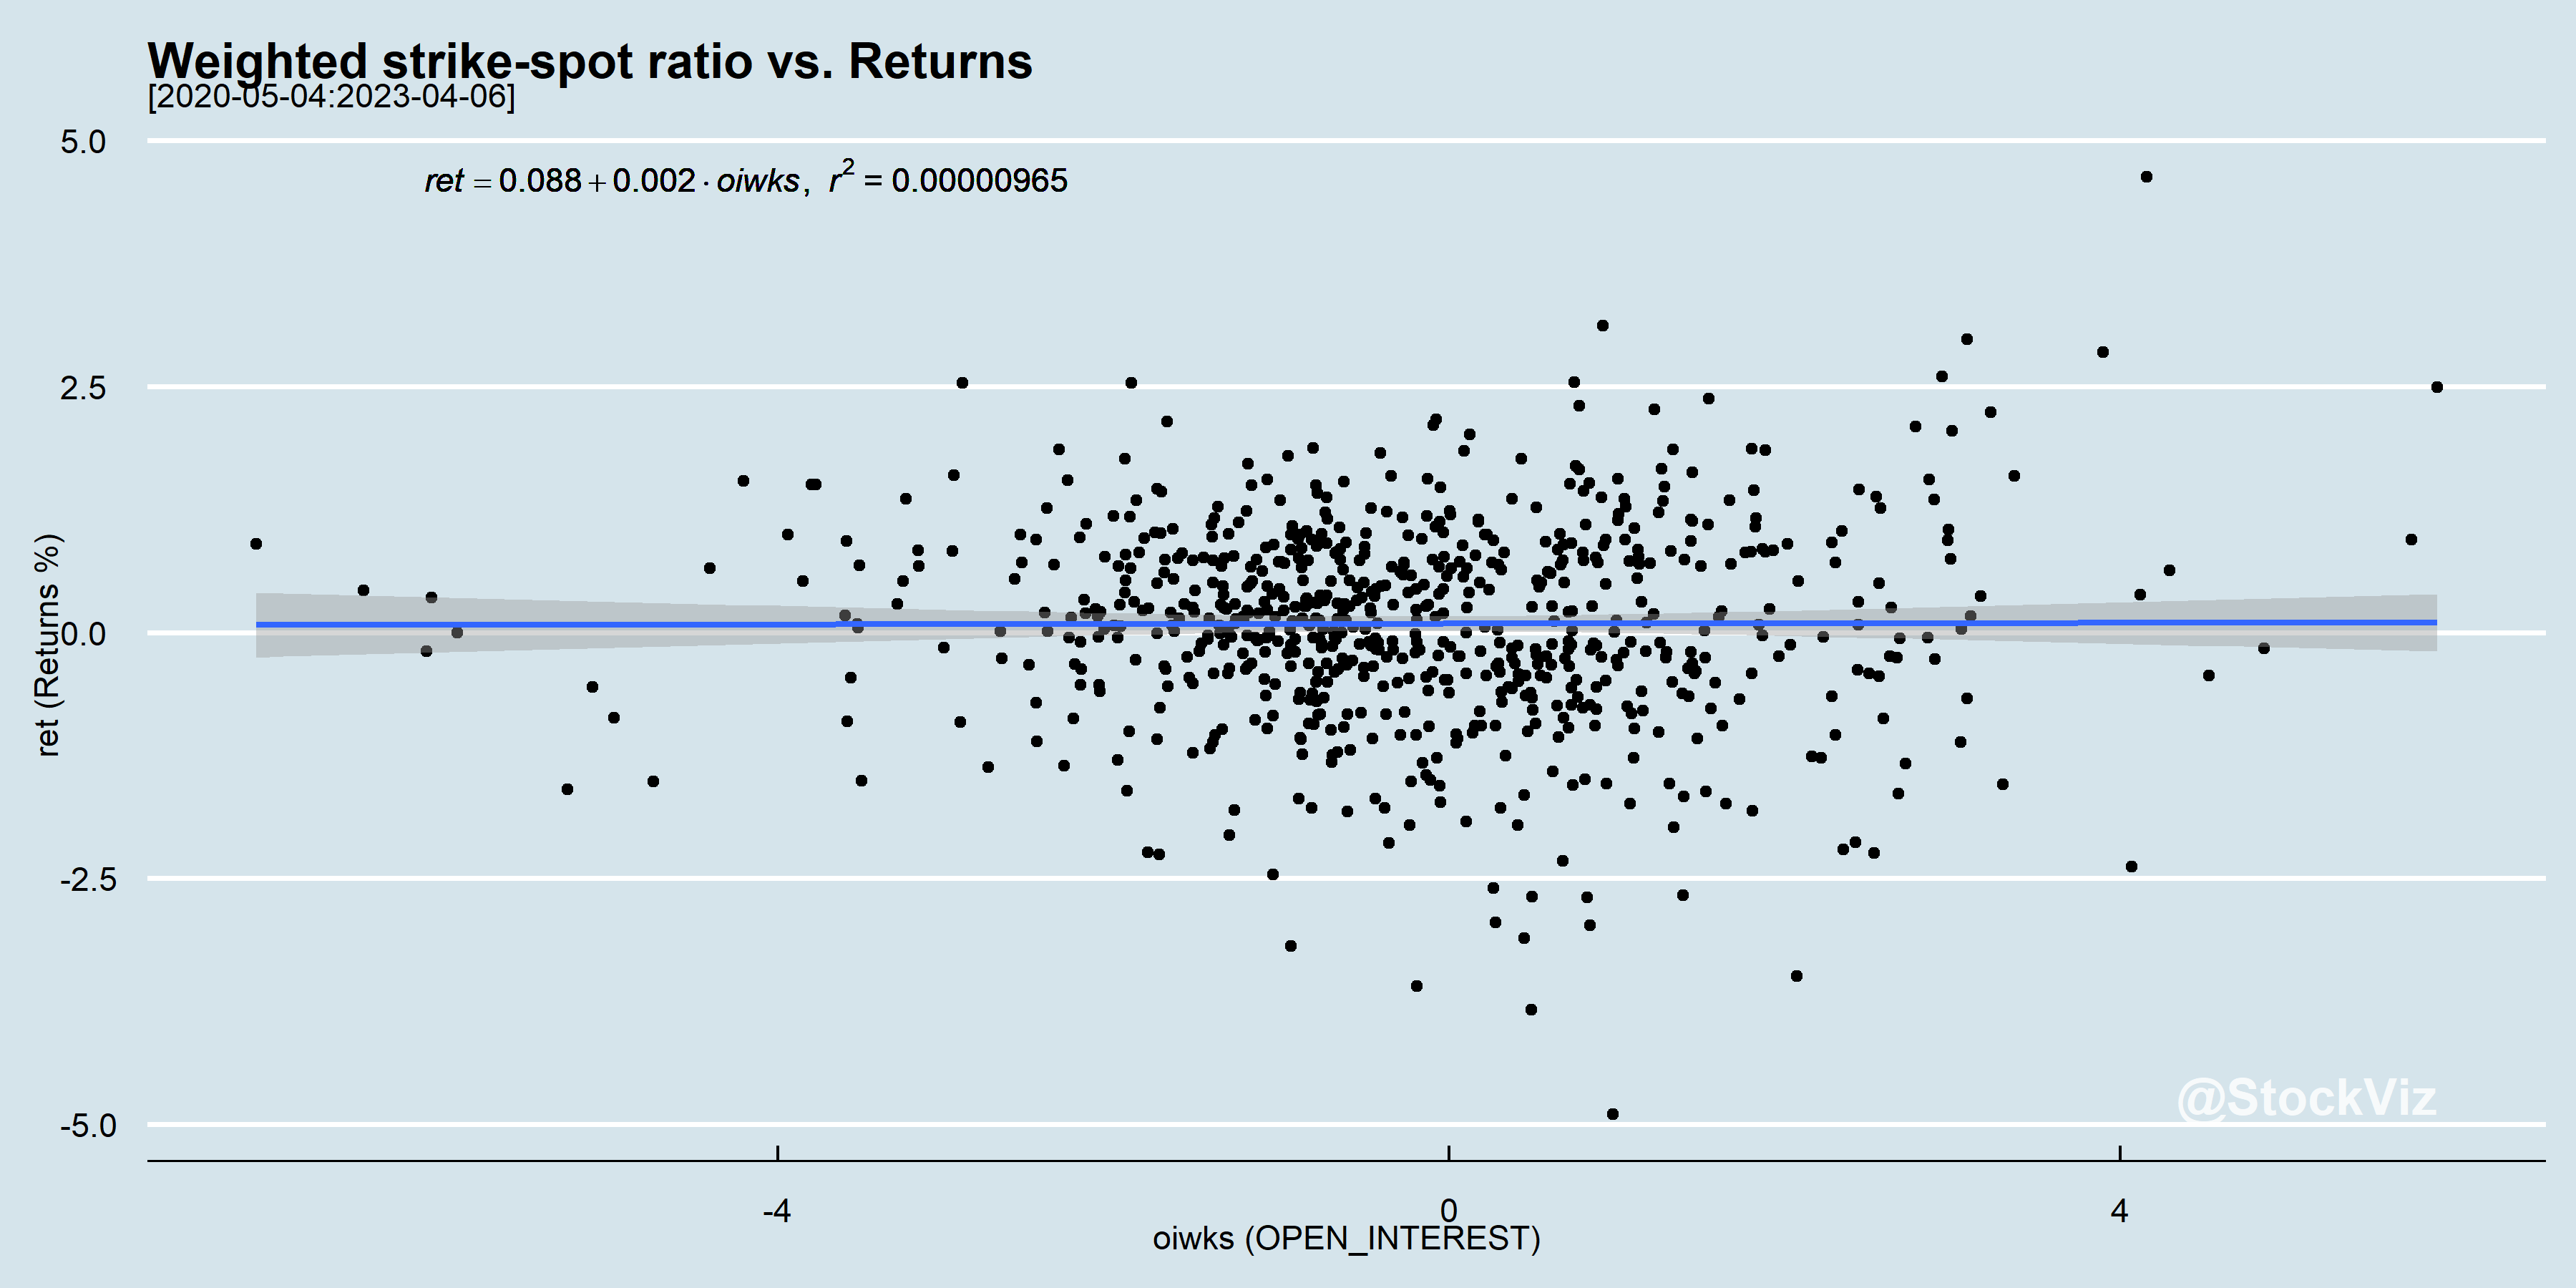
Can options trading predict the underlying’s returns? Center of Volume Mass: Does Options Trading Predict Stock Returns? Bernile, Gao, Hu (SSRN) tries to answer the age-old question.
They construct an options volume weighted strike-spot ratio and use that the predict the underlying’s next-day returns.
We rely on the volume-weighted strike-spot ratio to characterize the central location of the distribution of trading activity along the moneyness of available option contracts on the same stock. The ratio of the contract’s strike price (K) and the underlying stock price (S) measures the option moneyness, whereby call (put) options are out-of-the-money when K/S is above (below) one. After normalizing K/S by subtracting one, we calculate the weighted average of the normalized K/S ratio across available contracts using as weights the number of lots traded on each contract during the same period (V WKS, hereafter). V WKS reflects the center of mass in the options volume distribution along strike prices of available contracts and takes on higher (lower) values when the trading volume is tilted more toward OTM (ITM) calls and ITM (OTM) puts.
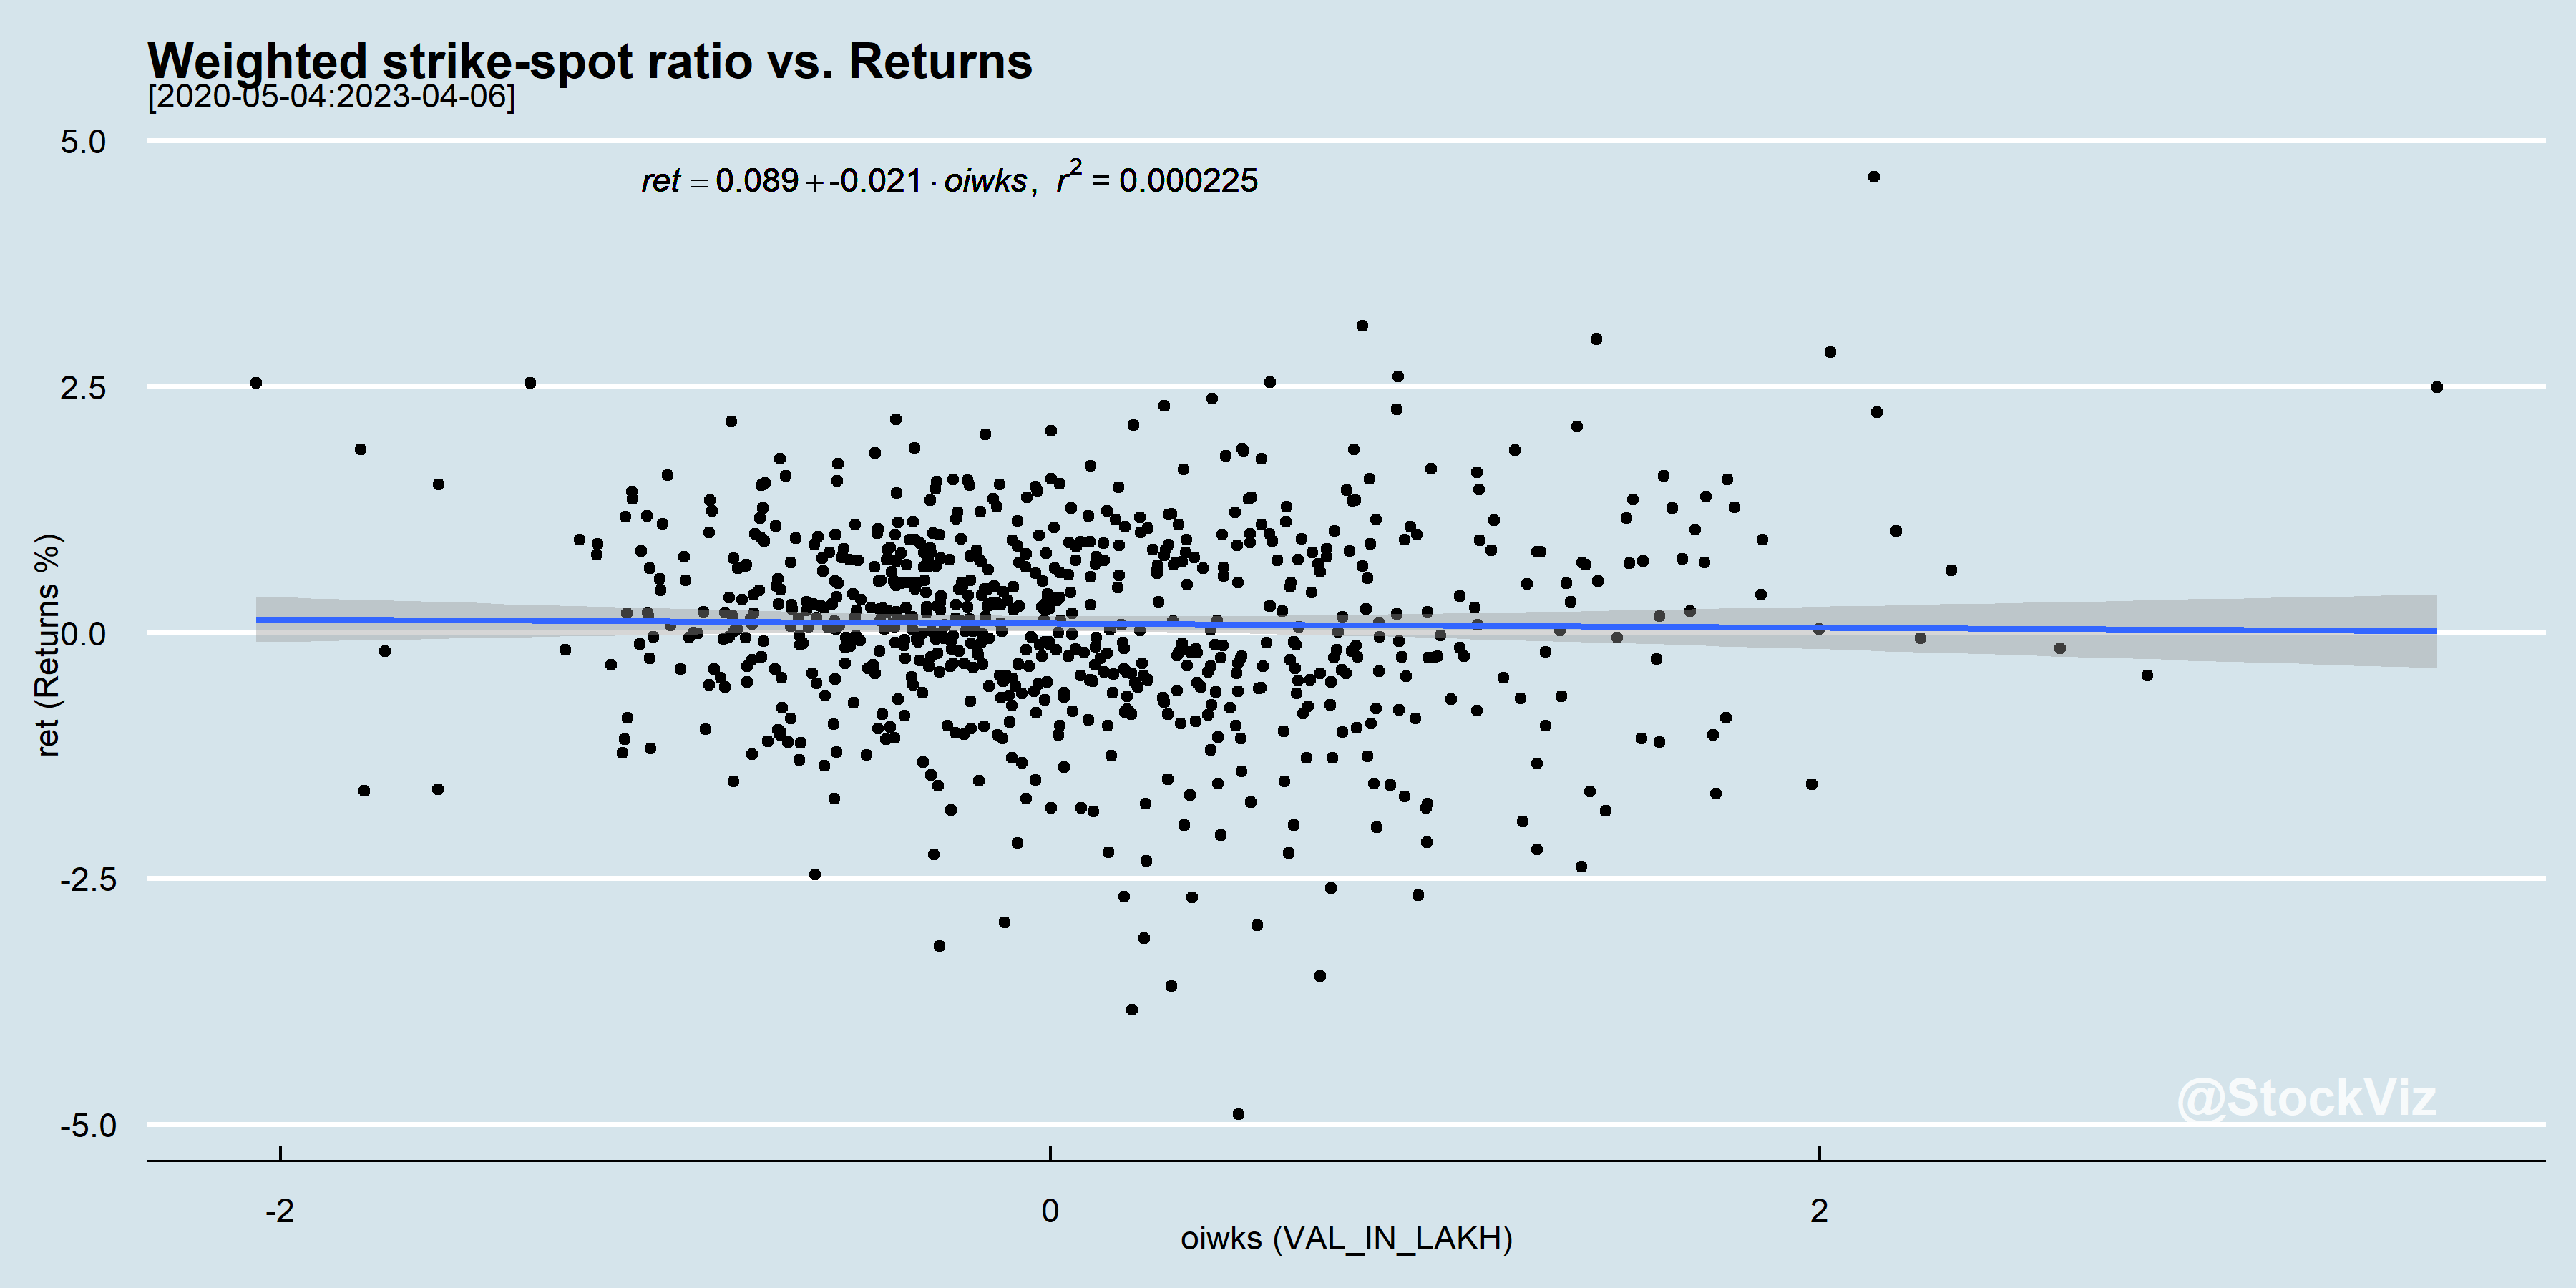
While their results look promising, we setup a very simple backtest to see if it can be used to trade the NIFTY. Sadly, both net Open Interest and Value traded fail to show any effect on next-day returns.
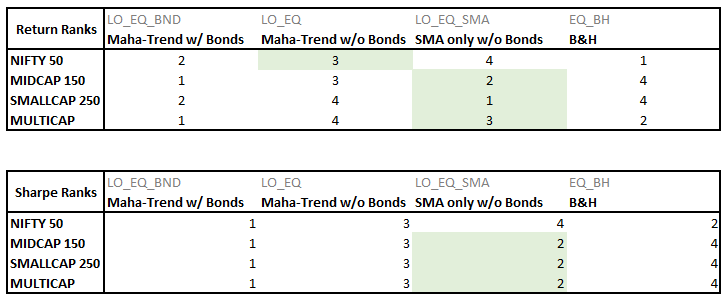
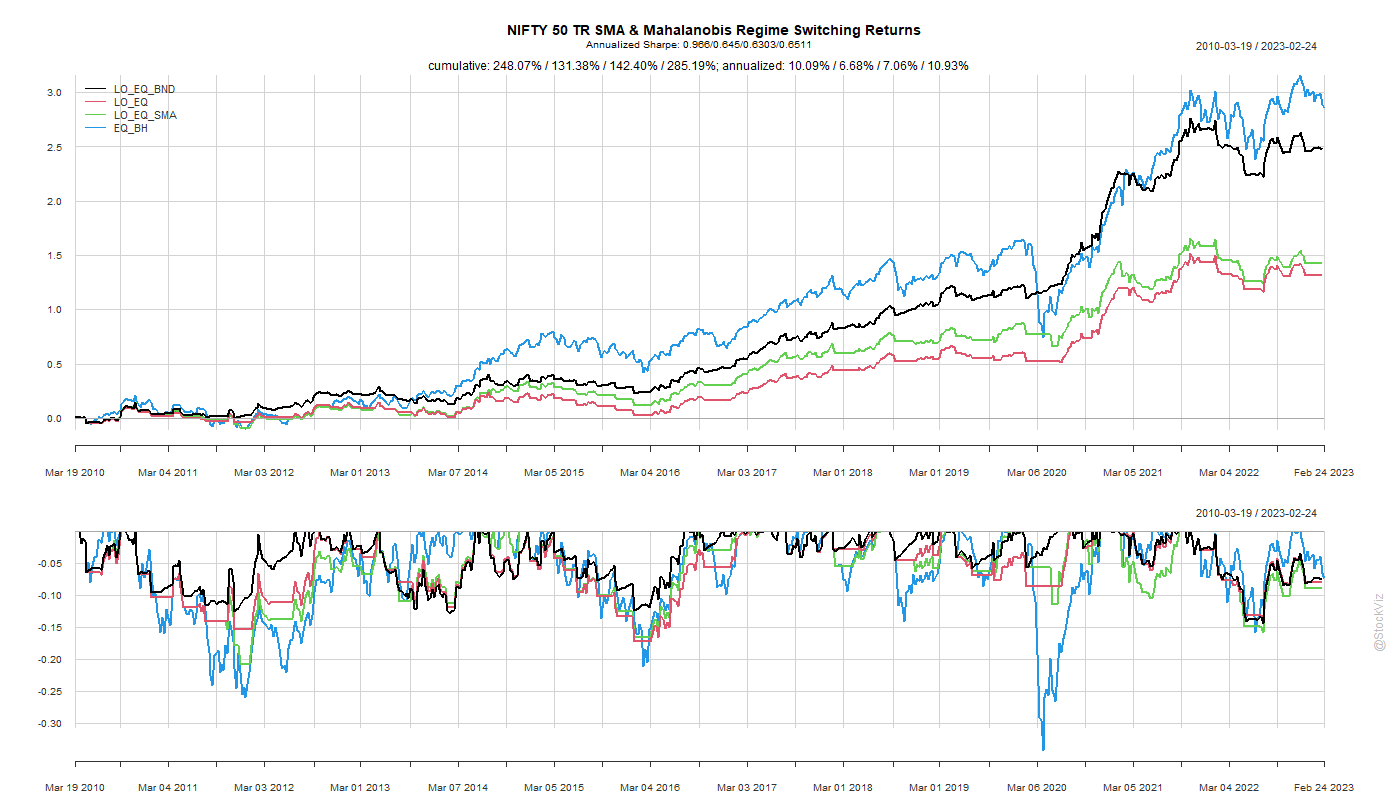
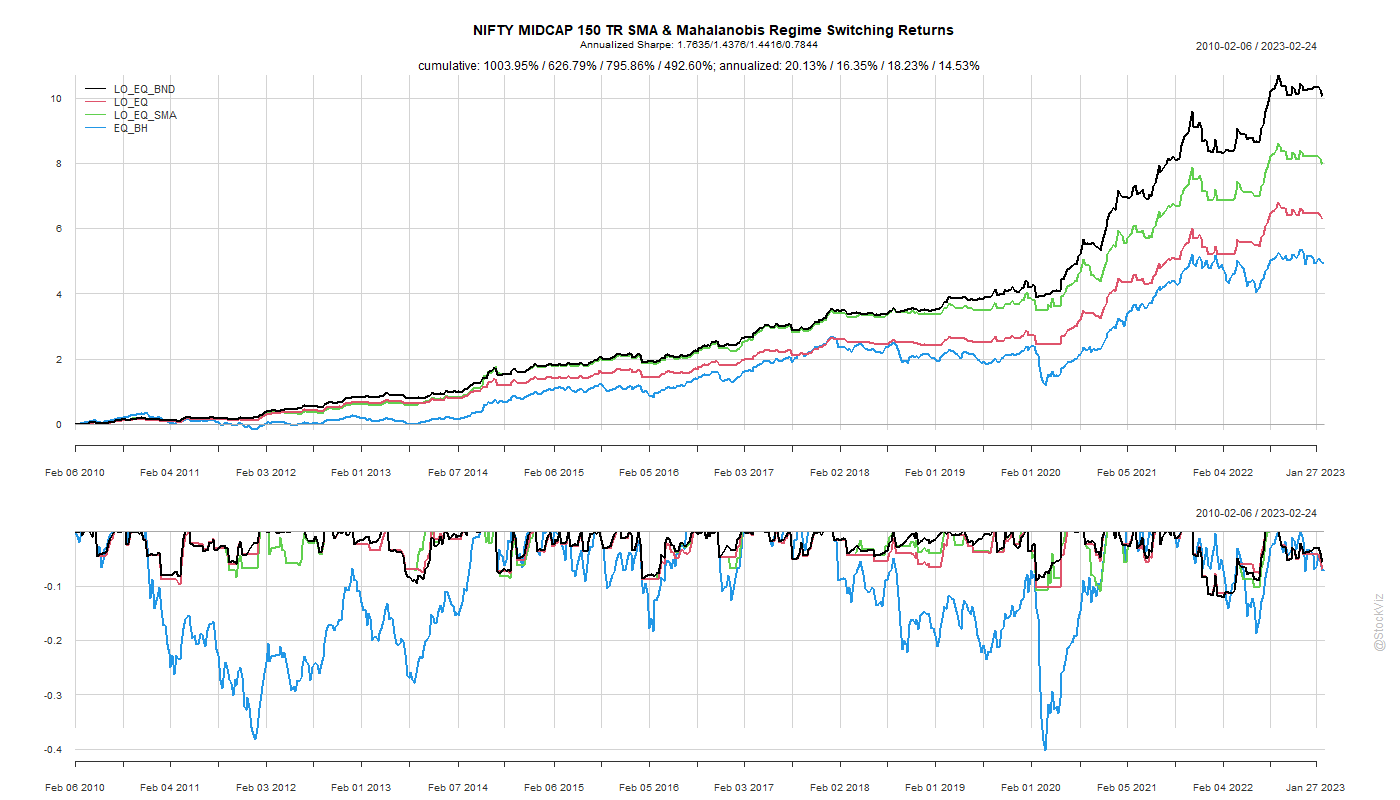
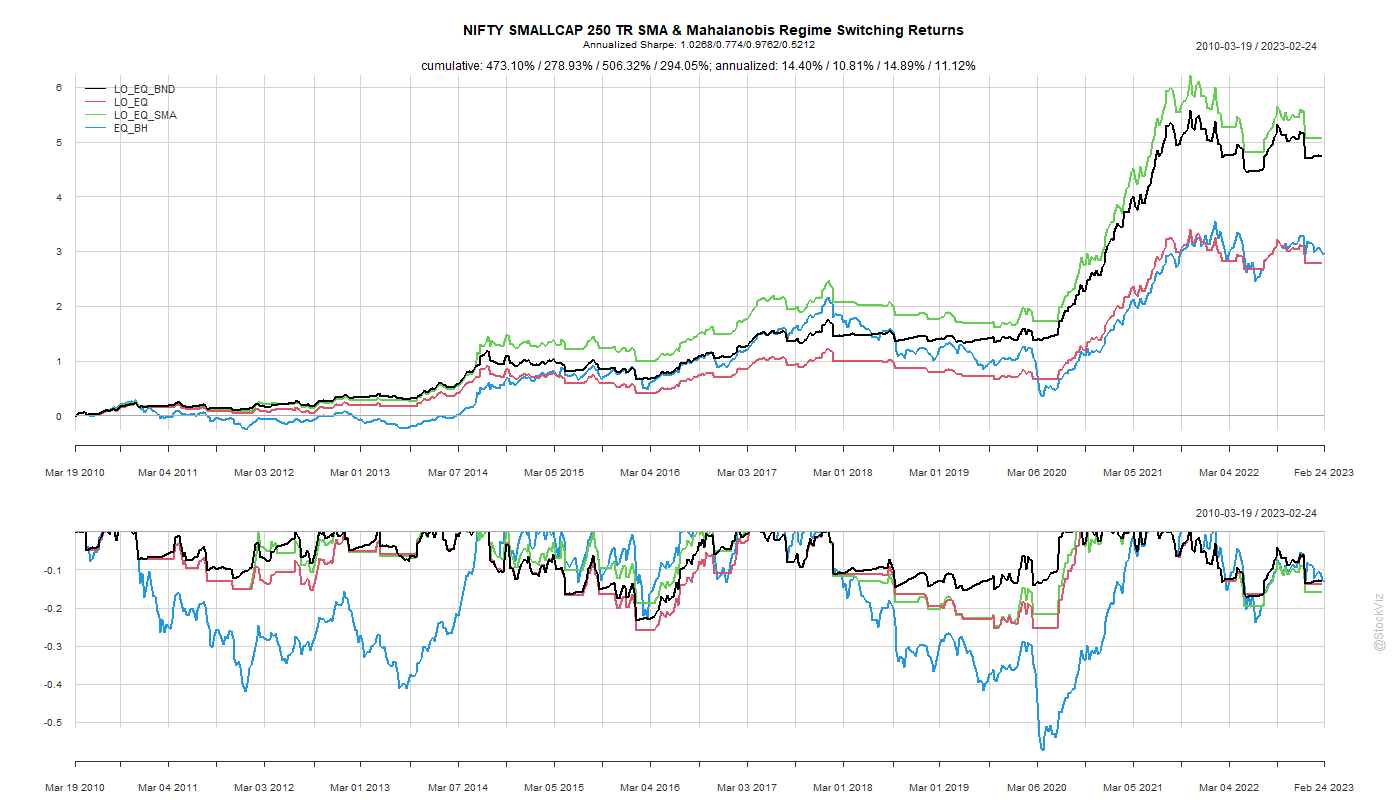
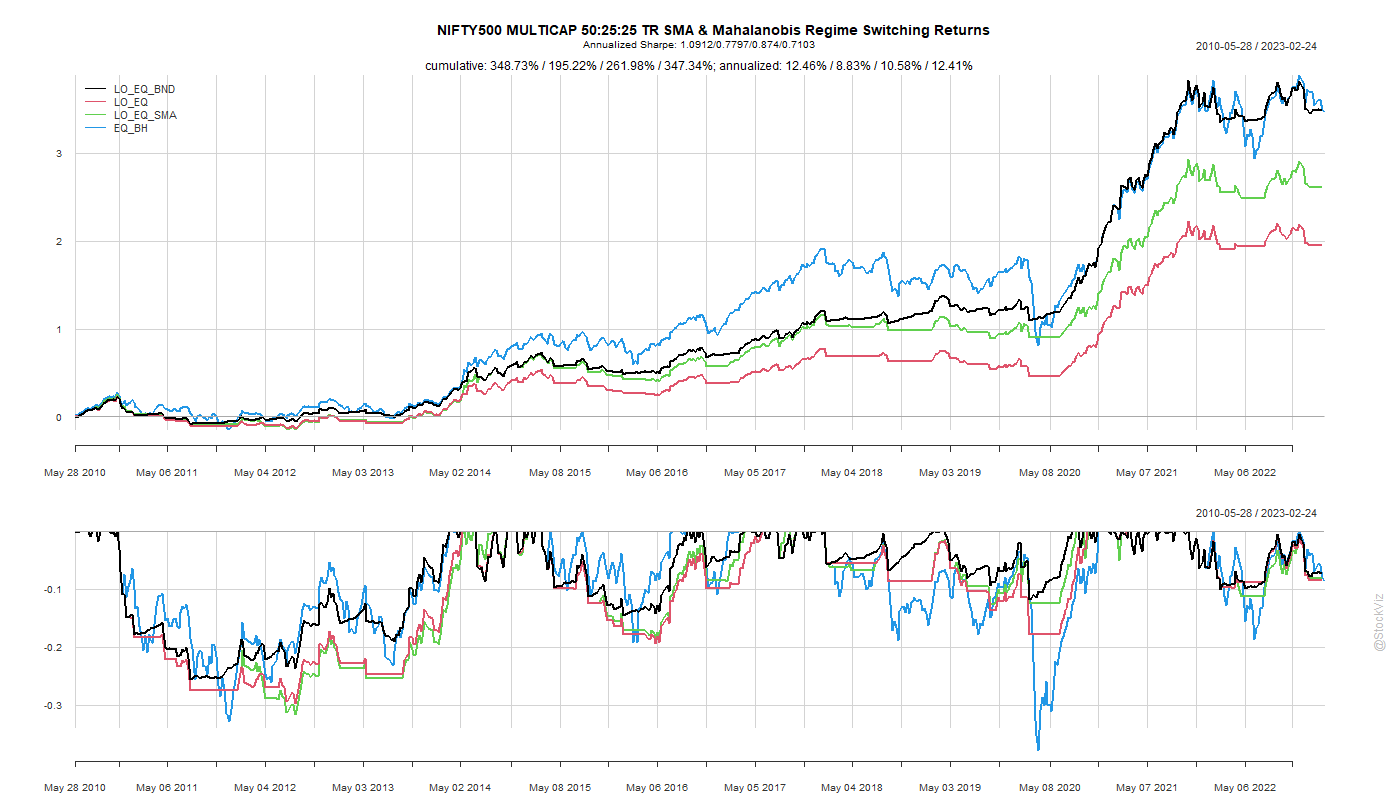
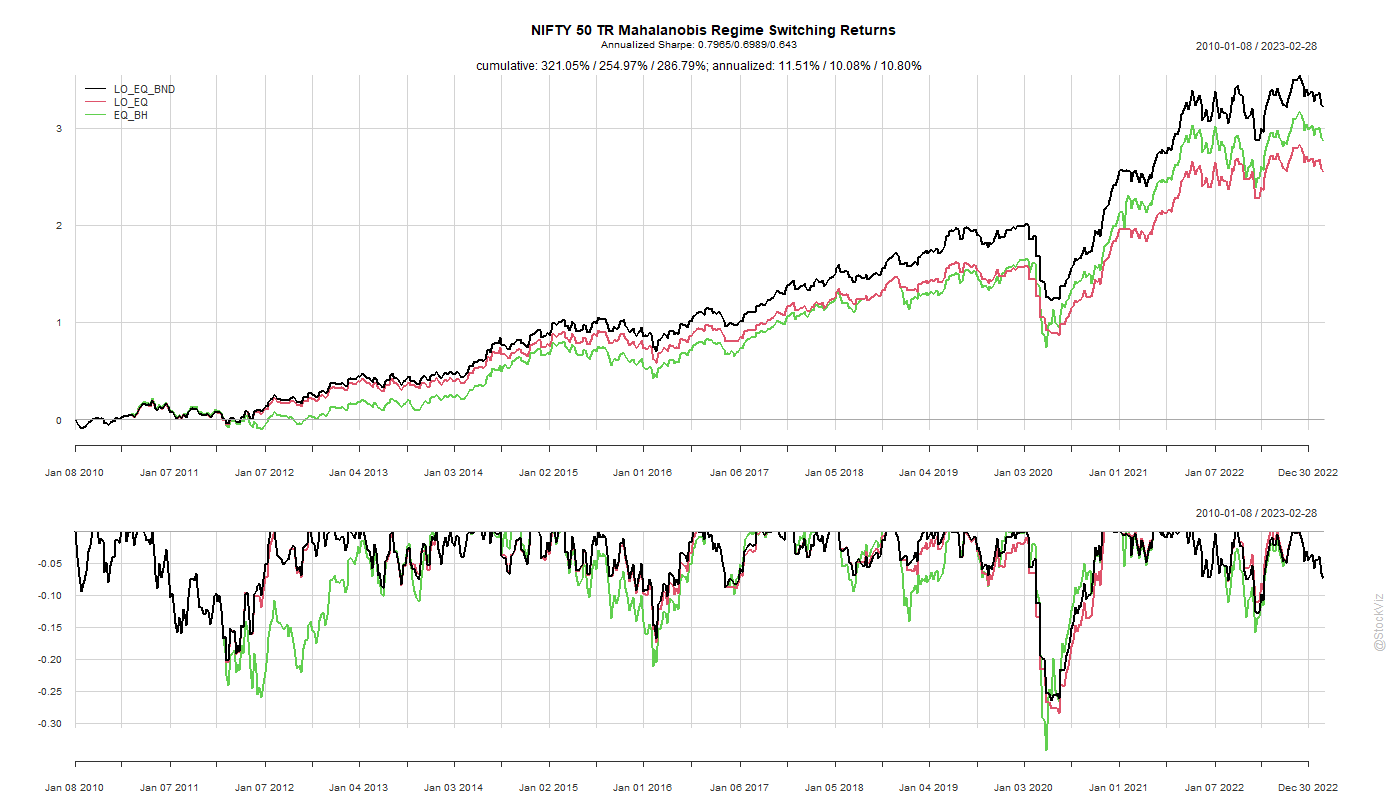
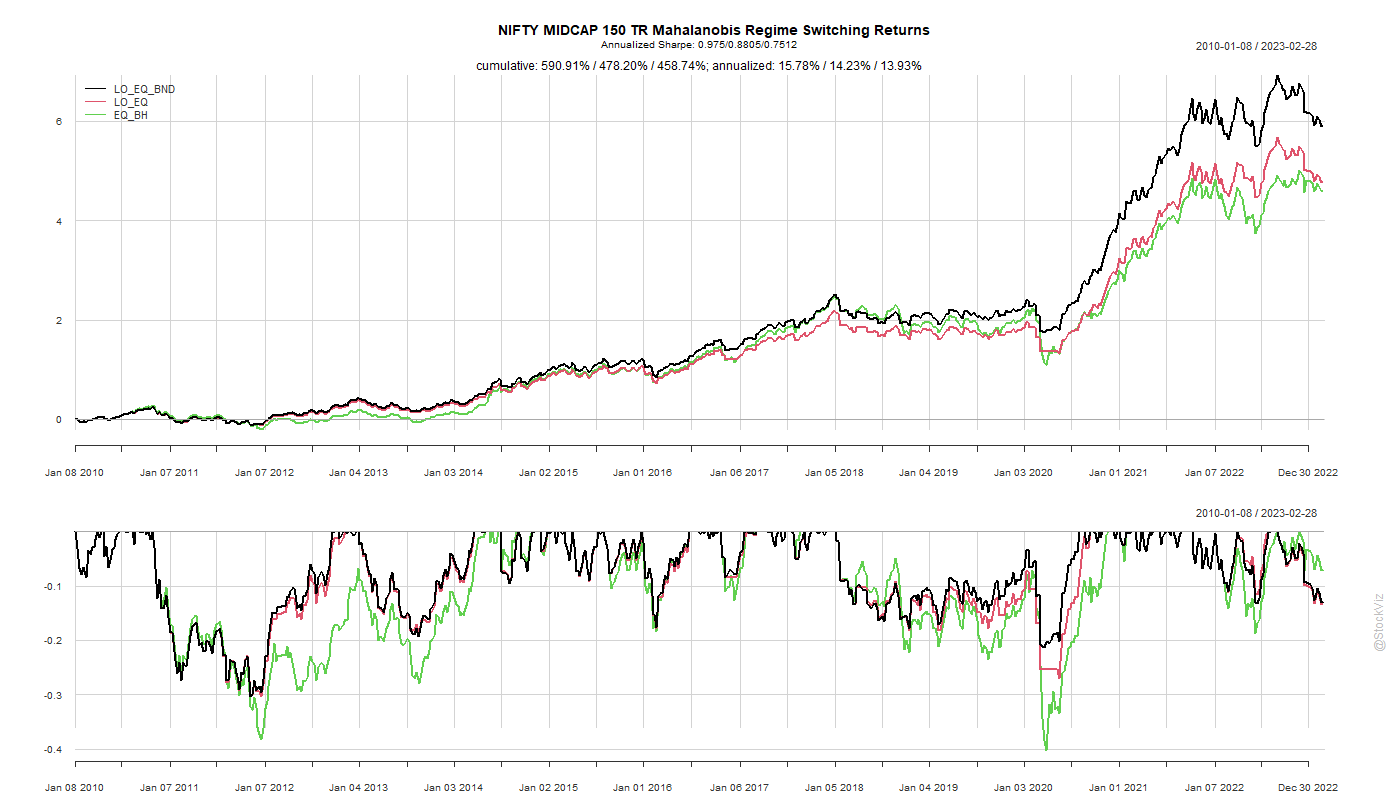
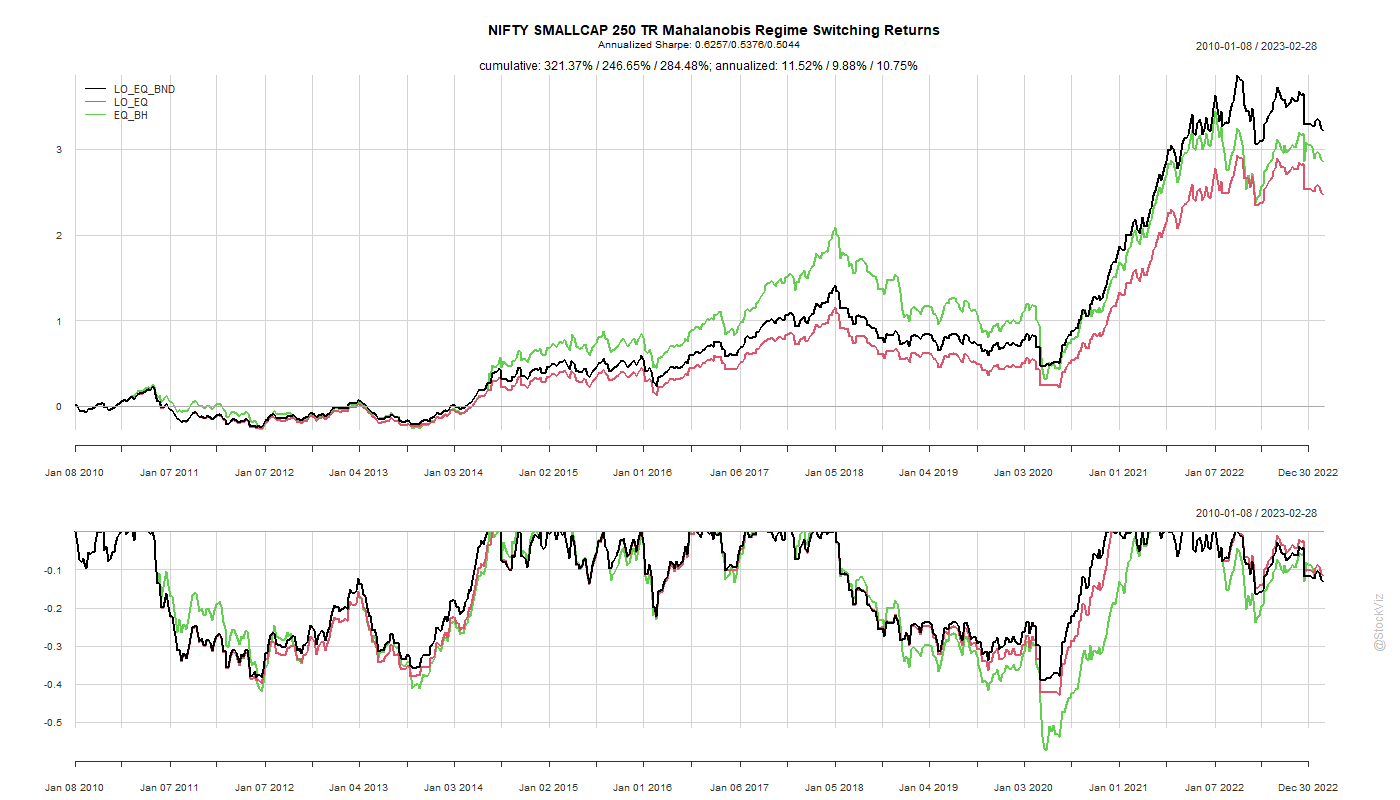
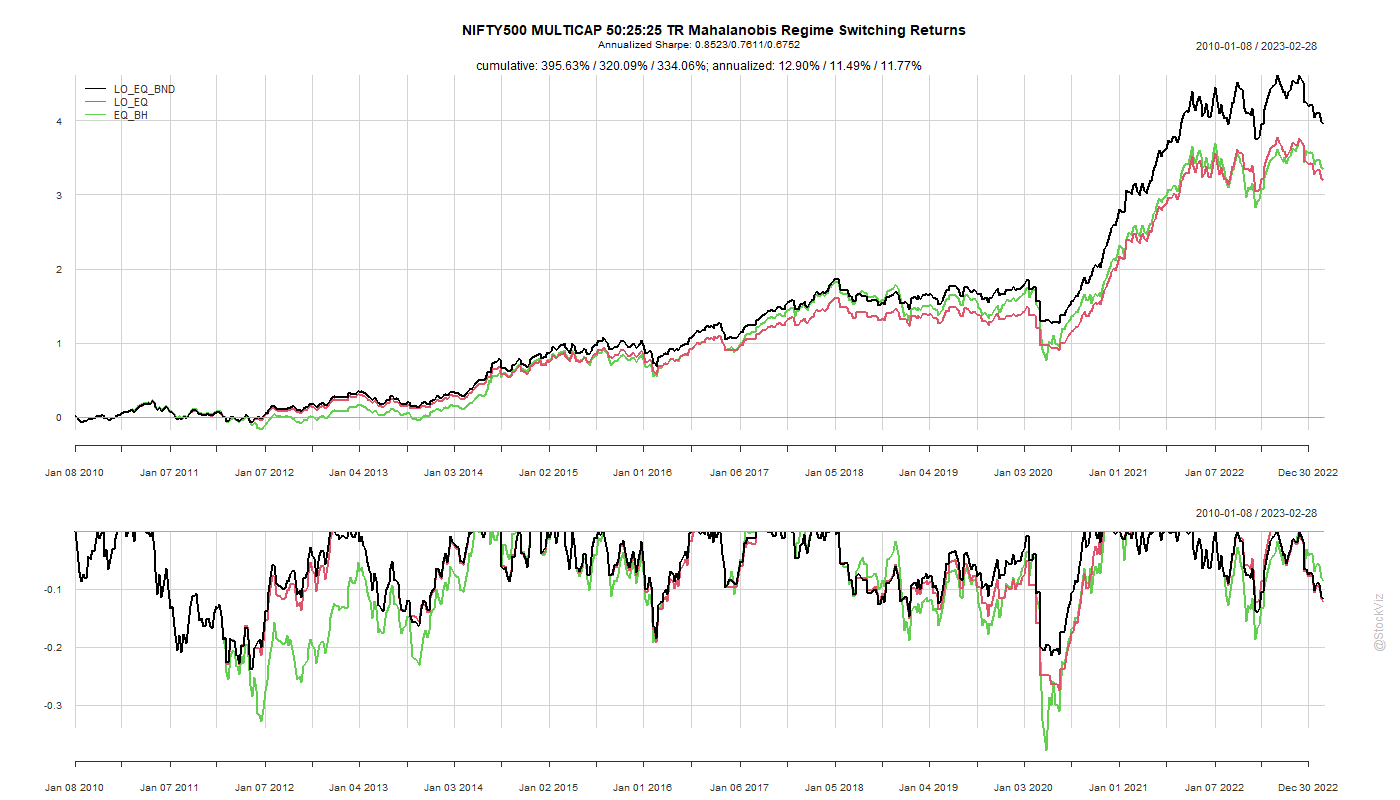
Previously, we constructed a portfolio that switches between equities and bonds based on the Mahalanobis distance between them. Here, keeping everything else the same, we add a trend filter to the same set of indices.
The composite regime-switching model ends up with superior Sharpe Ratios. However, if you don’t switch to bonds (and stay in cash, earning zero), then you maybe better off with a simple trend model.
The alpha seems to be in earning the risk-free rate when things are “bad” and getting long equities only when things are “favorable.”
Recently, we came across an interesting paper, Skulls, Financial Turbulence, and Risk Management, Mark Kritzman, CFA, and Yuanzhen Li, that uses the Mahalanobis distance to construct a turbulence index. The basic idea is that the more asset returns break from the past, the more “significant” a market event.
We took the basic intuition behind this and constructed a portfolio that switches between equities and bonds based on the Mahalanobis distance between them.
The out-of-sample results, factoring in transaction costs, look promising but doesn’t really stand out compared to other, more dumber, strategies that avoid steep drawdowns. However, two points over the Midcap buy & hold cannot be dismissed outright.