Equities
| MINTs | |
|---|---|
| JCI(IDN) | -0.93% |
| INMEX(MEX) | +0.17% |
| NGSEINDX(NGA) | -8.88% |
| XU030(TUR) | +8.03% |
| BRICS | |
|---|---|
| IBOV(BRA) | +1.02% |
| SHCOMP(CHN) | +2.38% |
| NIFTY(IND) | +4.49% |
| INDEXCF(RUS) | +5.49% |
| TOP40(ZAF) | +0.51% |
Commodities
| Energy | |
|---|---|
| Brent Crude Oil | -9.26% |
| Ethanol | +14.37% |
| Heating Oil | -4.74% |
| Natural Gas | -6.14% |
| RBOB Gasoline | -17.18% |
| WTI Crude Oil | -11.32% |
| Metals | |
|---|---|
| Copper | +1.66% |
| Gold 100oz | -3.07% |
| Palladium | +2.58% |
| Platinum | -4.86% |
| Silver 5000oz | -5.92% |
Currencies
| MINTs | |
|---|---|
| USDIDR(IDN) | -0.84% |
| USDMXN(MEX) | +0.42% |
| USDNGN(NGA) | +1.09% |
| USDTRY(TUR) | -2.41% |
| BRICS | |
|---|---|
| USDBRL(BRA) | +0.95% |
| USDCNY(CHN) | -0.43% |
| USDINR(IND) | -0.64% |
| USDRUB(RUS) | +8.61% |
| USDZAR(ZAF) | -2.23% |
| Agricultural | |
|---|---|
| Cattle | +6.09% |
| Cocoa | -9.56% |
| Coffee (Arabica) | -3.01% |
| Coffee (Robusta) | +4.07% |
| Corn | +17.10% |
| Cotton | +3.77% |
| Feeder Cattle | -0.31% |
| Lean Hogs | -18.14% |
| Lumber | -2.13% |
| Orange Juice | -8.18% |
| Soybean Meal | +25.67% |
| Soybeans | +13.43% |
| Sugar #11 | +3.69% |
| Wheat | +12.00% |
| White Sugar | +0.19% |
Credit Indices
| Index | Change |
|---|---|
| Markit CDX EM | -14.84% |
| Markit CDX NA HY | +1.20% |
| Markit CDX NA IG | -1.28% |
| Markit CDX NA IG HVOL | +14.53% |
| Markit iTraxx Asia ex-Japan IG | +10.99% |
| Markit iTraxx Australia | +8.31% |
| Markit iTraxx Europe | +0.54% |
| Markit iTraxx Europe Crossover | +88.89% |
| Markit iTraxx Japan | +9.27% |
| Markit iTraxx SovX Western Europe | +3.06% |
| Markit LCDX (Loan CDS) | -0.30% |
| Markit MCDX (Municipal CDS) | +1.13% |
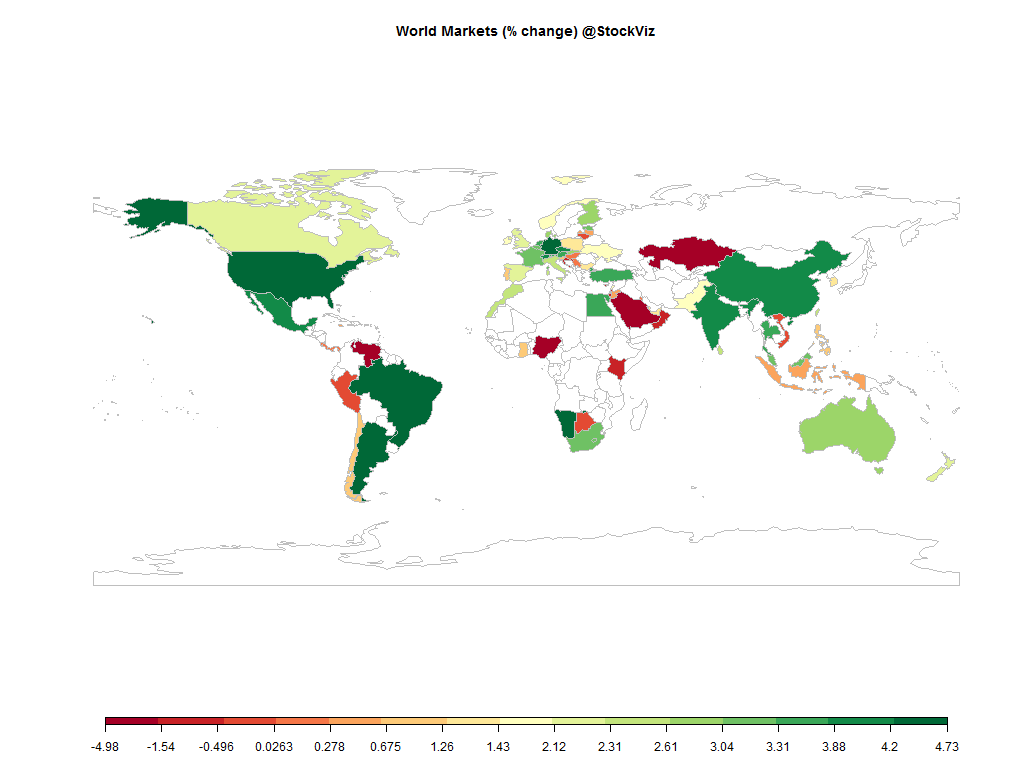
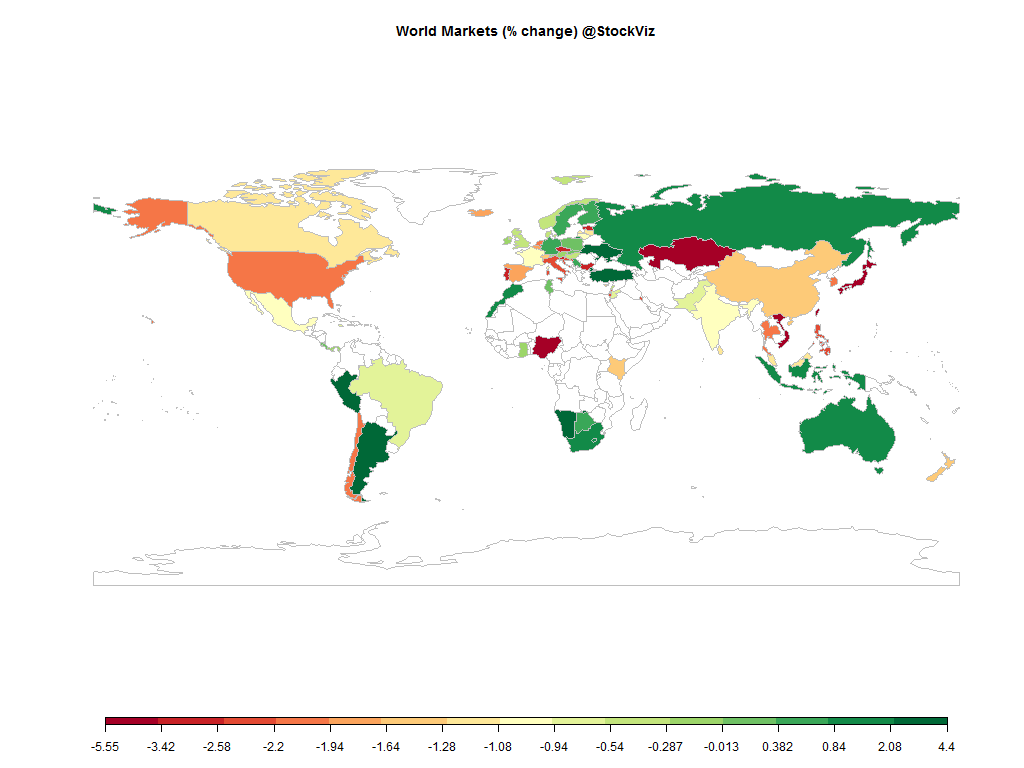
A month that started with jitters about the end of QE in the US ended with a monster rally on Japan pushing the button on a broader QE initiative that will see it buying foreign bonds and equities.
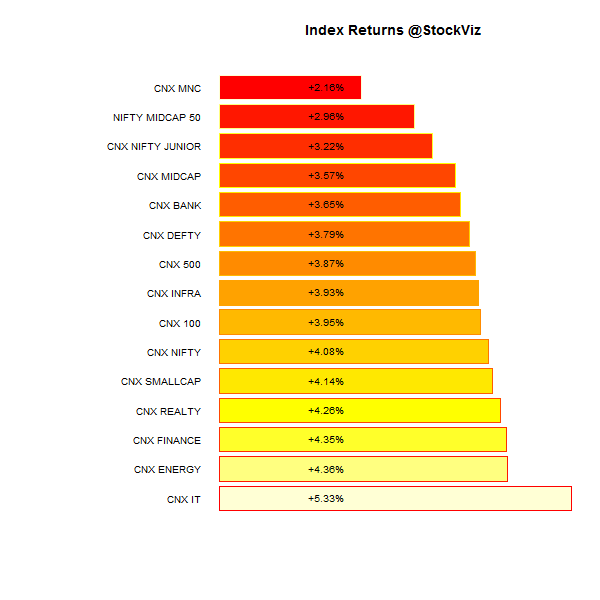
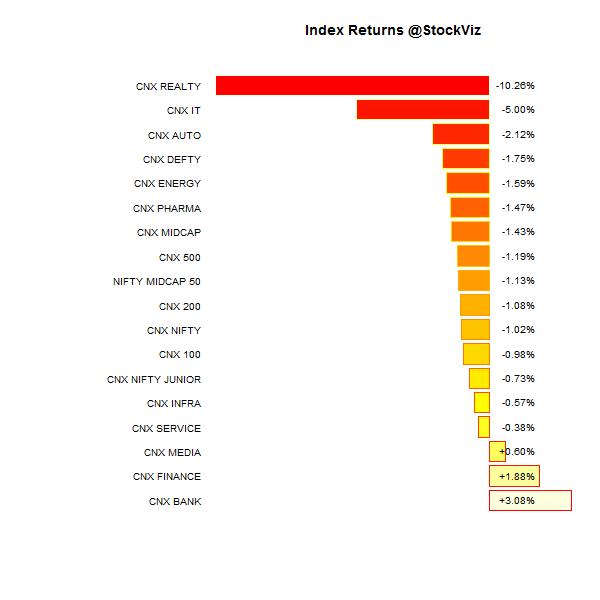
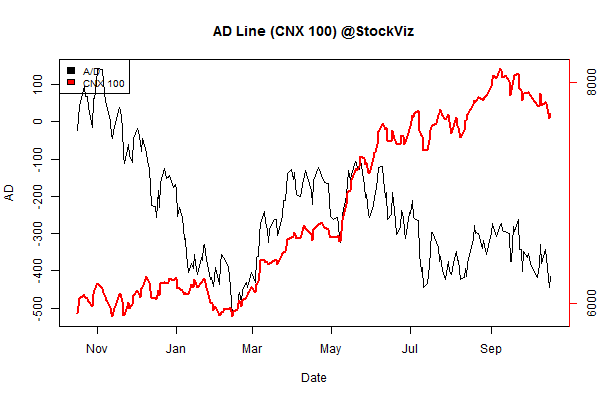
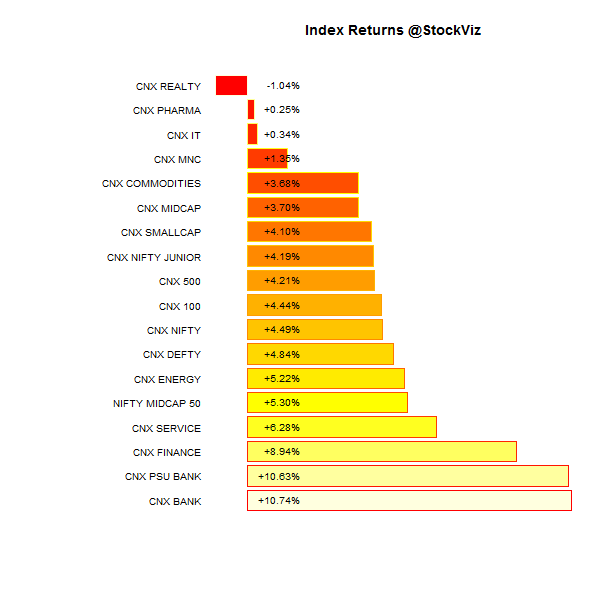
Index Performance
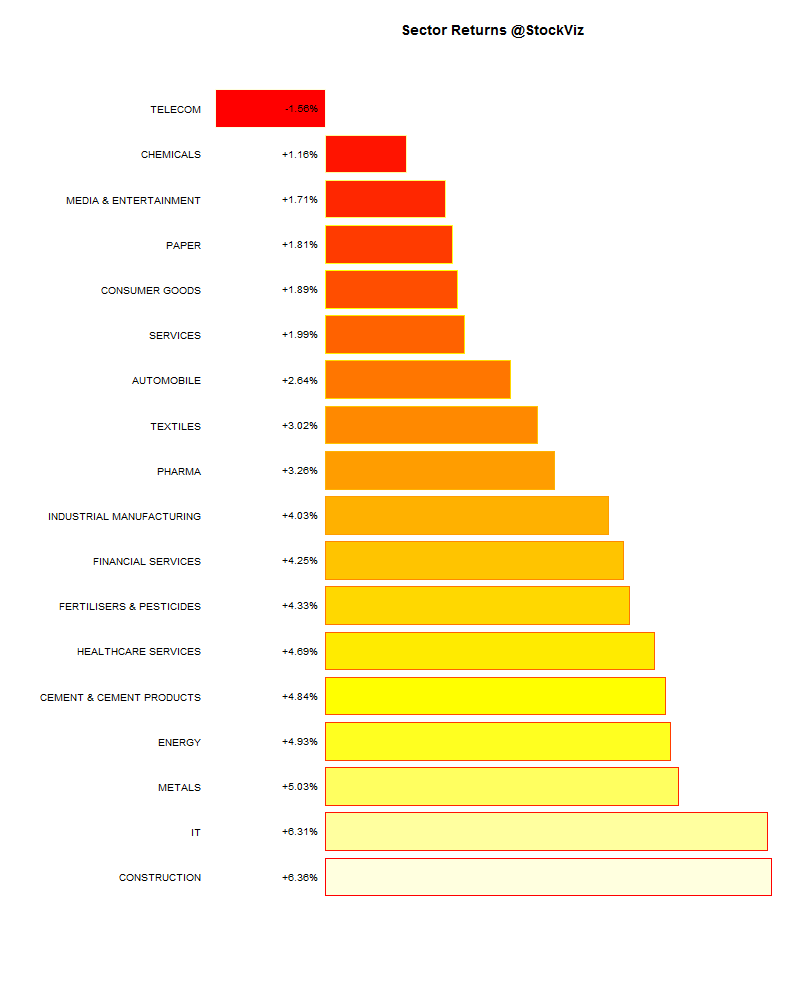
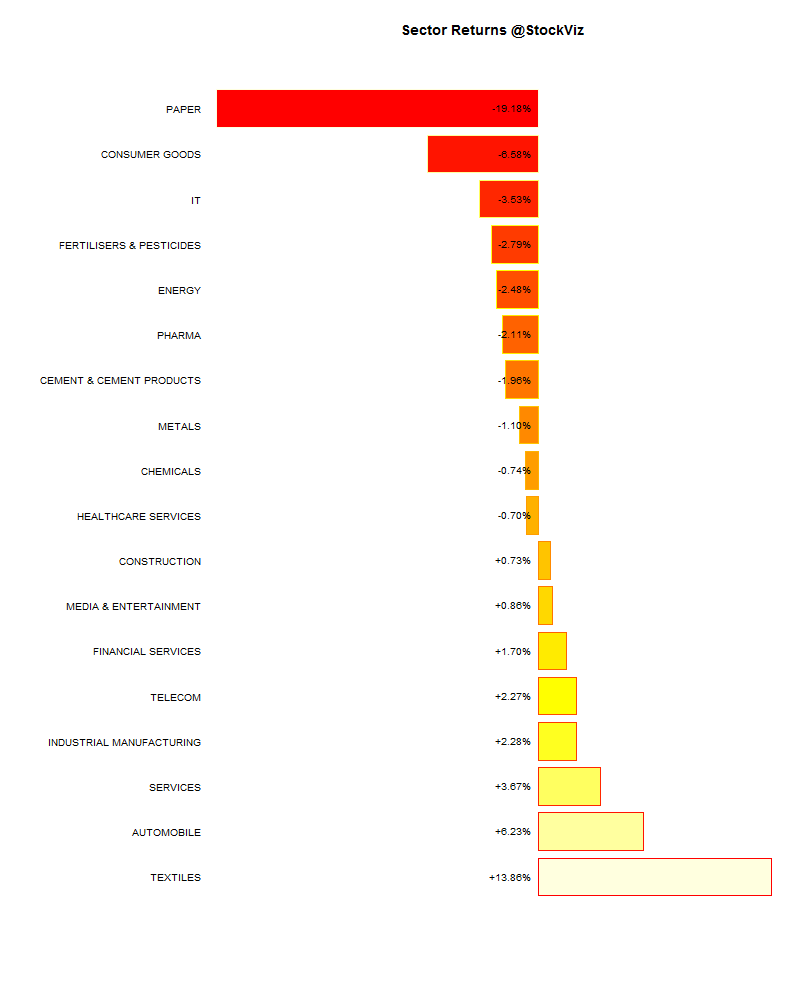
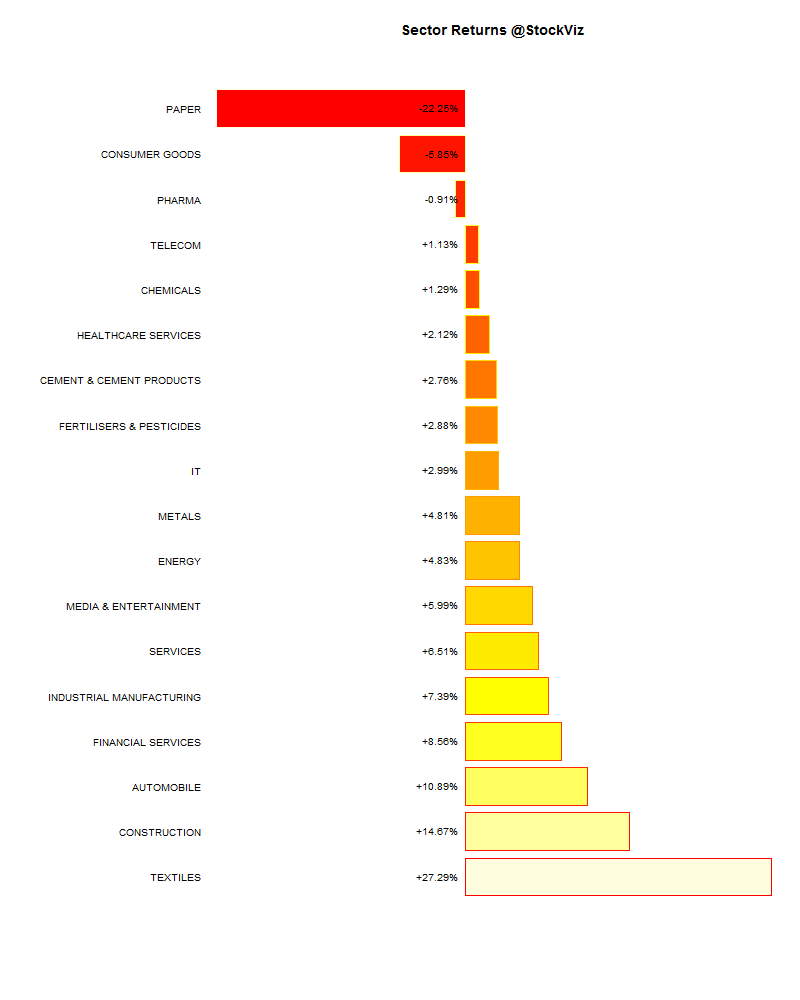
Sector Performance
Market Cap Decile Performance
| Decile | Mkt. Cap. | Adv/Decl |
|---|---|---|
| 1 (micro) | -10.35% | 69/66 |
| 2 | -0.01% | 73/64 |
| 3 | +2.53% | 68/69 |
| 4 | +0.89% | 72/65 |
| 5 | +2.06% | 66/71 |
| 6 | +3.11% | 77/60 |
| 7 | +1.51% | 67/70 |
| 8 | +2.55% | 75/62 |
| 9 | +3.58% | 73/64 |
| 10 (mega) | +4.07% | 72/65 |
Micro-caps under-performed badly. But the clear winner in October were the large-caps.
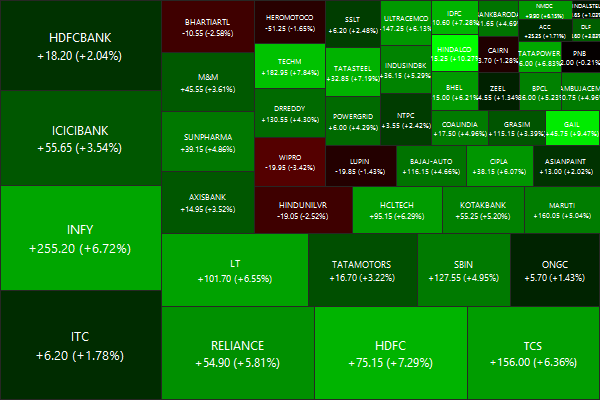
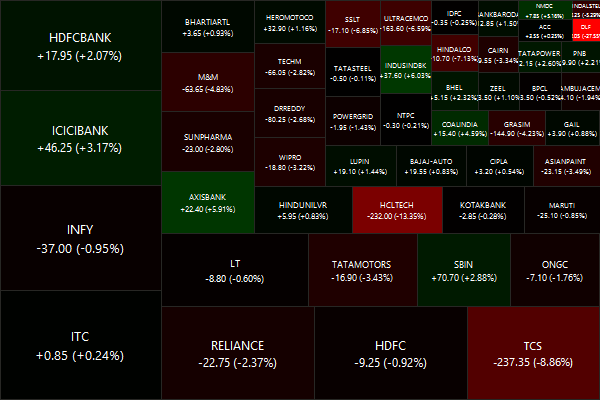
Top Winners and Losers
SEBI went after the DLF, now there’s a big question mark whether DLF should continue in the Nifty index.
ETFs
| BANKBEES | +11.06% |
| CPSEETF | +7.39% |
| PSUBNKBEES | +5.34% |
| JUNIORBEES | +5.30% |
| INFRABEES | +4.37% |
| NIFTYBEES | +4.21% |
| GOLDBEES | -1.73% |
Gold was the most hated asset, the end of US QE and all…
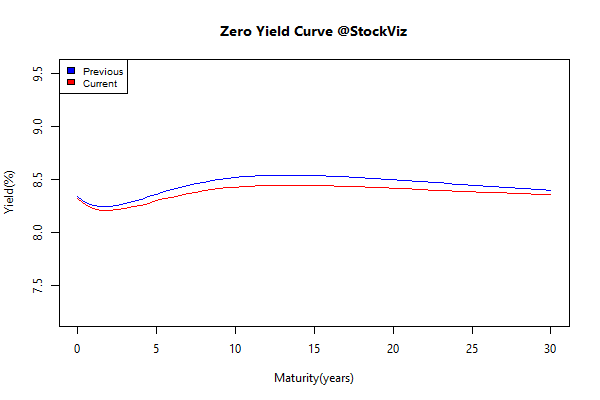
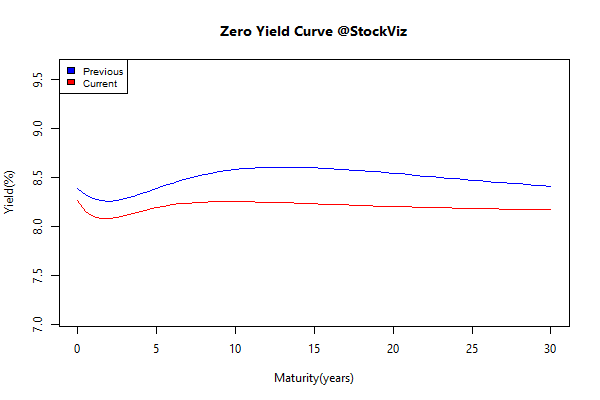
Yield Curve
Japan is going to buy foreign bonds. So there:
Bond Indices
| Sub Index | Change in YTM | Total Return(%) |
|---|---|---|
| GSEC TB | -0.06 | +0.71% |
| GSEC SUB 1-3 | -0.37 | +0.09% |
| GSEC SUB 3-8 | -0.12 | +0.74% |
| GSEC SUB 8 | -0.12 | +2.38% |
Is the Japanese bid factored in?
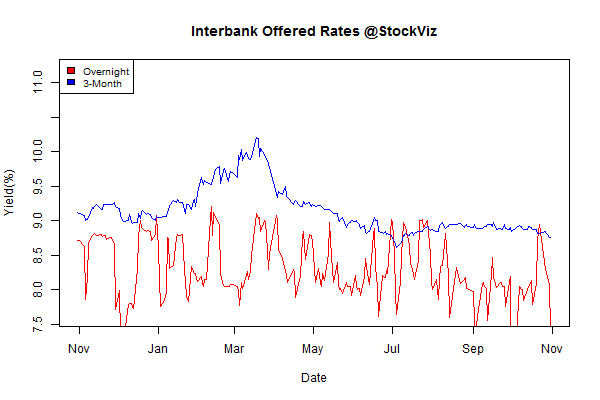
Interbank Lending
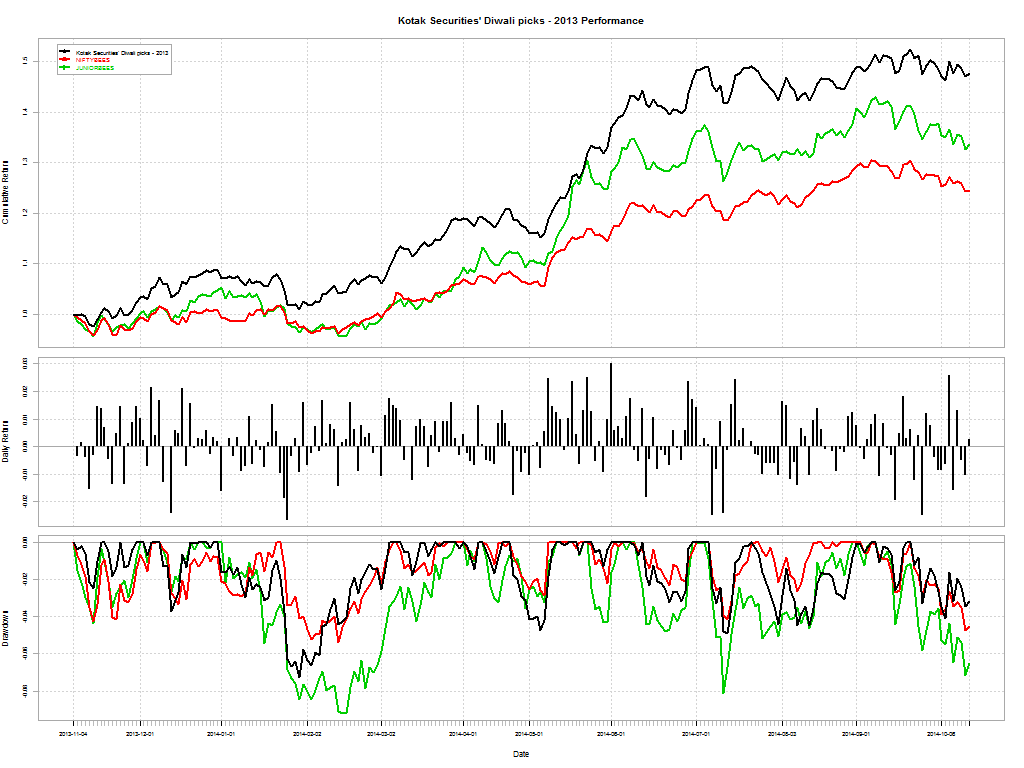
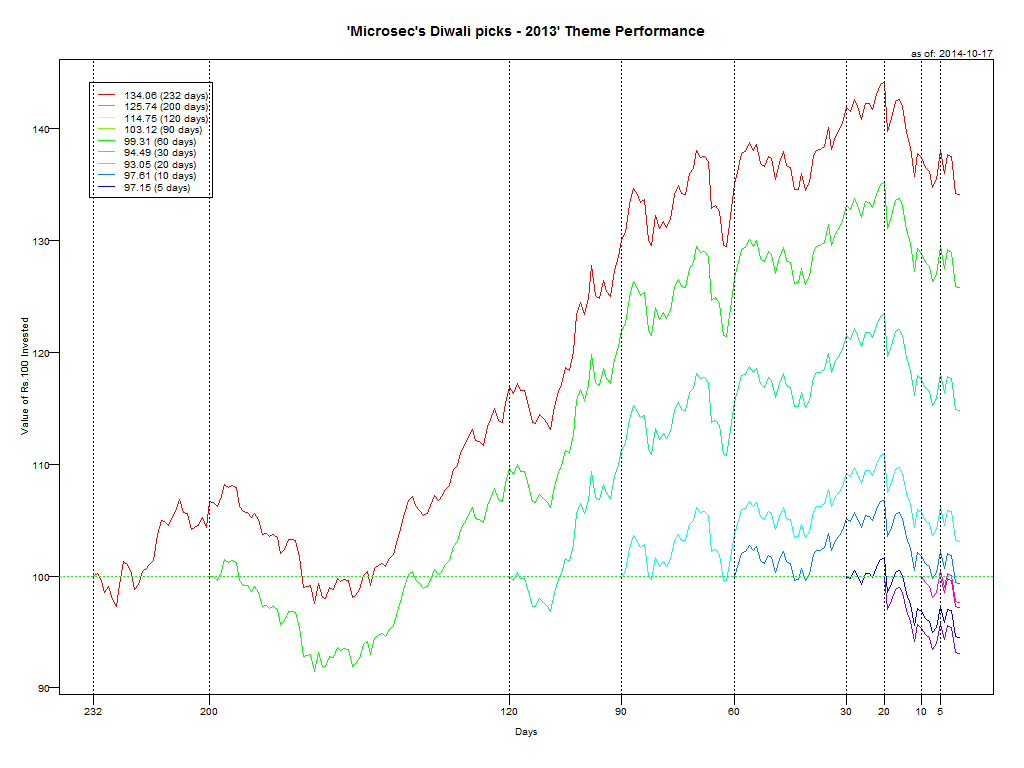
Theme Performance
| Market Fliers | +13.11% |
| Industrial Value | +8.45% |
| ADAG Mania | +7.16% |
| Magic Formula Investing | +4.89% |
| Momentum 200 | +4.85% |
| Enterprise Yield | +3.51% |
| Financial Strength Value | +3.11% |
| Auto | +3.08% |
| Growth with Moat | +2.85% |
| Old Economy Value | +2.05% |
| CNX 100 50-Day Tactical | +1.91% |
| Balance-sheet Strength | +0.92% |
| Piotroski ROC Small Caps | +0.87% |
| Efficient Growth | +0.72% |
| Quality to Price | +0.45% |
| Refract: PPFAS Long Term Value Fund | +0.16% |
| Market Elephants | -1.22% |
| The Other Value | -2.17% |
| IT 3rd Benchers | -2.92% |
Market Fliers finally woke up. Momentum put in a decent performance. Overall, not a bad month.
Thought to sum up the month
“Humans hate randomness, the idea that we lack control and don’t really know what the future holds. It stimulates excitement to feel like we are in control of the future.”
And financial news organizations from CNBC to print and digital news outlets are all too happy to give viewers and readers what they seem to want. Besides, if publications, Websites, and television networks simply told investors to buy and hold, with periodic rebalancing, it would be that much harder to fill pages and airtime.
Source: The Timeless Allure of Stock-Market Timers
Related: