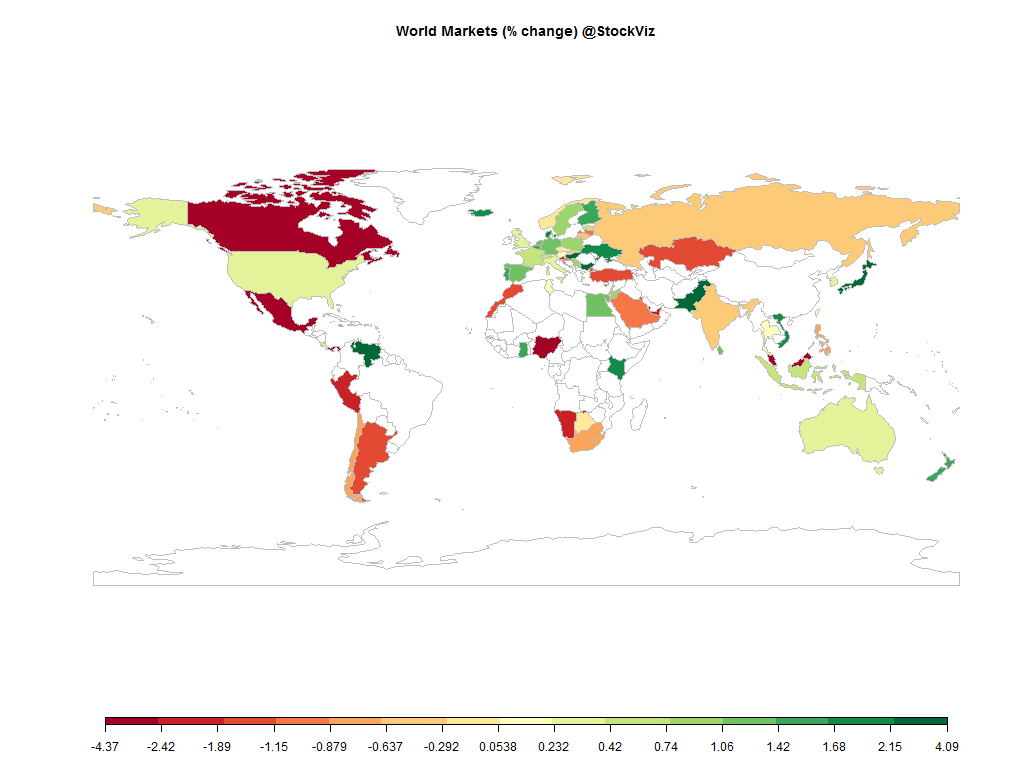
Equities
| MINTs | |
|---|---|
| JCI(IDN) | -0.31% |
| INMEX(MEX) | +2.18% |
| NGSEINDX(NGA) | -1.49% |
| XU030(TUR) | +0.92% |
| BRICS | |
|---|---|
| IBOV(BRA) | +3.43% |
| SHCOMP(CHN) | +5.80% |
| NIFTY(IND) | +0.01% |
| INDEXCF(RUS) | -0.72% |
| TOP40(ZAF) | +2.96% |
Commodities
| Energy | |
|---|---|
| Ethanol | -5.78% |
| WTI Crude Oil | -0.41% |
| RBOB Gasoline | -1.60% |
| Brent Crude Oil | -1.00% |
| Heating Oil | -2.34% |
| Natural Gas | -8.76% |
| Metals | |
|---|---|
| Gold 100oz | -2.18% |
| Palladium | -1.18% |
| Platinum | -2.83% |
| Copper | -0.68% |
| Silver 5000oz | -7.02% |
Currencies
| MINTs | |
|---|---|
| USDIDR(IDN) | +0.24% |
| USDMXN(MEX) | -0.68% |
| USDNGN(NGA) | +0.83% |
| USDTRY(TUR) | +0.75% |
| BRICS | |
|---|---|
| USDBRL(BRA) | +0.32% |
| USDCNY(CHN) | +0.53% |
| USDINR(IND) | +1.61% |
| USDRUB(RUS) | +2.29% |
| USDZAR(ZAF) | -0.08% |
| Agricultural | |
|---|---|
| Cocoa | +3.59% |
| Corn | +3.53% |
| Soybean Meal | -3.96% |
| Soybeans | -1.39% |
| Coffee (Arabica) | +0.57% |
| Cotton | +0.12% |
| Feeder Cattle | -2.39% |
| Orange Juice | -5.25% |
| Sugar #11 | -0.40% |
| Wheat | +0.88% |
| Cattle | -0.34% |
| Coffee (Robusta) | -2.21% |
| Lean Hogs | -6.49% |
| Lumber | +0.29% |
| White Sugar | +0.10% |
Credit Indices
| Index | Change |
|---|---|
| Markit CDX EM | -0.30% |
| Markit CDX NA HY | +0.52% |
| Markit CDX NA IG | +0.73% |
| Markit iTraxx Asia ex-Japan IG | +8.59% |
| Markit iTraxx Australia | +7.20% |
| Markit iTraxx Europe | +4.16% |
| Markit iTraxx Europe Crossover | +16.58% |
| Markit iTraxx Japan | +2.11% |
| Markit iTraxx SovX Western Europe | +2.94% |
| Markit LCDX (Loan CDS) | -0.18% |
| Markit MCDX (Municipal CDS) | +2.46% |
All I can say about this week is that I am glad that its over.
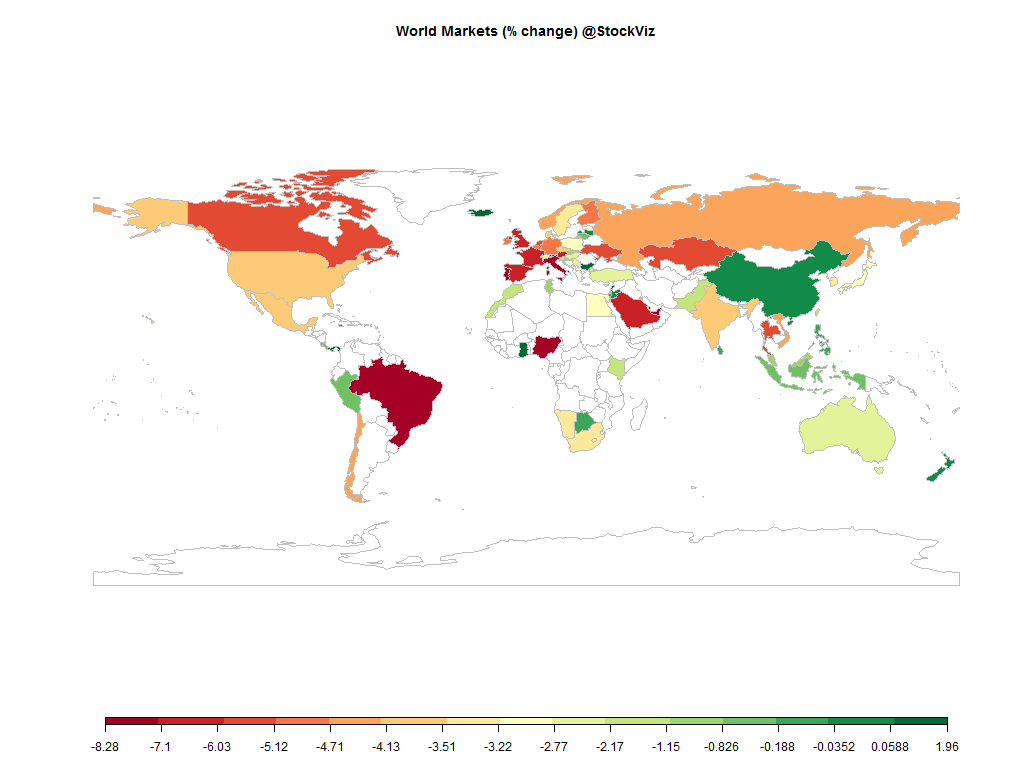
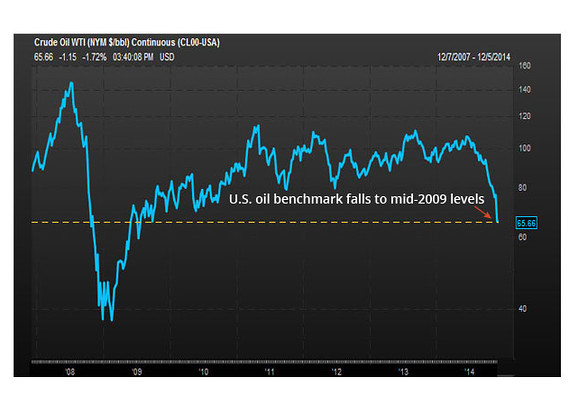
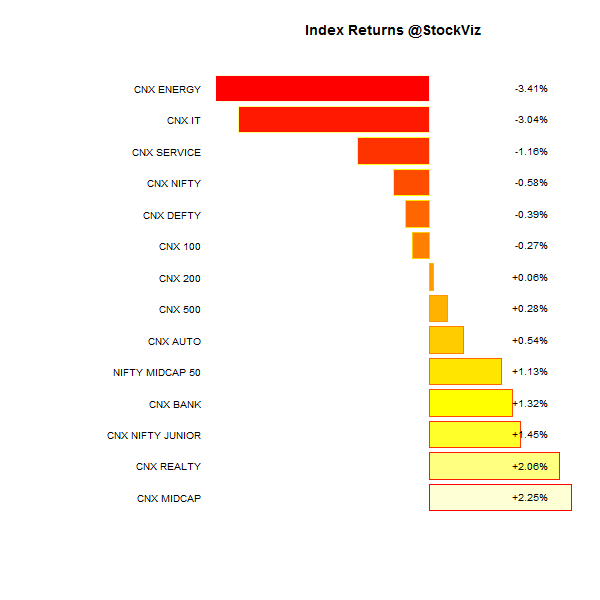
The NIFTY ended flat for the week but that hides the roller-coaster ride it put investors through. After all the oil-related panic, the S&P ended up more than 2% for the week.
Oil ended down, dollar up.
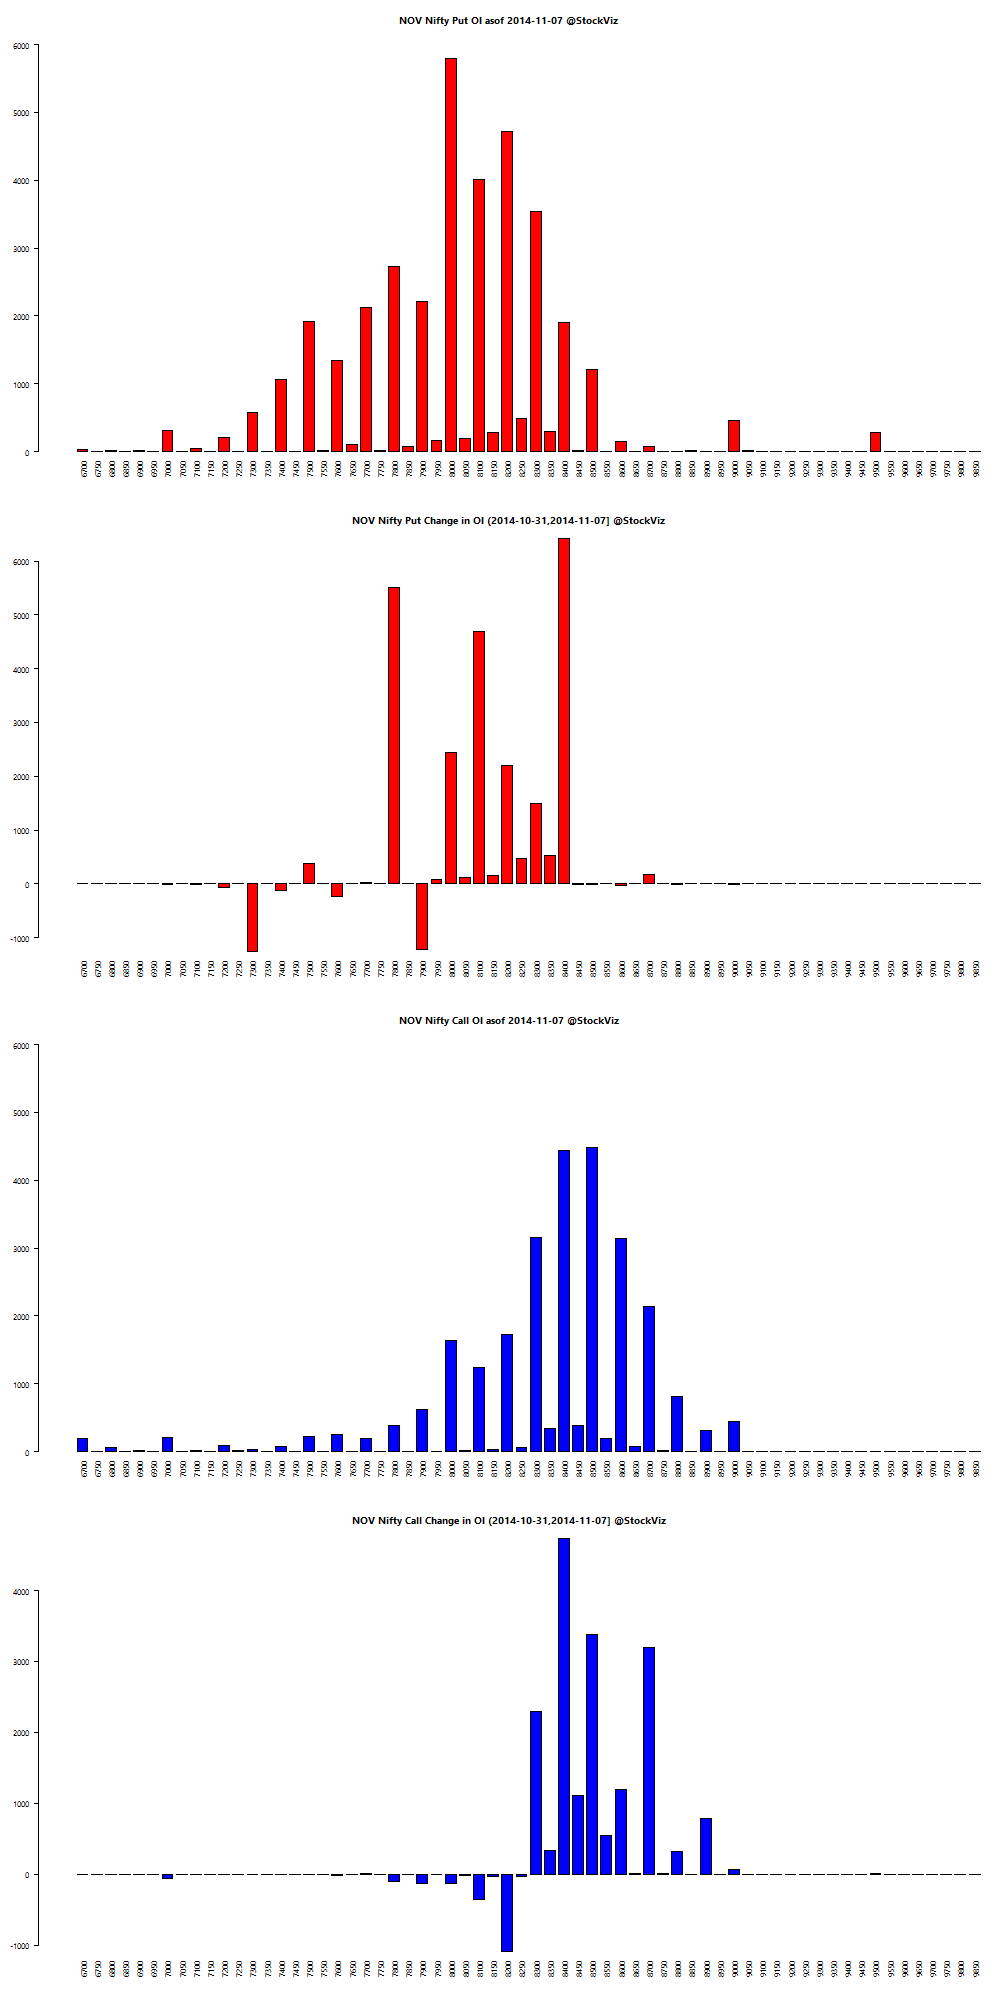
Hopefully Santa visits before expiry.
The NIFTY ended flat for the week but that hides the roller-coaster ride it put investors through. After all the oil-related panic, the S&P ended up more than 2% for the week.
Oil ended down, dollar up.
Hopefully Santa visits before expiry.
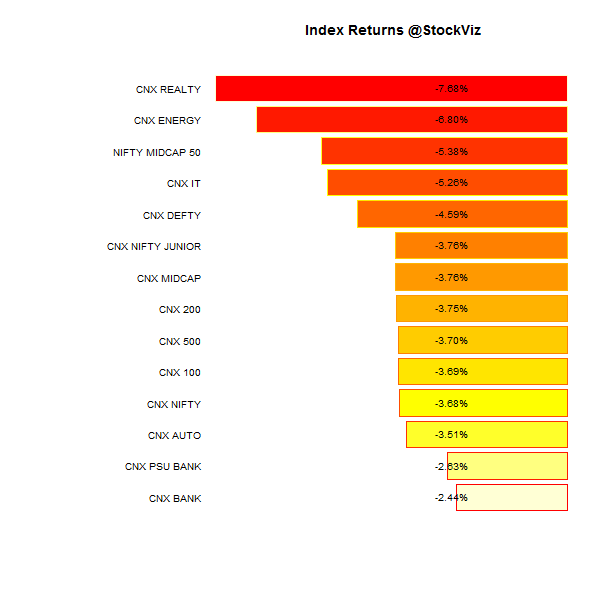
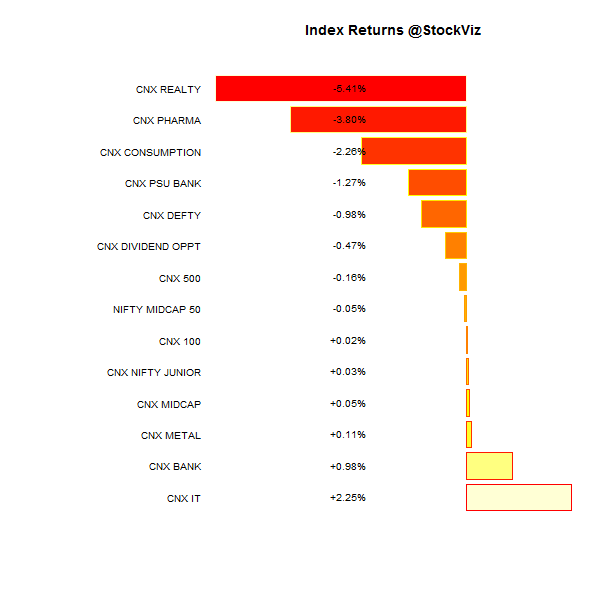
Index Returns
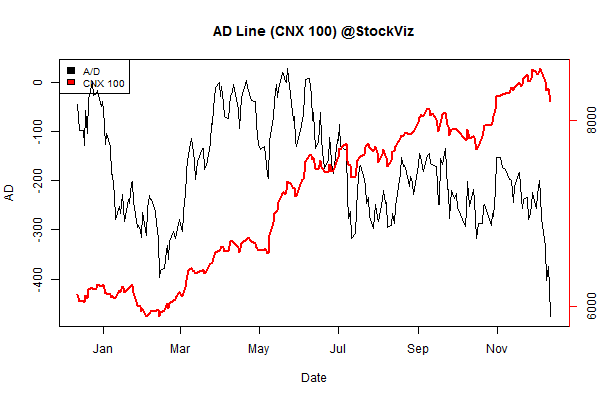
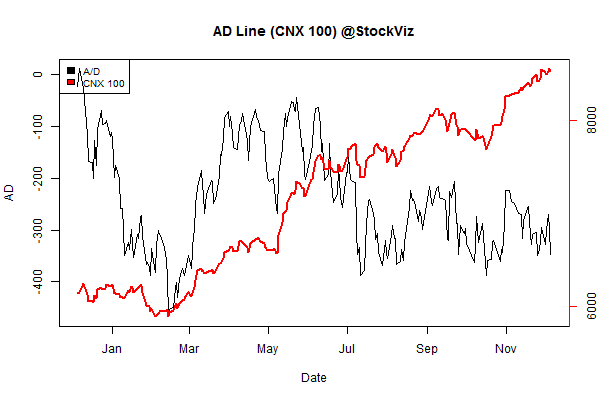
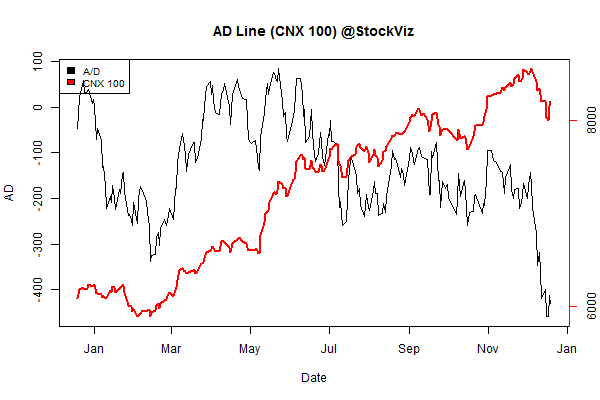
Advance Decline
Market Cap Decile Performance
| Decile | Mkt. Cap. | Adv/Decl |
|---|---|---|
| 1 (micro) | -6.25% | 63/74 |
| 2 | -3.65% | 63/73 |
| 3 | -2.93% | 64/73 |
| 4 | -2.21% | 61/75 |
| 5 | -3.07% | 63/73 |
| 6 | -1.98% | 65/72 |
| 7 | -2.00% | 56/80 |
| 8 | -1.38% | 64/73 |
| 9 | -1.17% | 64/72 |
| 10 (mega) | -0.01% | 68/69 |
The sell-off was brutal below the mega-caps…
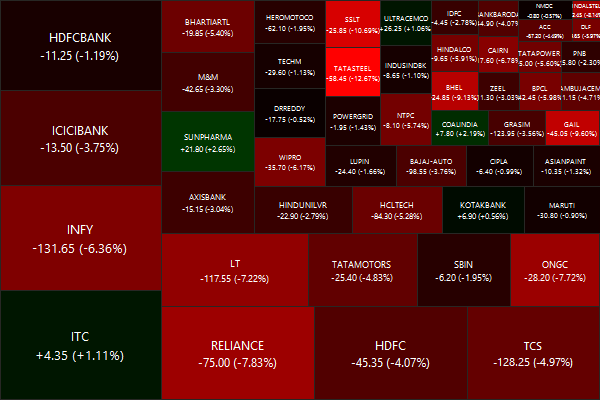
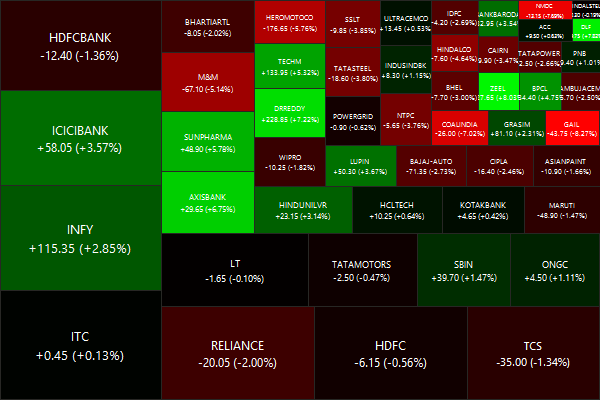
Top Winners and Losers
Broad based action saw a mix of winners and losers…
ETF Performance
| CPSEETF | +3.32% |
| BANKBEES | +0.98% |
| INFRABEES | +0.54% |
| NIFTYBEES | -0.03% |
| JUNIORBEES | -0.22% |
| GOLDBEES | -0.99% |
| PSUBNKBEES | -1.93% |
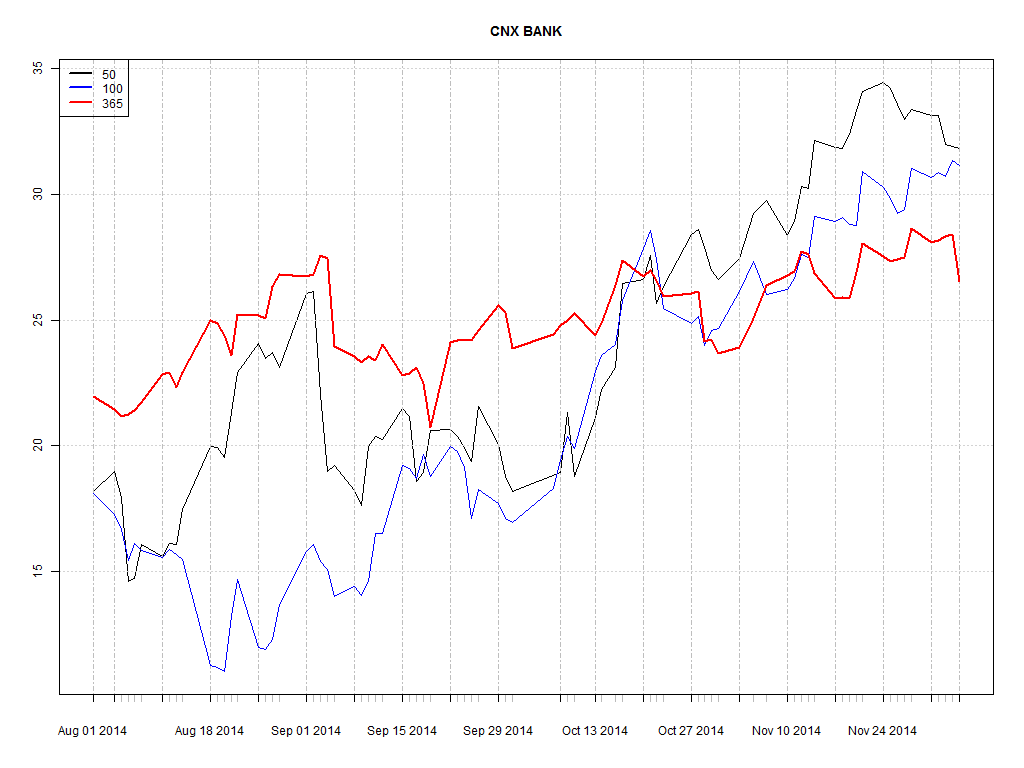
Banks withstood the onslaught well…
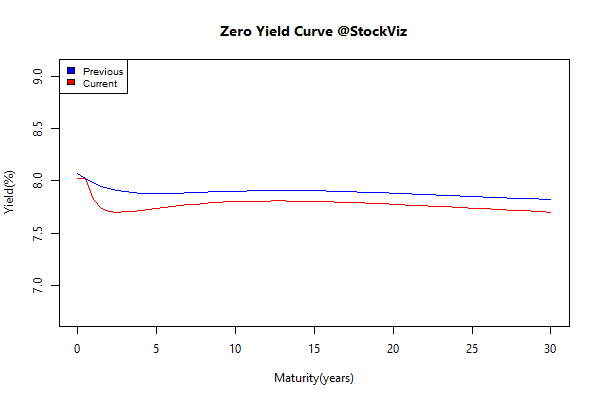
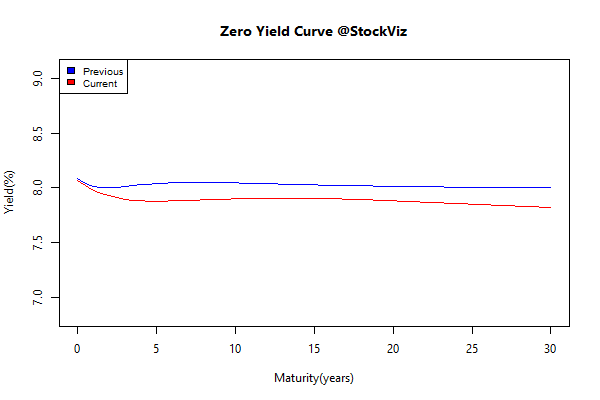
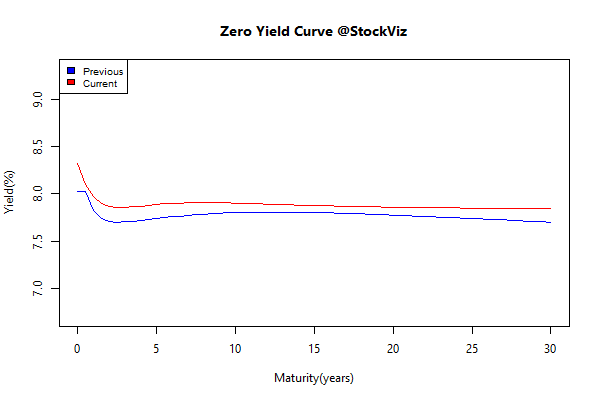
Yield Curve
Bond Indices
| Sub Index | Change in YTM | Total Return(%) |
|---|---|---|
| GSEC TB | +0.44 | +0.04% |
| GSEC SUB 1-3 | +0.43 | -0.43% |
| GSEC SUB 3-8 | +0.19 | -0.53% |
| GSEC SUB 8 | +0.08 | -0.34% |
Yields went up – breaking a long streak of falling rates.
Investment Theme Performance
| Auto | +1.48% |
| Market Fliers | +0.53% |
| Quality to Price | +0.49% |
| Refract: PPFAS Long Term Value Fund | +0.48% |
| Enterprise Yield | +0.18% |
| Momentum 200 | +0.09% |
| Momentum Long-Short | +0.00% |
| The Other Value | -0.03% |
| Financial Strength Value | -0.05% |
| Old Economy Value | -0.18% |
| Magic Formula Investing | -0.27% |
| Balance-sheet Strength | -0.32% |
| Piotroski ROC Small Caps | -0.72% |
| Industrial Value | -0.89% |
| Growth with Moat | -1.04% |
| Efficient Growth | -2.02% |
| CNX 100 50-Day Tactical | -2.28% |
| Market Elephants | -2.30% |
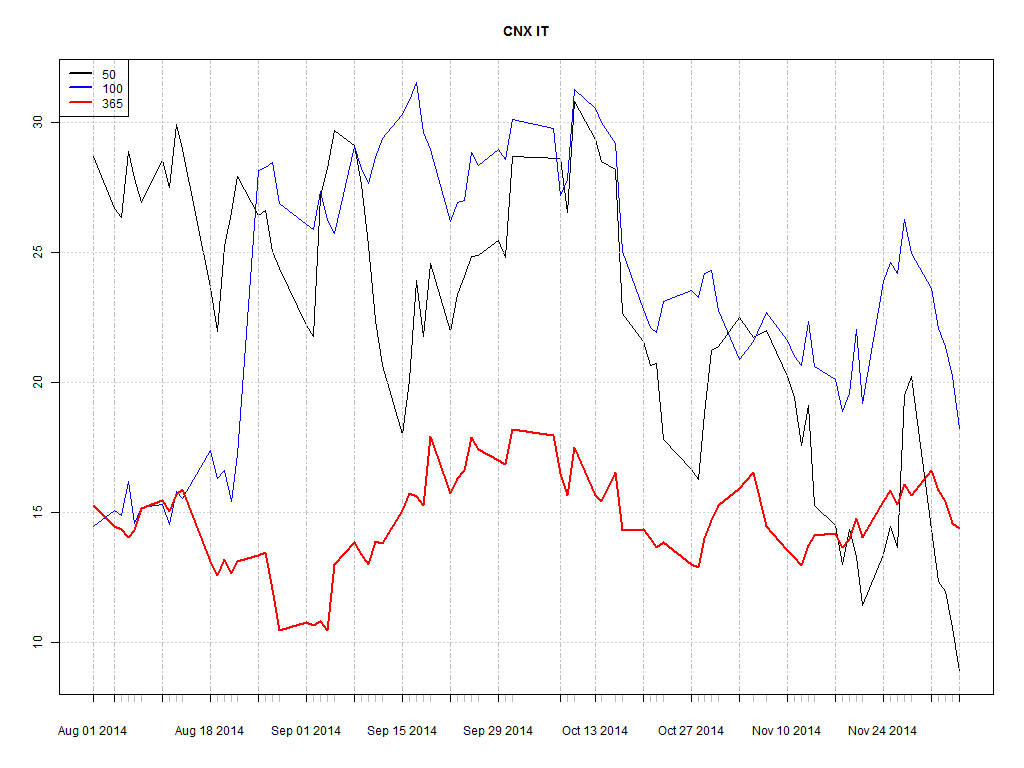
| IT 3rd Benchers | -2.31% |
| ADAG Mania | -5.78% |
Time to average in?
Thought for the weekend
Asset managers and asset owners have a relationship beset with natural conflicts.
- Asset owners want fees below 10 bps; asset managers prefer “2% + 20%.”
- Asset owners want transparency; asset managers favor black-box opacity.
- Asset owners want simplicity; asset managers hire rocket scientists to create complex optimized solutions for sex appeal.
- Asset owners want “future” outperformance after they fund a manager; asset managers would be satisfied with strong past outperformance to facilitate future asset gathering.
- Asset owners want a bigger alpha; asset managers would happily sell them the possibility of alpha and charge handsomely for the service of selling hope.
Source: The Promise of Smart Beta