tl;dr
You should not treat opening prices before and after October 18, 2010 the same.
Call Auction in the pre-open session
If you don’t know how the pre-open session works, here’s a good explainer from BSE:
When you run back-tests that use the opening price, this change will most likely trip you up.
Before and after
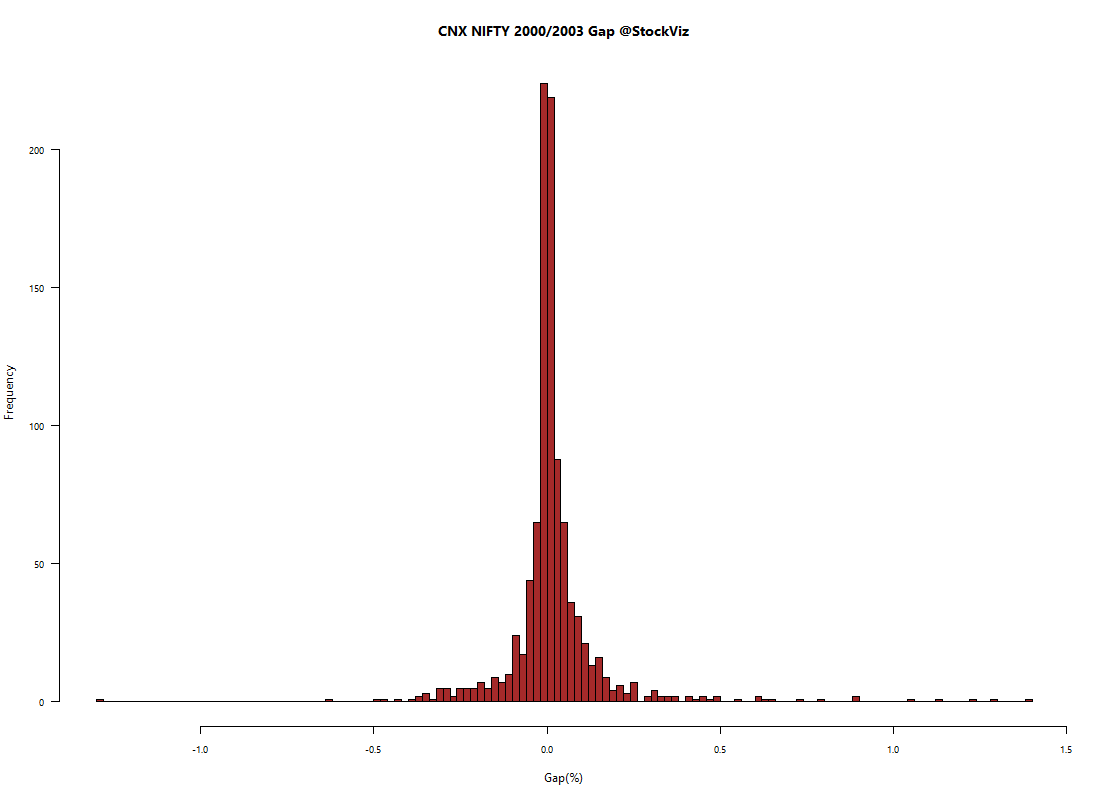
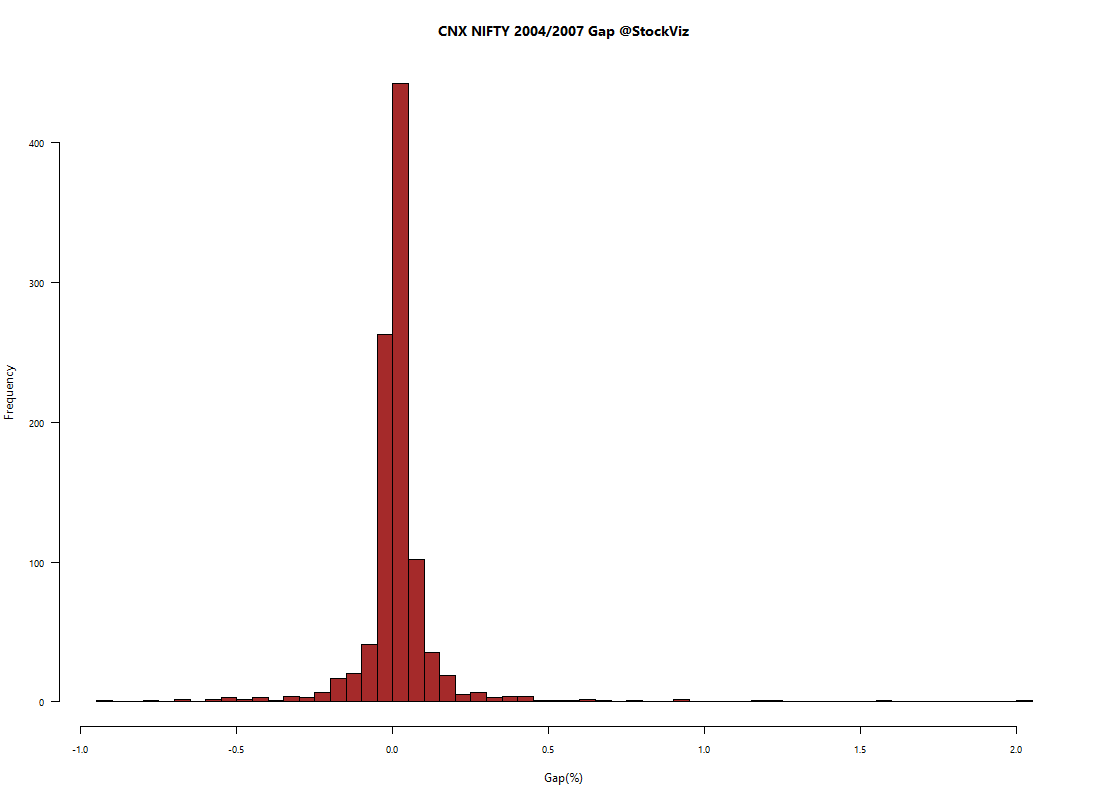
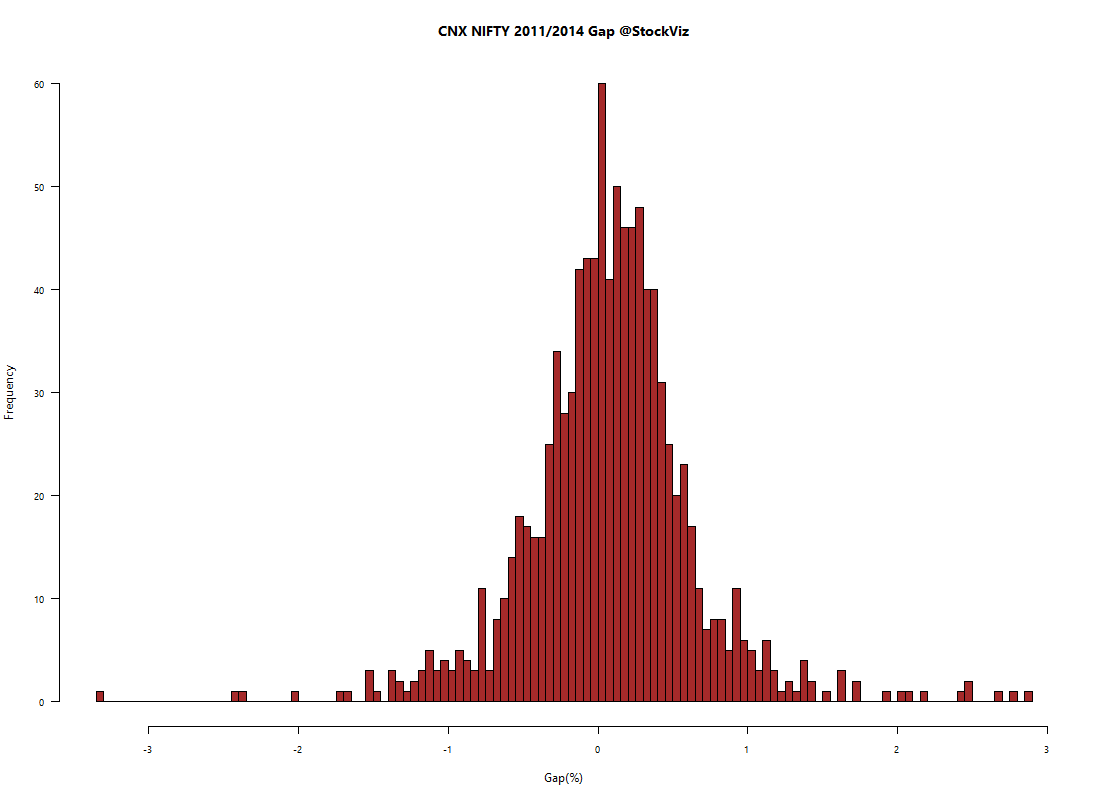
Nifty opening gaps since 2000:
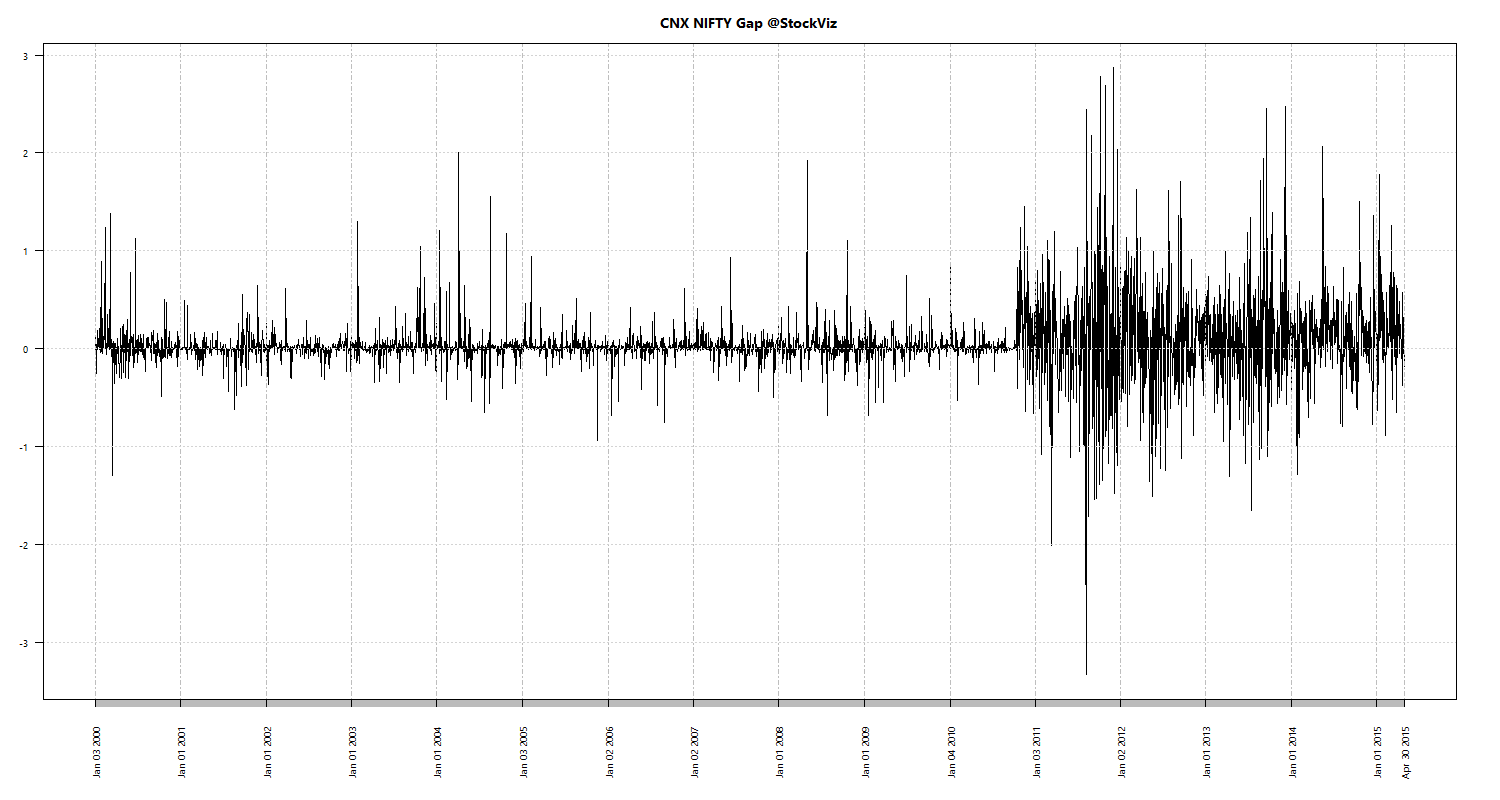
Notice the shift in the median before and after the auction was introduced (all figures in %):
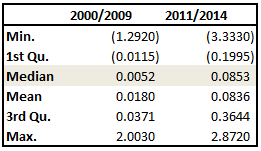
Before:
After:
Conclusion
One way to make the opening prices comparable is to take tick-level data and compute a synthetic opening price yourself, just like how the closing price in computed. And you can use this synthetic open across your entire data set.
Otherwise, you will have to take you back-test results with a healthy dose of skepticism and make sure that there is enough room in your analysis to account for this.