Our previous post explored the differences between CAPM Beta and Hamming distance. Think of Beta as a linear regression between two time-series and Hamming distance as the number of days when the direction of returns differed. The usefulness of the Euclidian distance for non-reverting timeseries is somewhere between the two.
Extending the previous example using HDFC and keeping everything else the same, here’s what the Euclidian distance measure looks like.
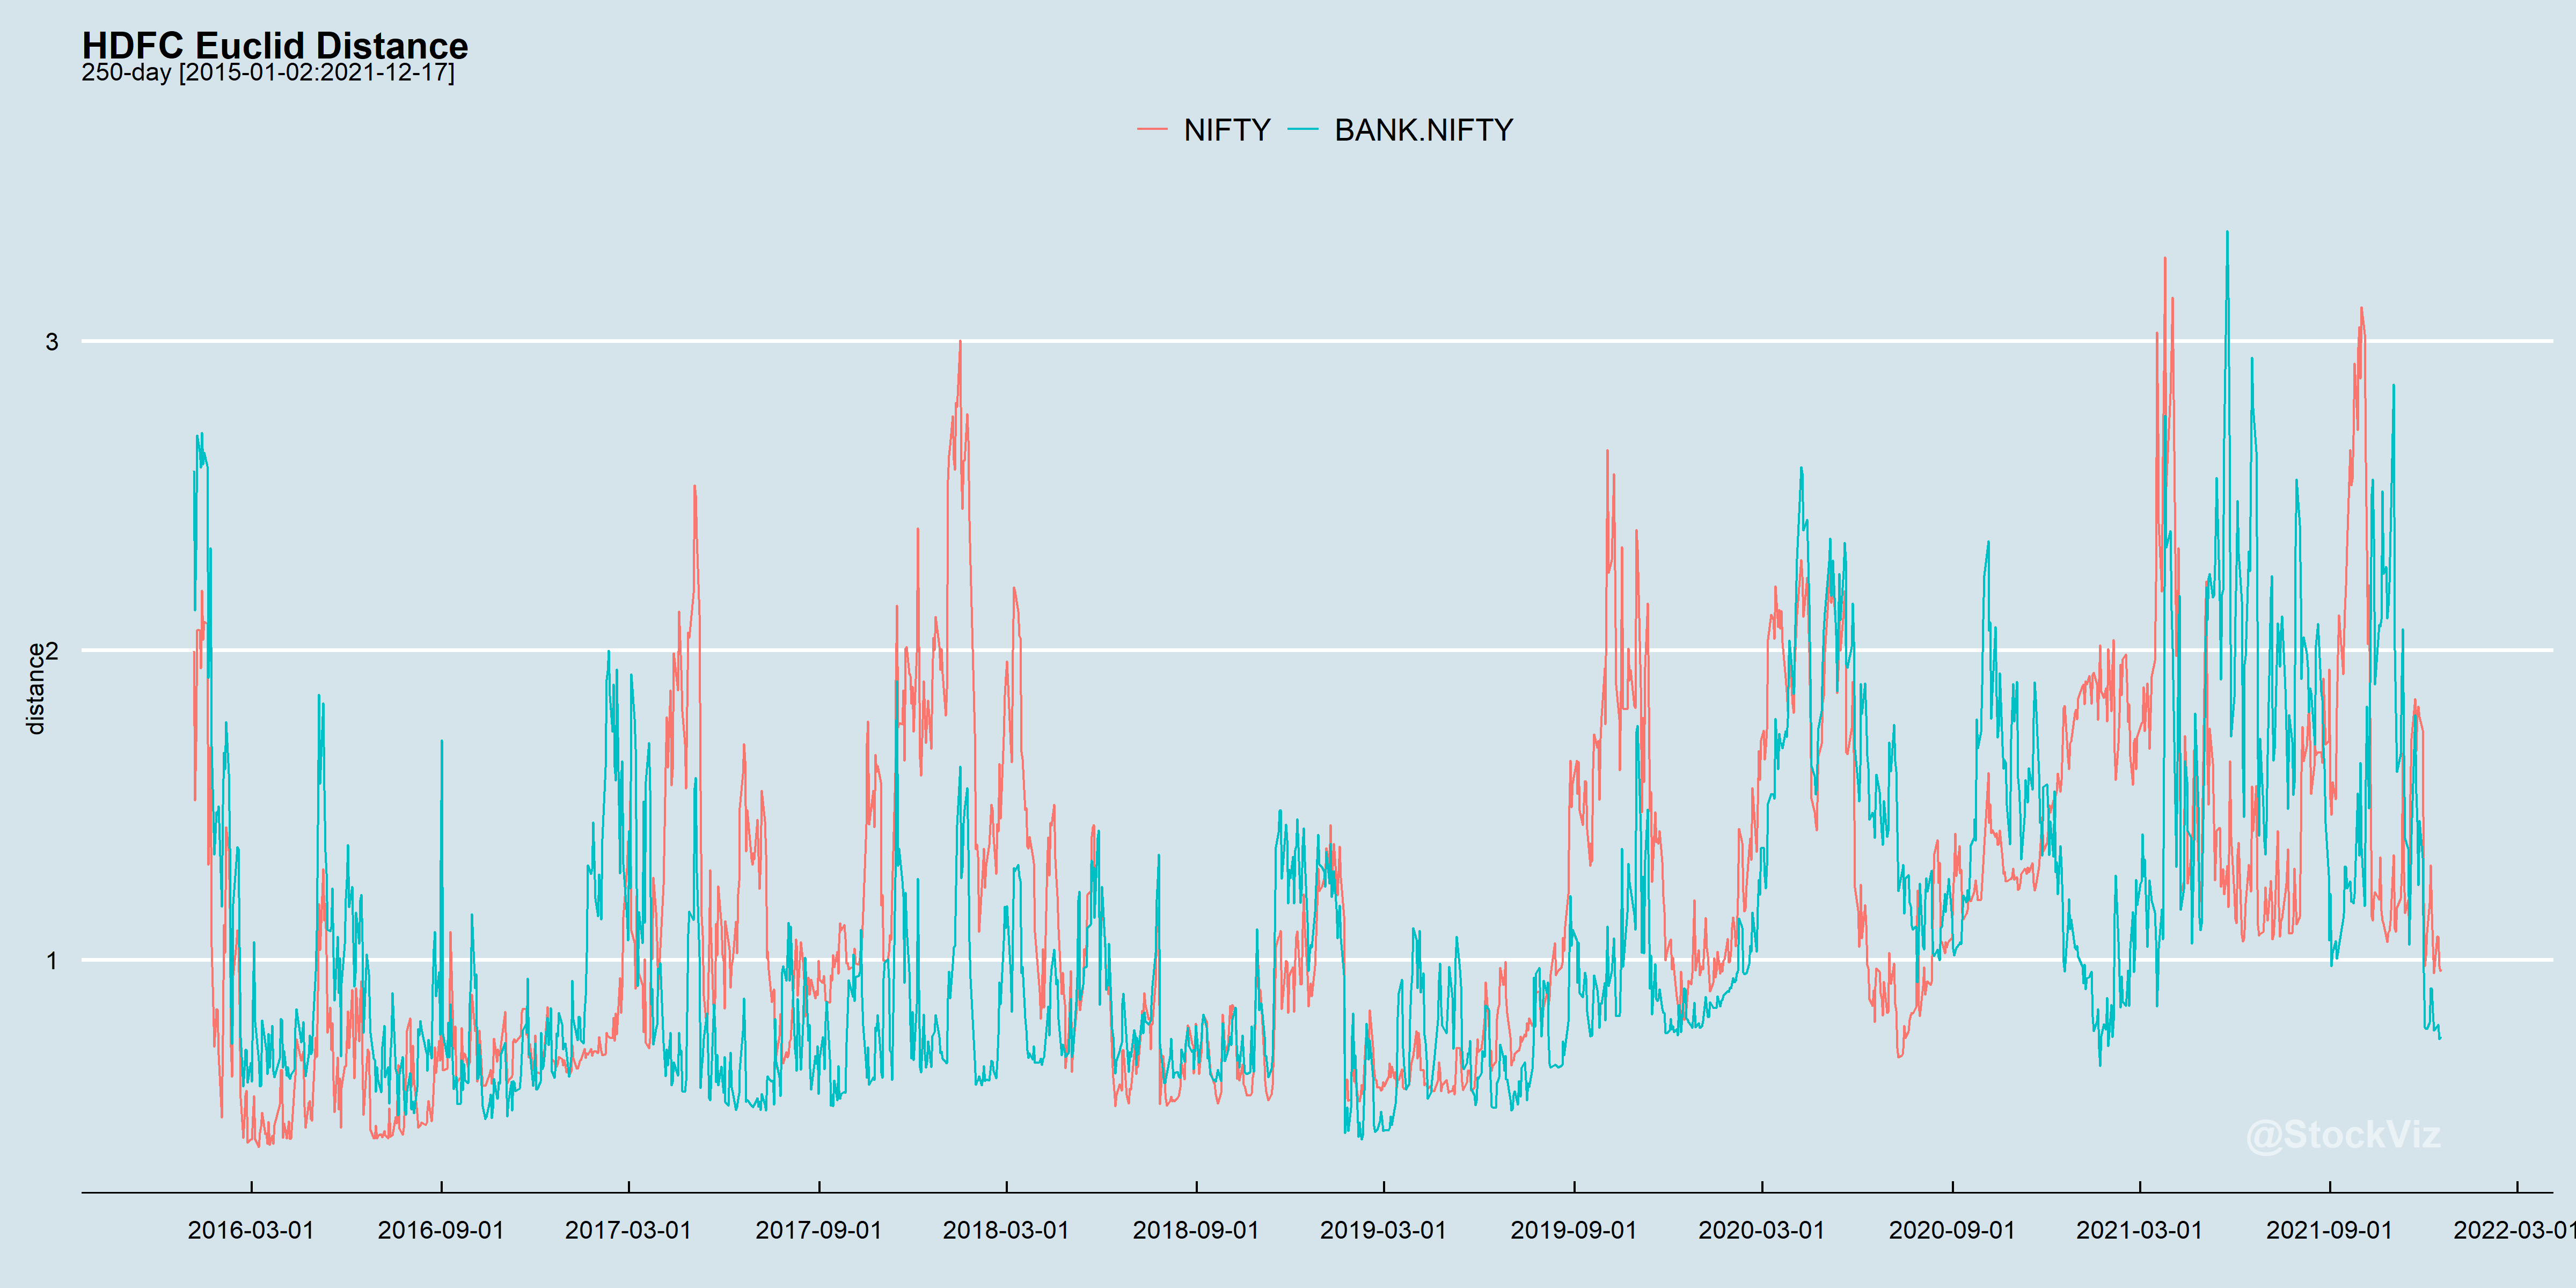
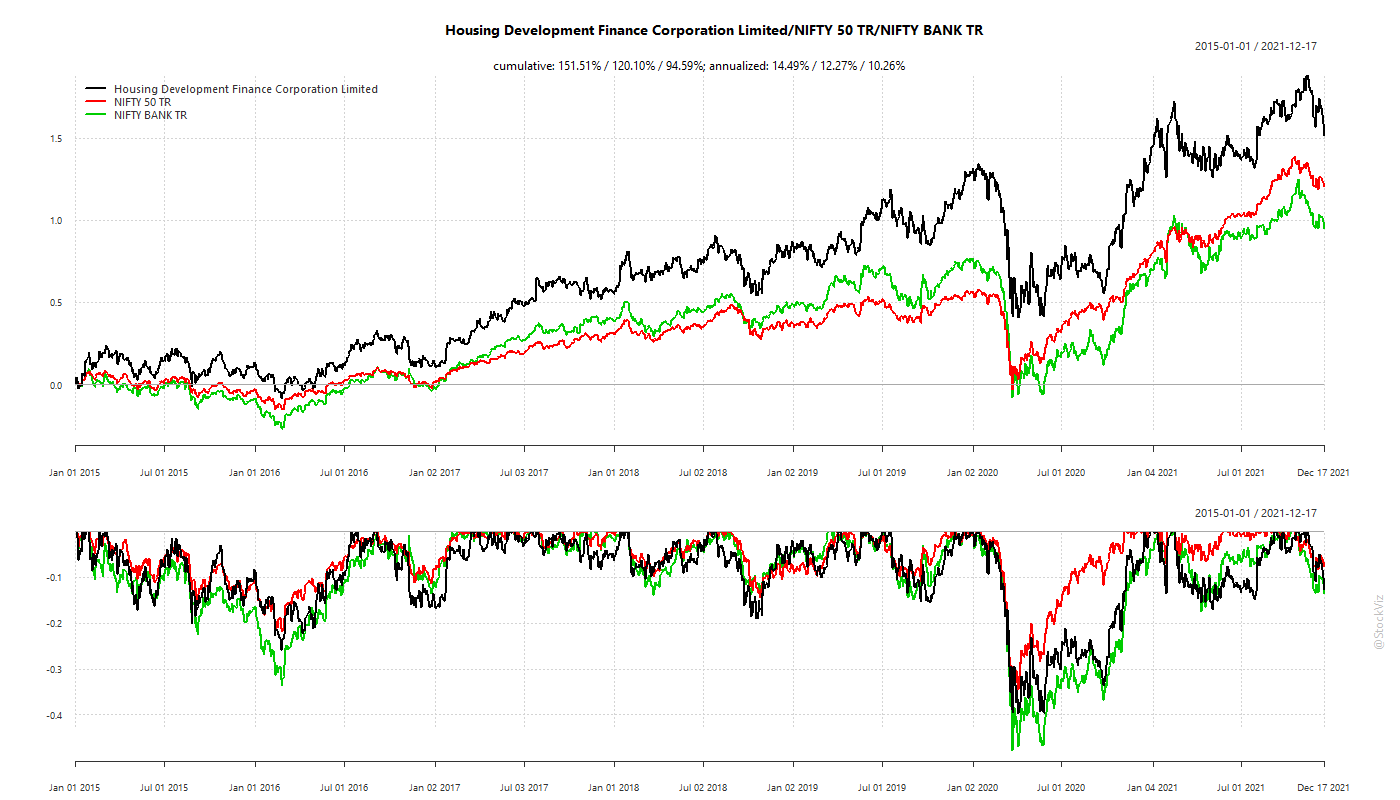
Higher the distance, the farther apart their curves and worse the index hedge. Here’s the equity curve that can help map returns to distance.
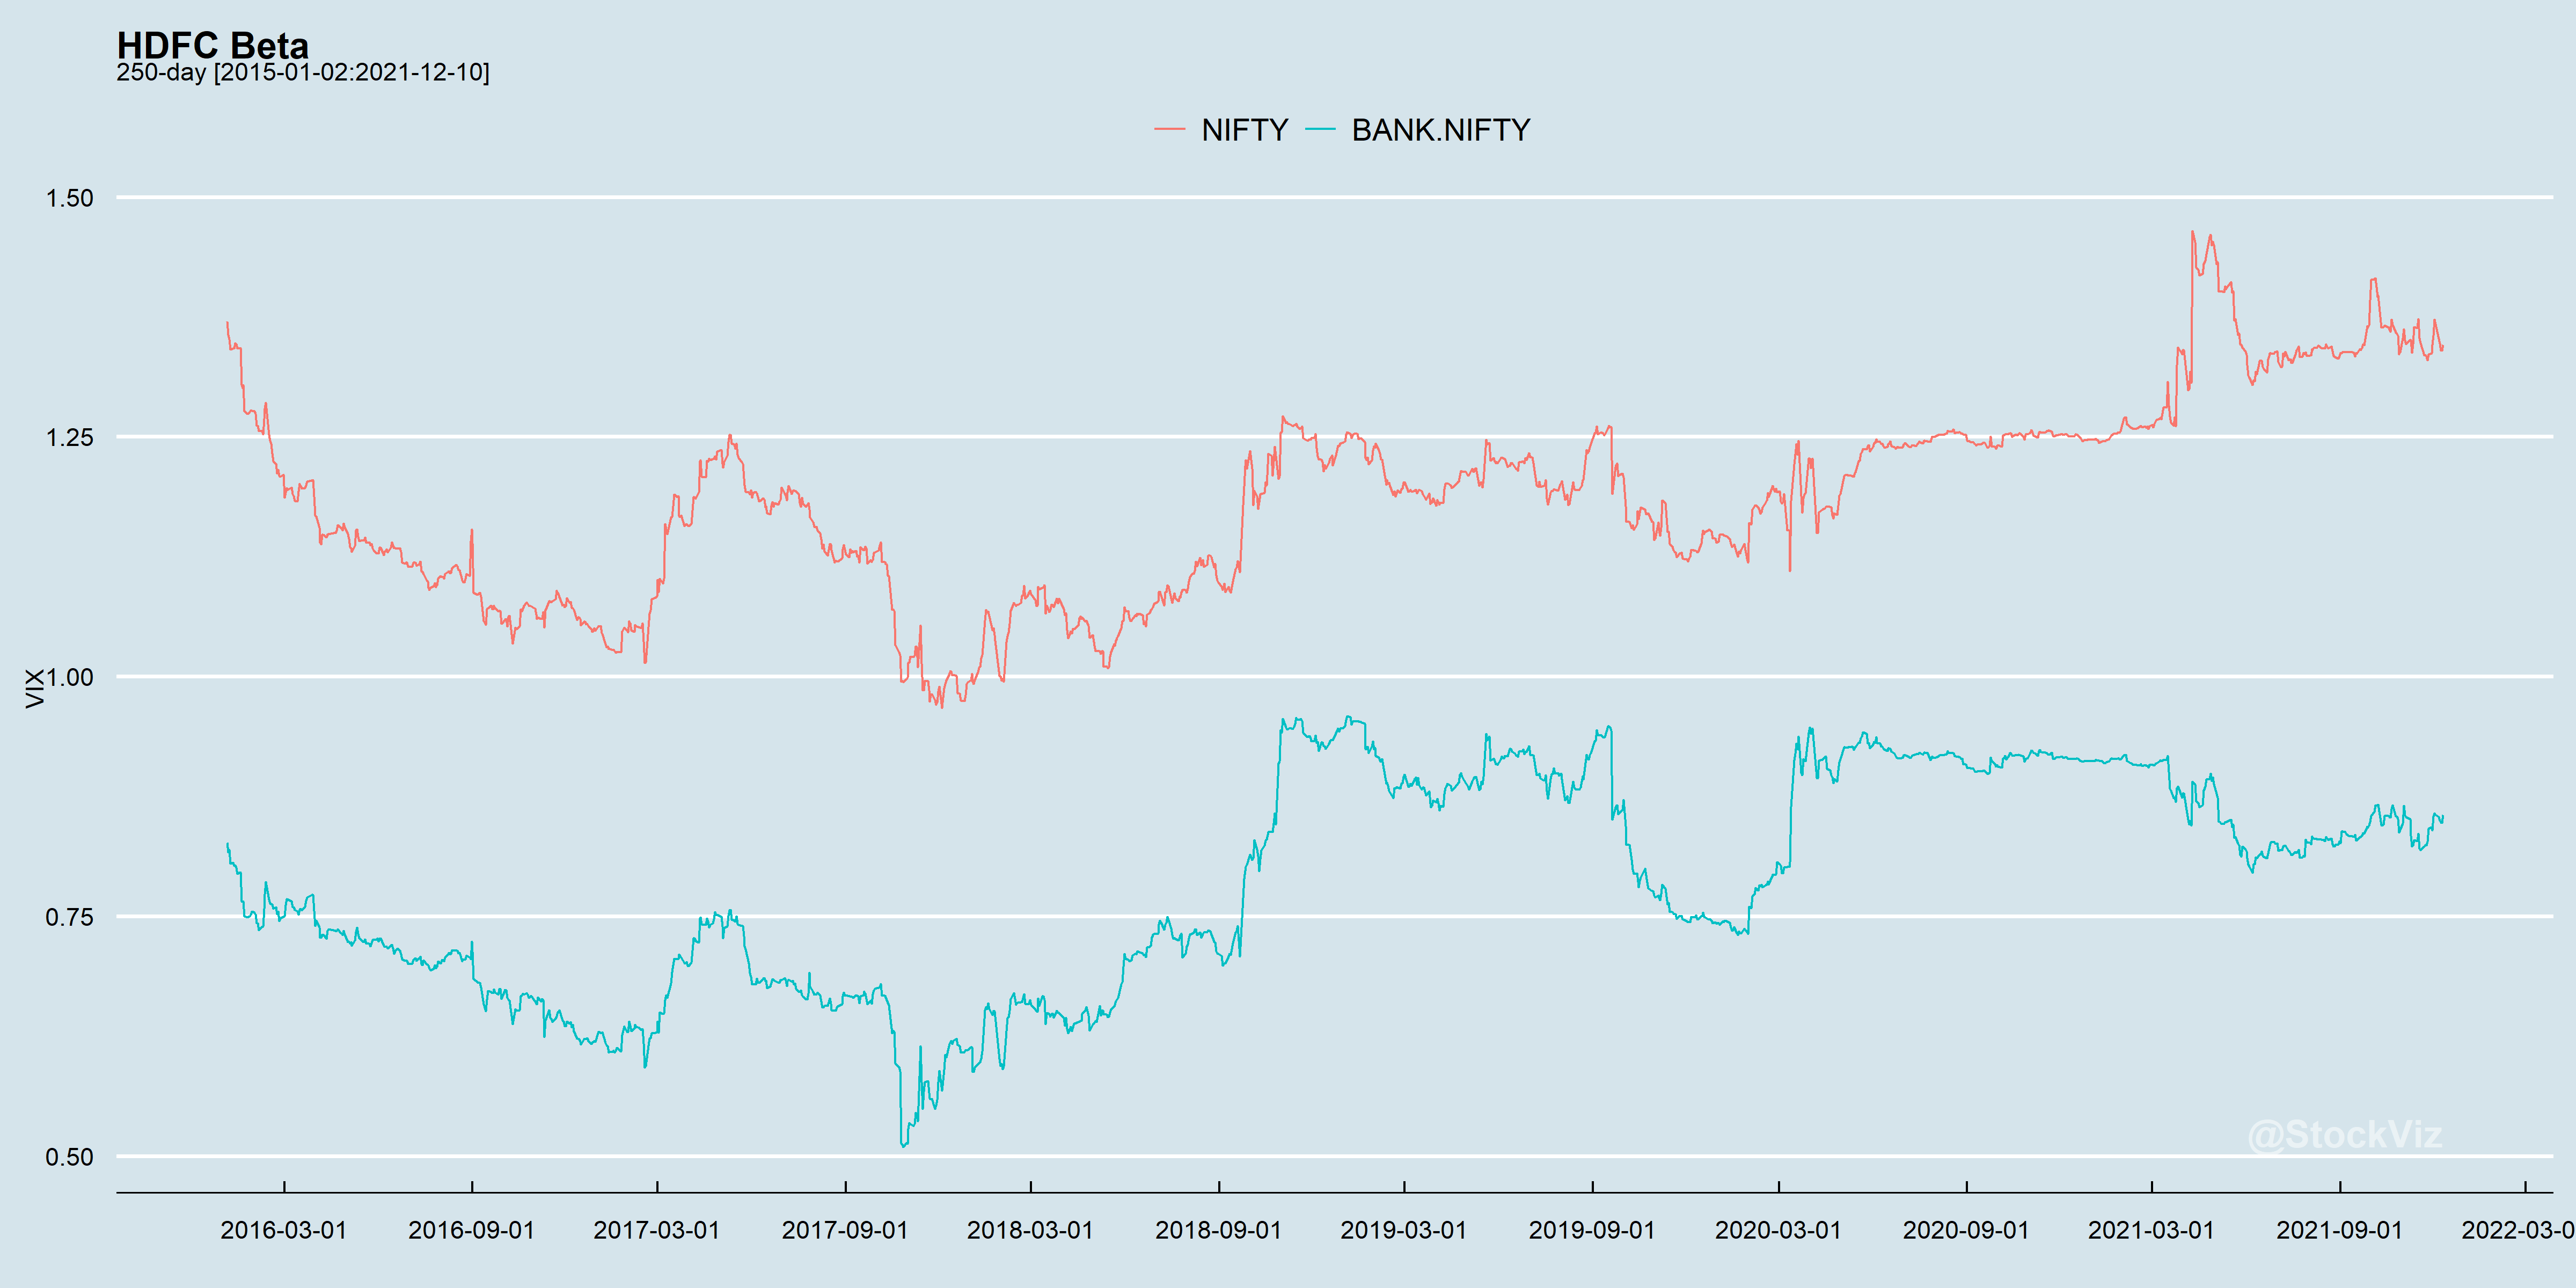
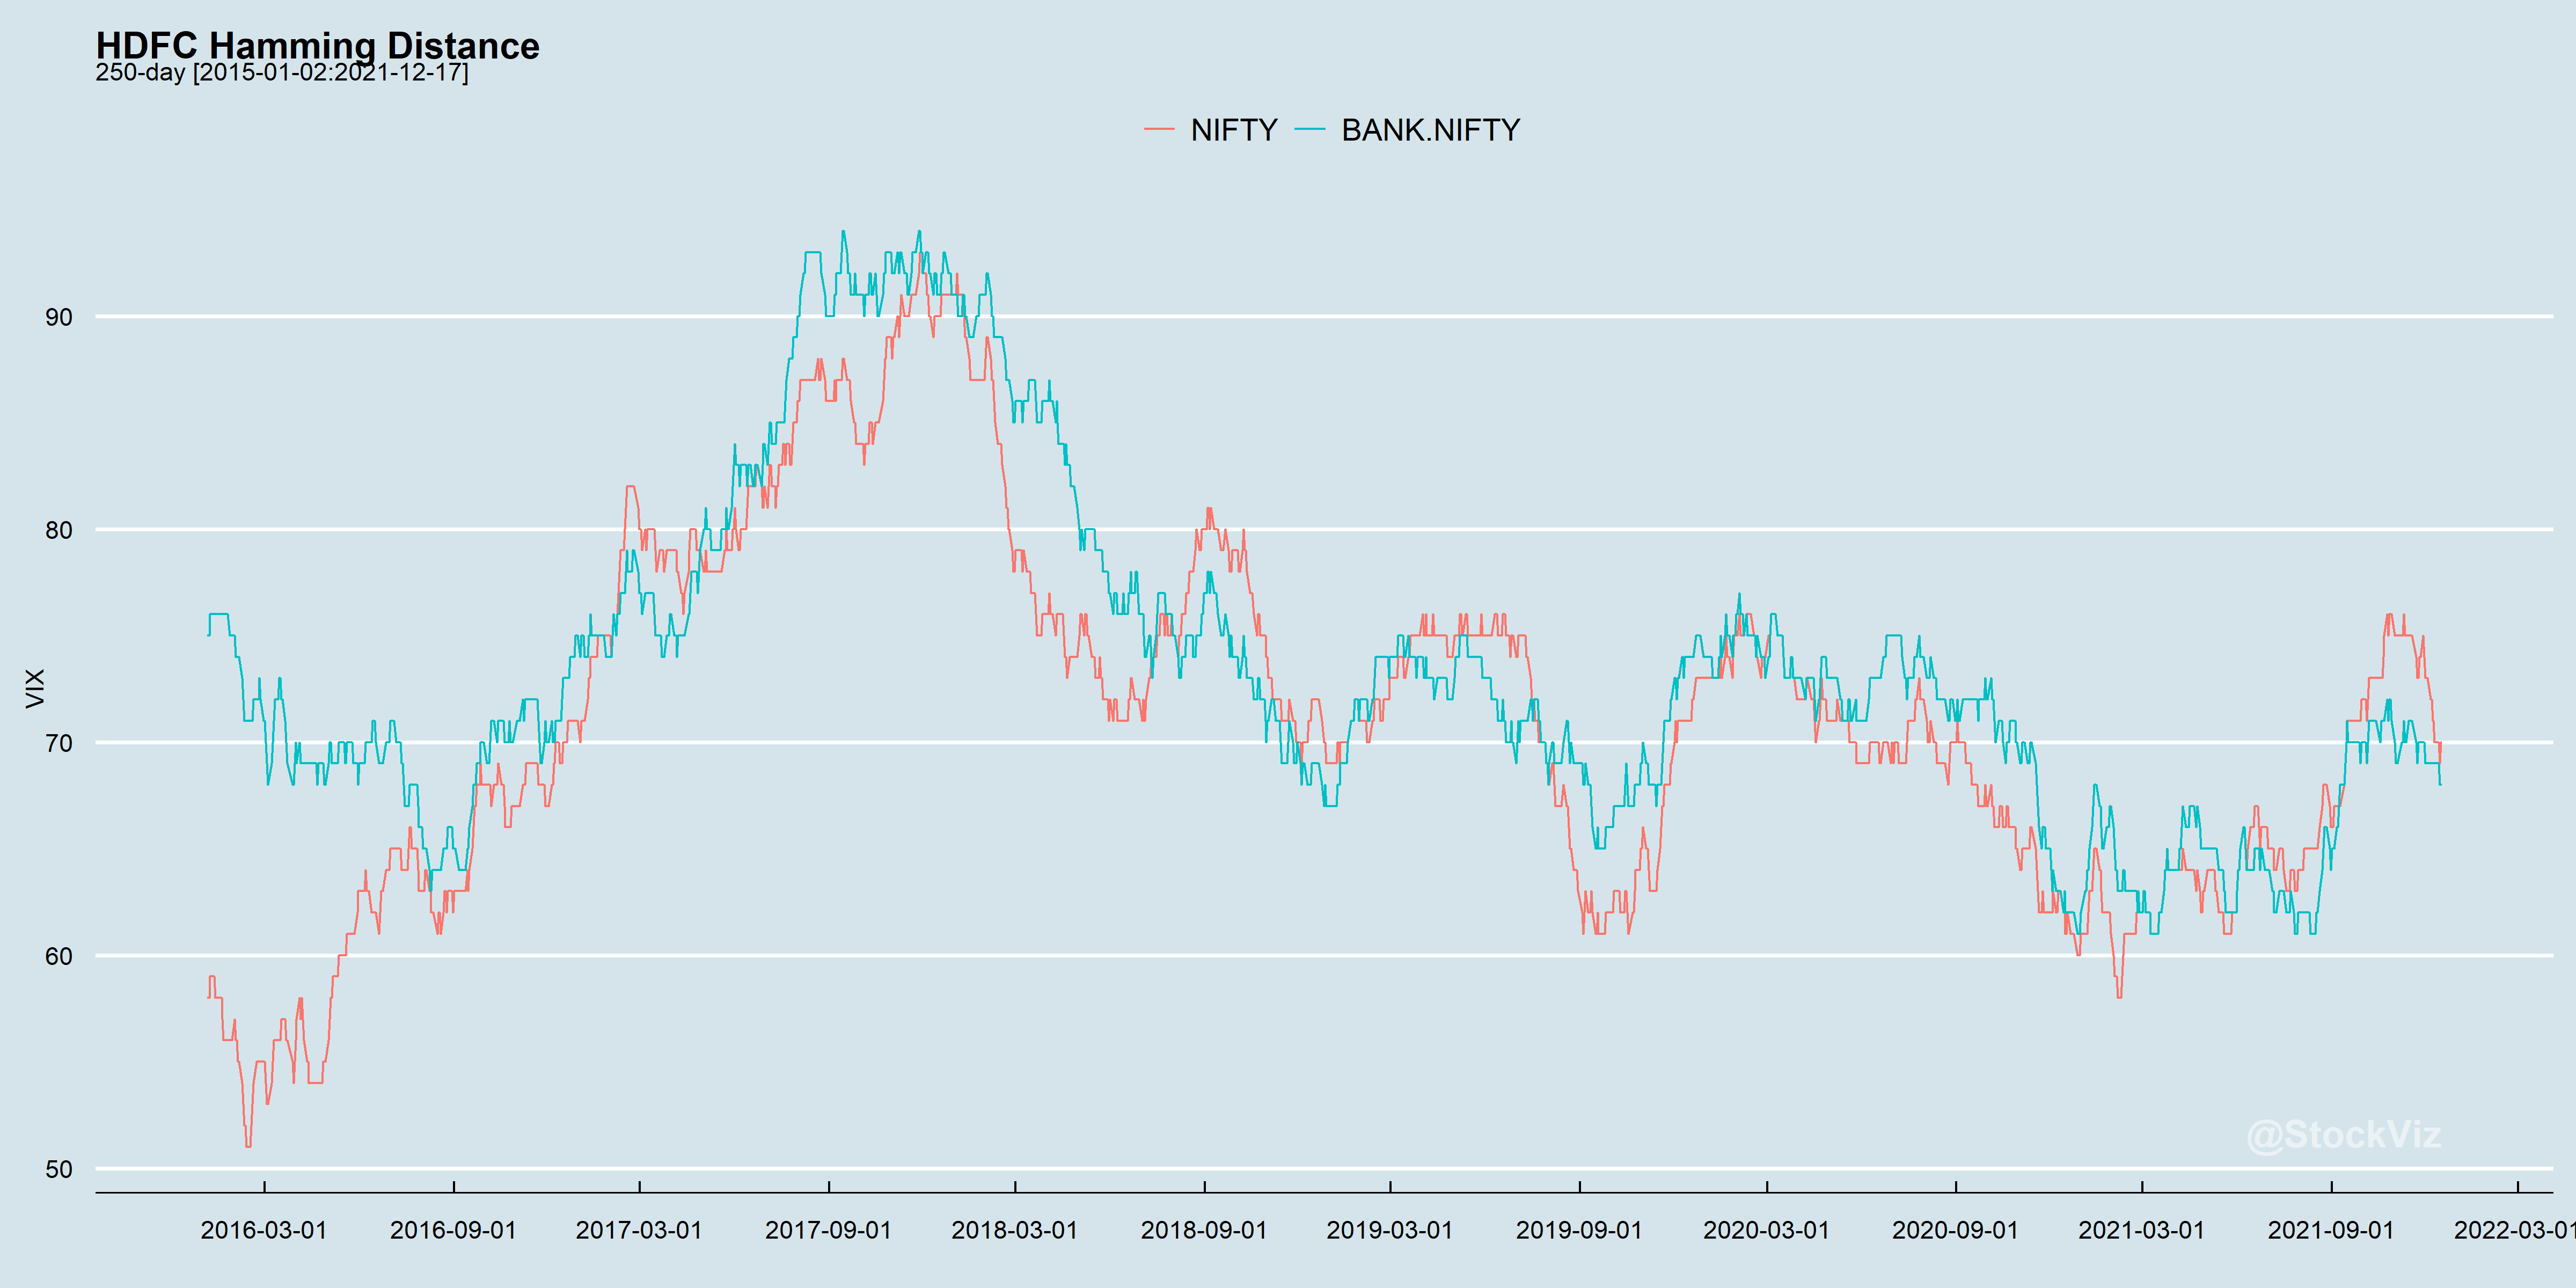
Reproducing the Beta and Hamming Distance charts:
From a linear portfolio point-of-view, which of these series is more “predictable?” Is it possible to specify bands beyond which things “break?” And does using shorter look-backs help?