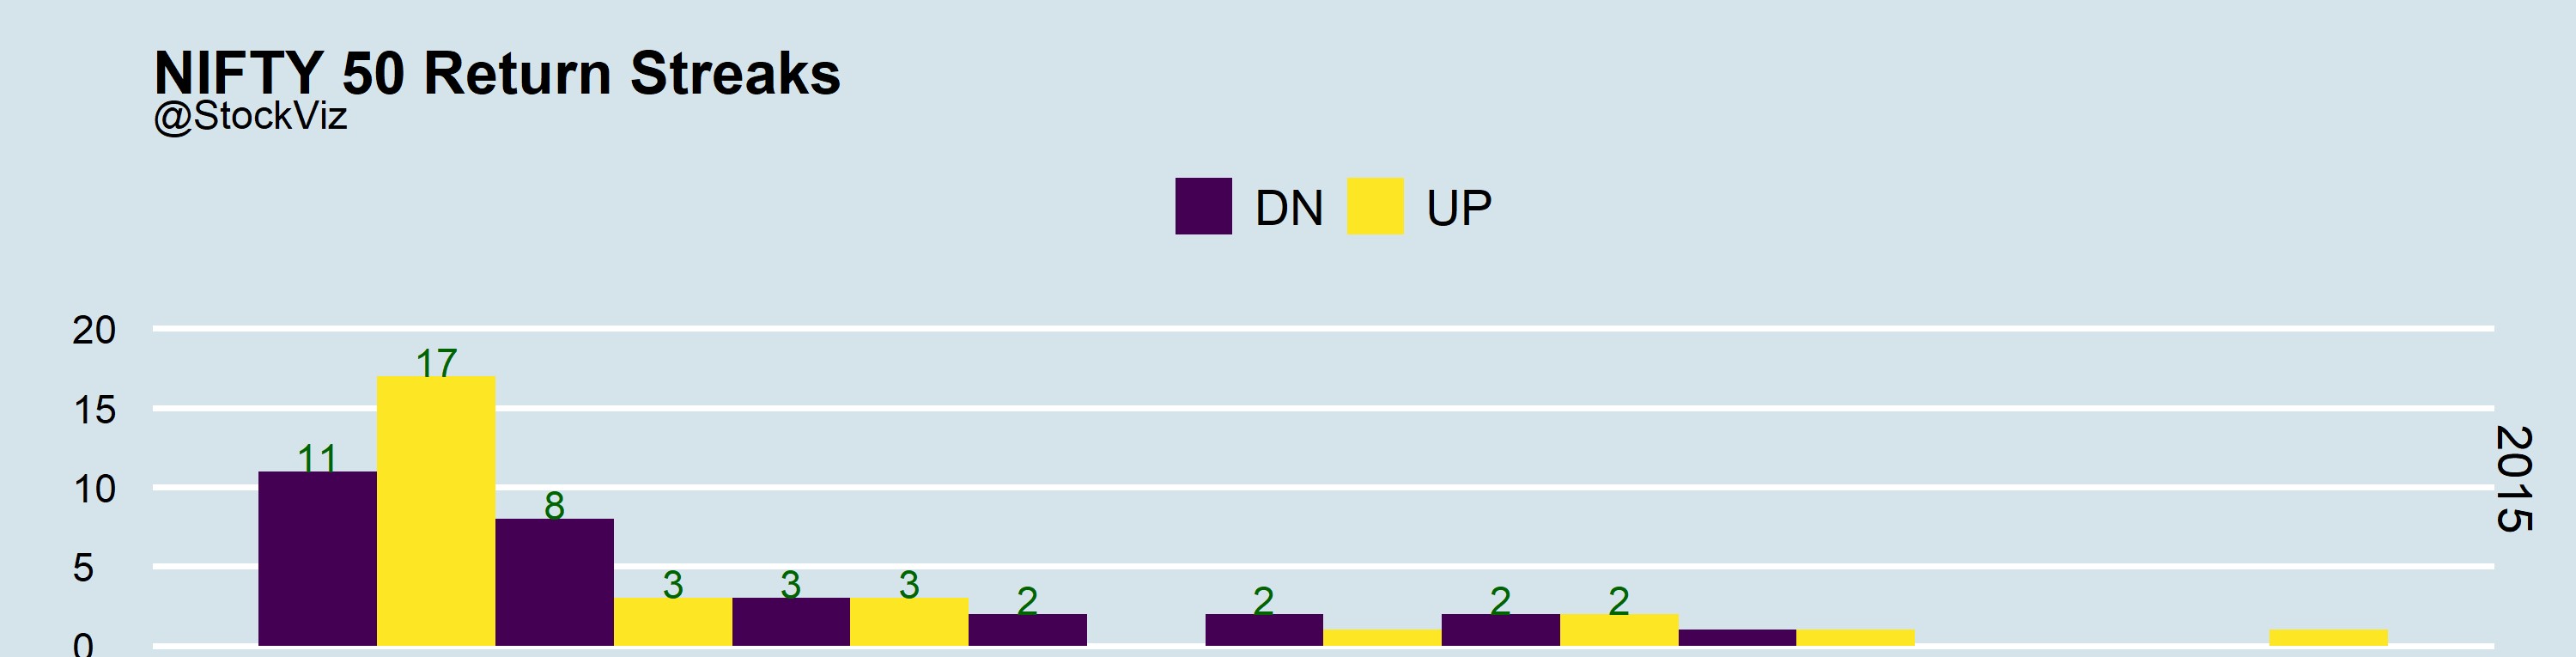
Autocorrelation represents the degree of similarity between a given time series and a lagged version of itself over successive time intervals. Our previous post on using run length encoding discussed how you can inspect the streakiness of returns. ACF allows you to inspect the relationship between day-0 and day-n returns.
Let’s have a look at the ACF of NIFTY and BANKNIFTY returns. Here is a plot of the ACFs of both real returns and up/down returns in 2015.
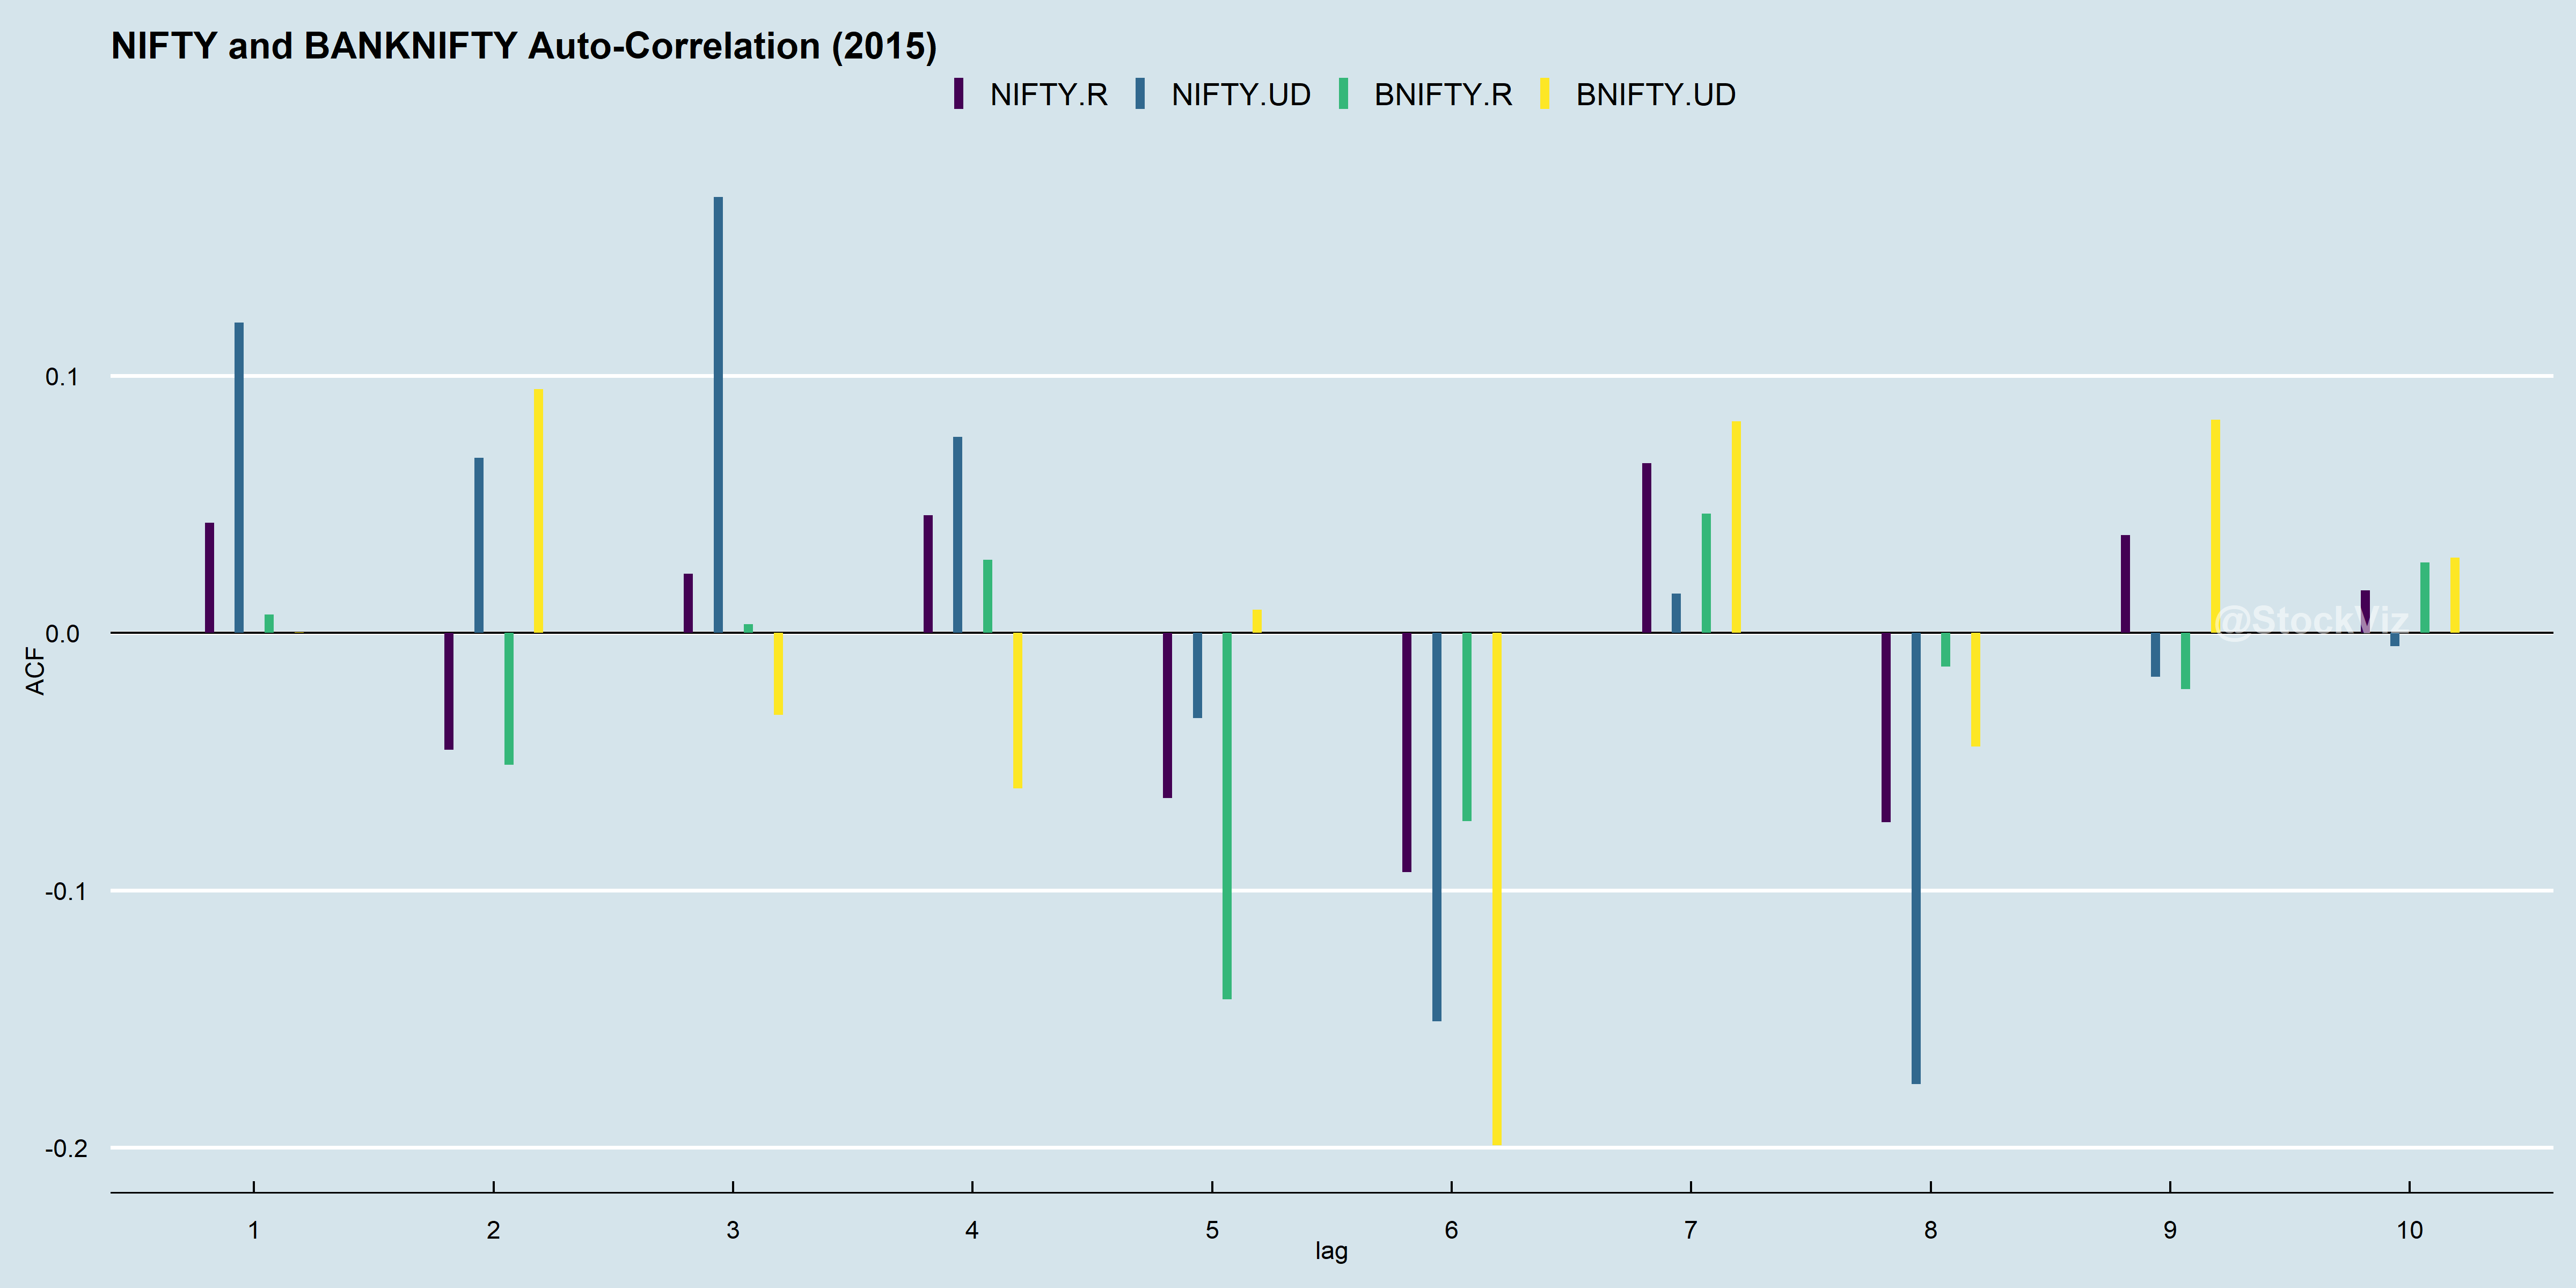
Zoom into the up/down ACF of NIFTY, see how day-0 direction correlates strongly to day-1, day-2 and day-3? Combine this with what we got from running an rle and you might just have a trend-following strategy.
Before we run off to make our millions, lets see how other years faired. Enter 2021.
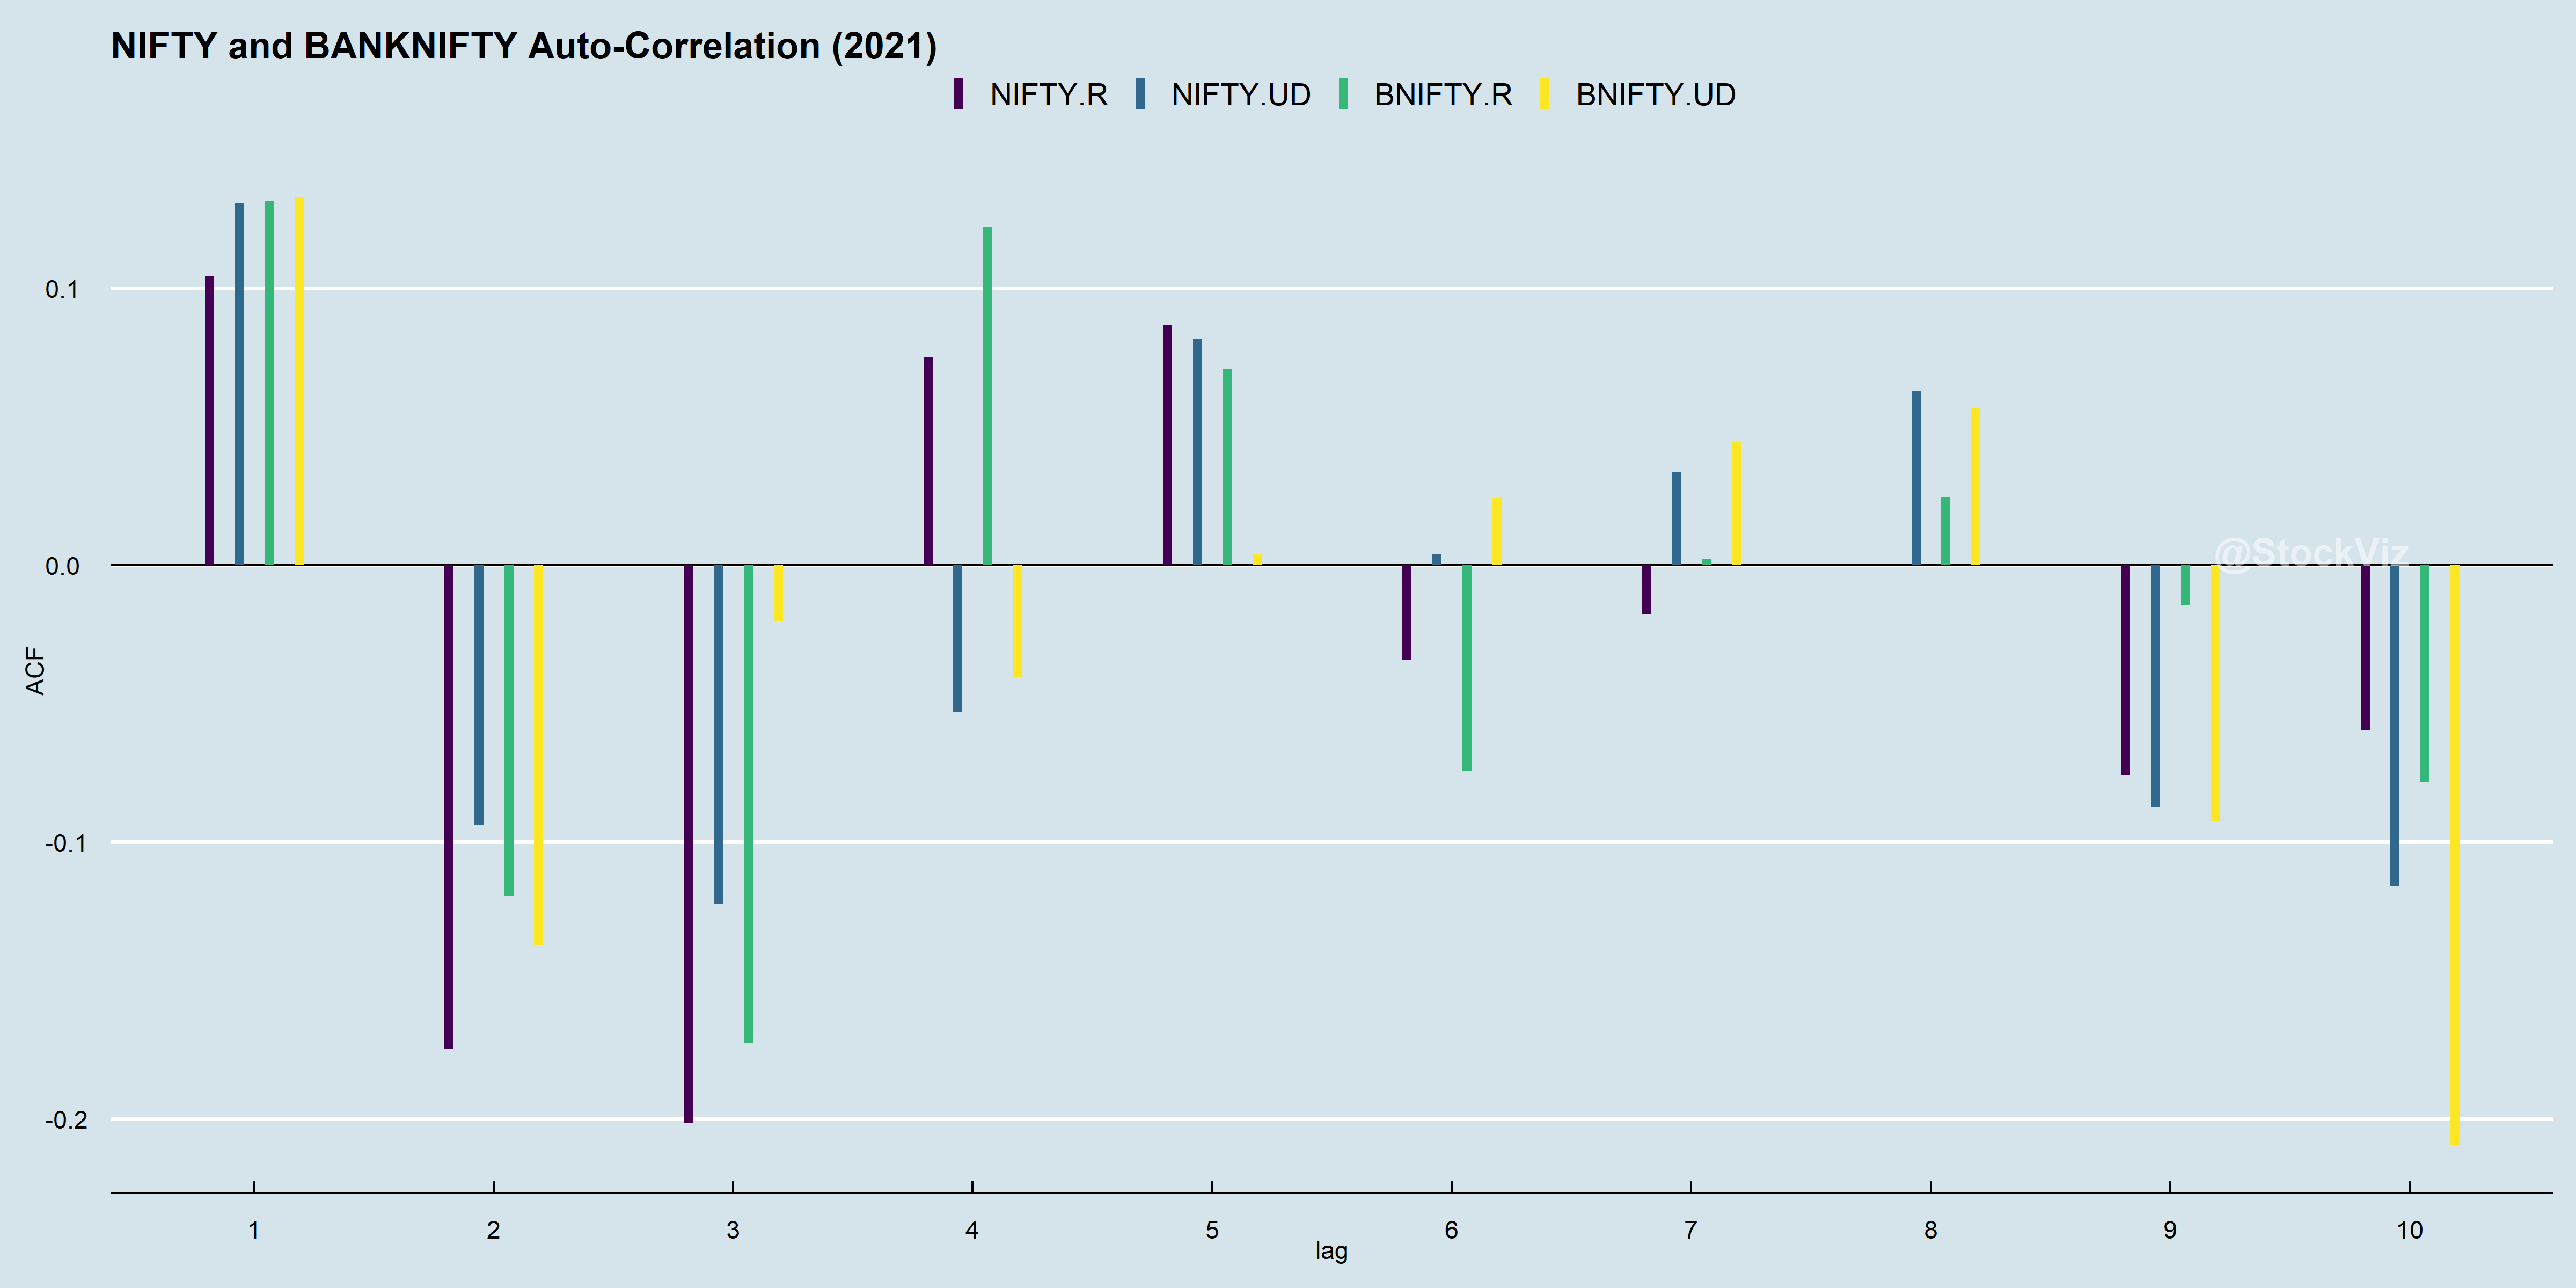
While NIFTY’s day-0 direction correlates strongly to day-1, it is the inverse of day-2’s and day-3’s. Did it become mean-reversion-y? One implication of this give-up is that a trend model tuned to work well with 2015 data is unlikely to repeat its performance in 2021.
However, ACFs from 2015 through 2021 have day-1 correlations as always positive. What if you just bet that an up day will be followed by another up day and vice versa?