State Street Global Advisors (SSGA) is known for its monster S&P 500 SPY ETF. With roughly $390 billion in AUM, SPY is one of the largest ETFs out there. Apart from SPY, they are also known for their SPDR “Spider” sector ETFs.
| SYMBOL | FUND | LAUNCH_YEAR |
| XLB | Materials Select Sector SPDR Fund | 1998 |
| XLE | Energy Select Sector SPDR Fund | 1998 |
| XLV | Health Care Select Sector SPDR Fund | 1998 |
| XLI | Industrial Select Sector SPDR Fund | 1998 |
| XLY | Consumer Discretionary Select Sector SPDR Fund | 1998 |
| XLP | Consumer Staples Select Sector SPDR Fund | 1998 |
| XLF | Financial Select Sector SPDR Fund | 1998 |
| XLU | Utilities Select Sector SPDR Fund | 1998 |
| XLK | Technology Select Sector SPDR Fund | 1998 |
| XLRE | Real Estate Select Sector SPDR Fund | 2015 |
| XLC | Communication Services Select Sector SPDR Fund | 2018 |
These ETFs allow investors to take a concentrated bet on a specific sector and are often used as a benchmark for professionals who specialize in those sectors.
Markets go through cycles where some sectors do well and some don’t. Some sectors are extremely volatile and some barely move.
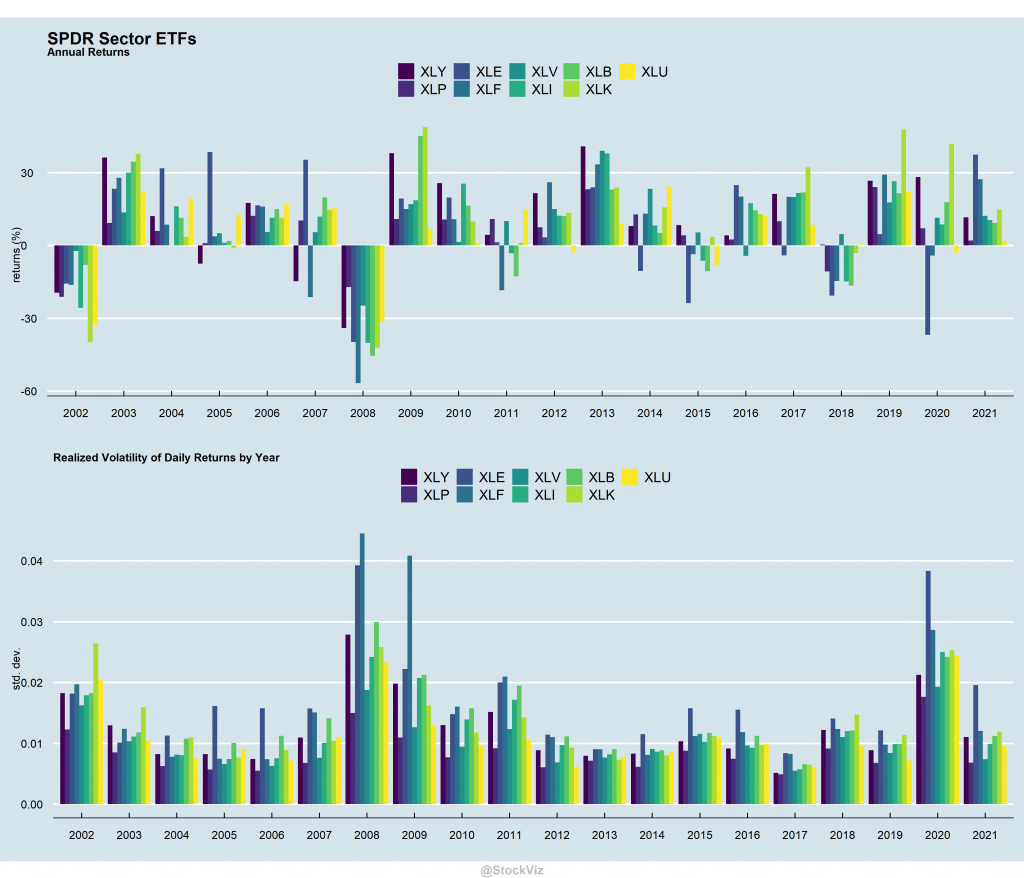
Cross-correlations are all over the place.
Given unstable cross-correlations and volatility, a naïve use of optimizers is a bad idea. For example, if you use these as inputs to generate an “efficient” portfolio, the weights wary widely from year to year.
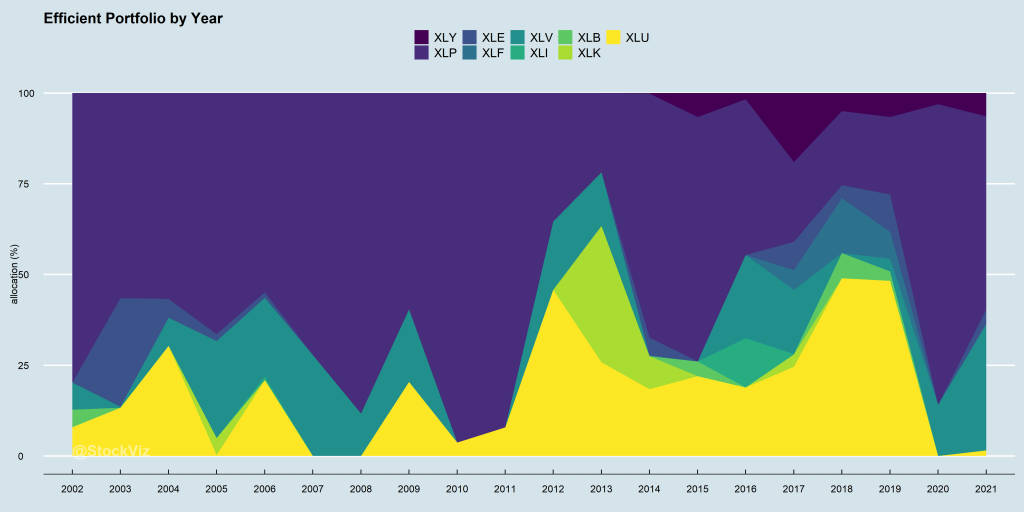
Consumer Staples (XLP) ends up gobbling up most of the allocation, followed by Utilities (XLU.) The performance of such a portfolio depends on what you are looking for.
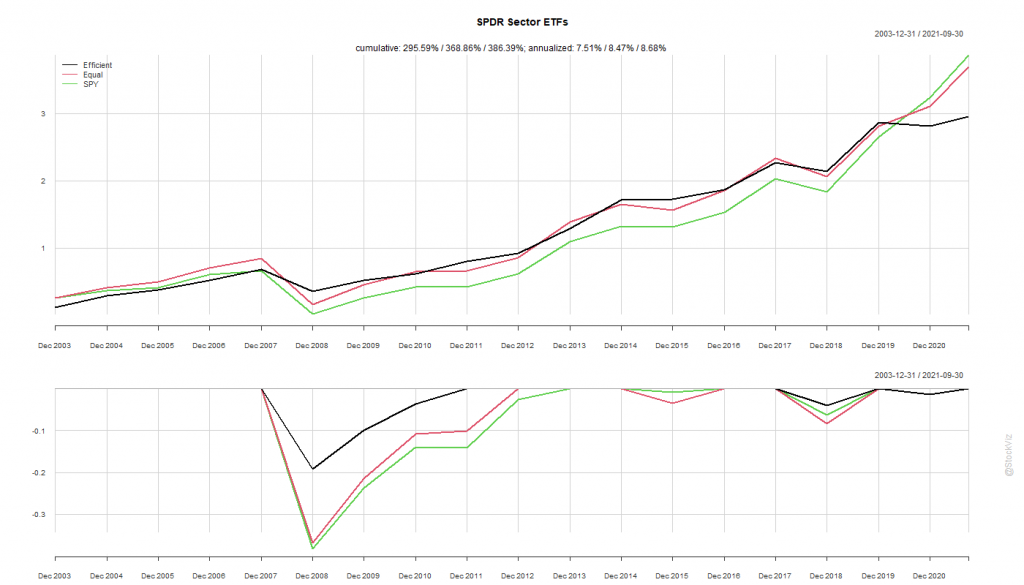
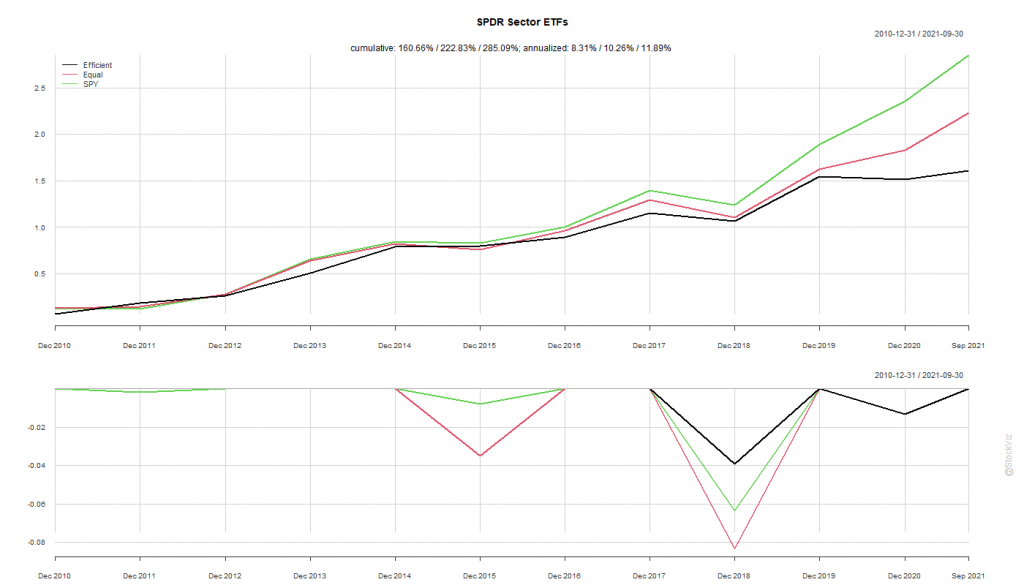
The efficient portfolio, given its large exposure to staples and utilities, has experienced lower drawdowns than both equity-weighted and S&P 500. This shows up in their Sharpe Ratios.

SPY remains the King when it comes to returns.