Most of us have learnt how to calculate the distance between 2 points on a plane in high school. The simplest one is called the Euclidean Distance – a pretty basic application of the Pythagorean Theorem. The concept can be extended to calculate the distance between to vectors. This is where it gets interesting.
Suppose you want to match a price series with another, ranking a rolling window by its Euclidean Distance is the fastest and simplest way of pattern matching.
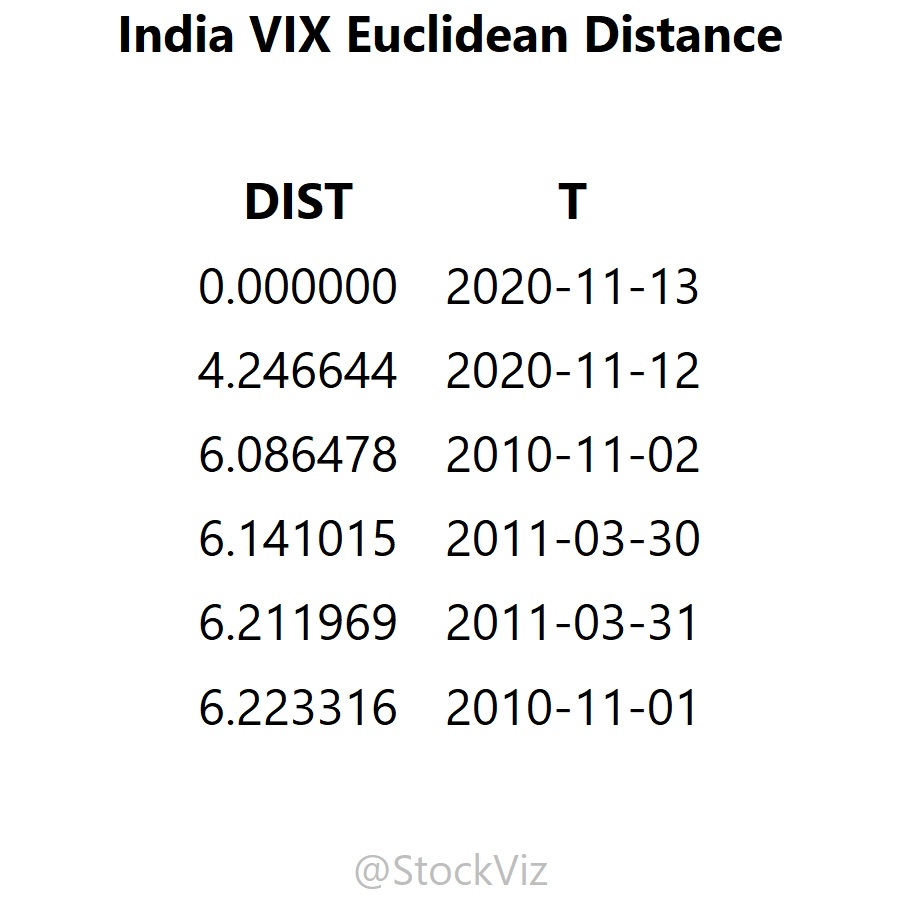
For example, take the most recent 20-day VIX time-series and “match” it with a rolling window of historical 20-day VIX segments and sort it by its Euclidean Distance (ED.)

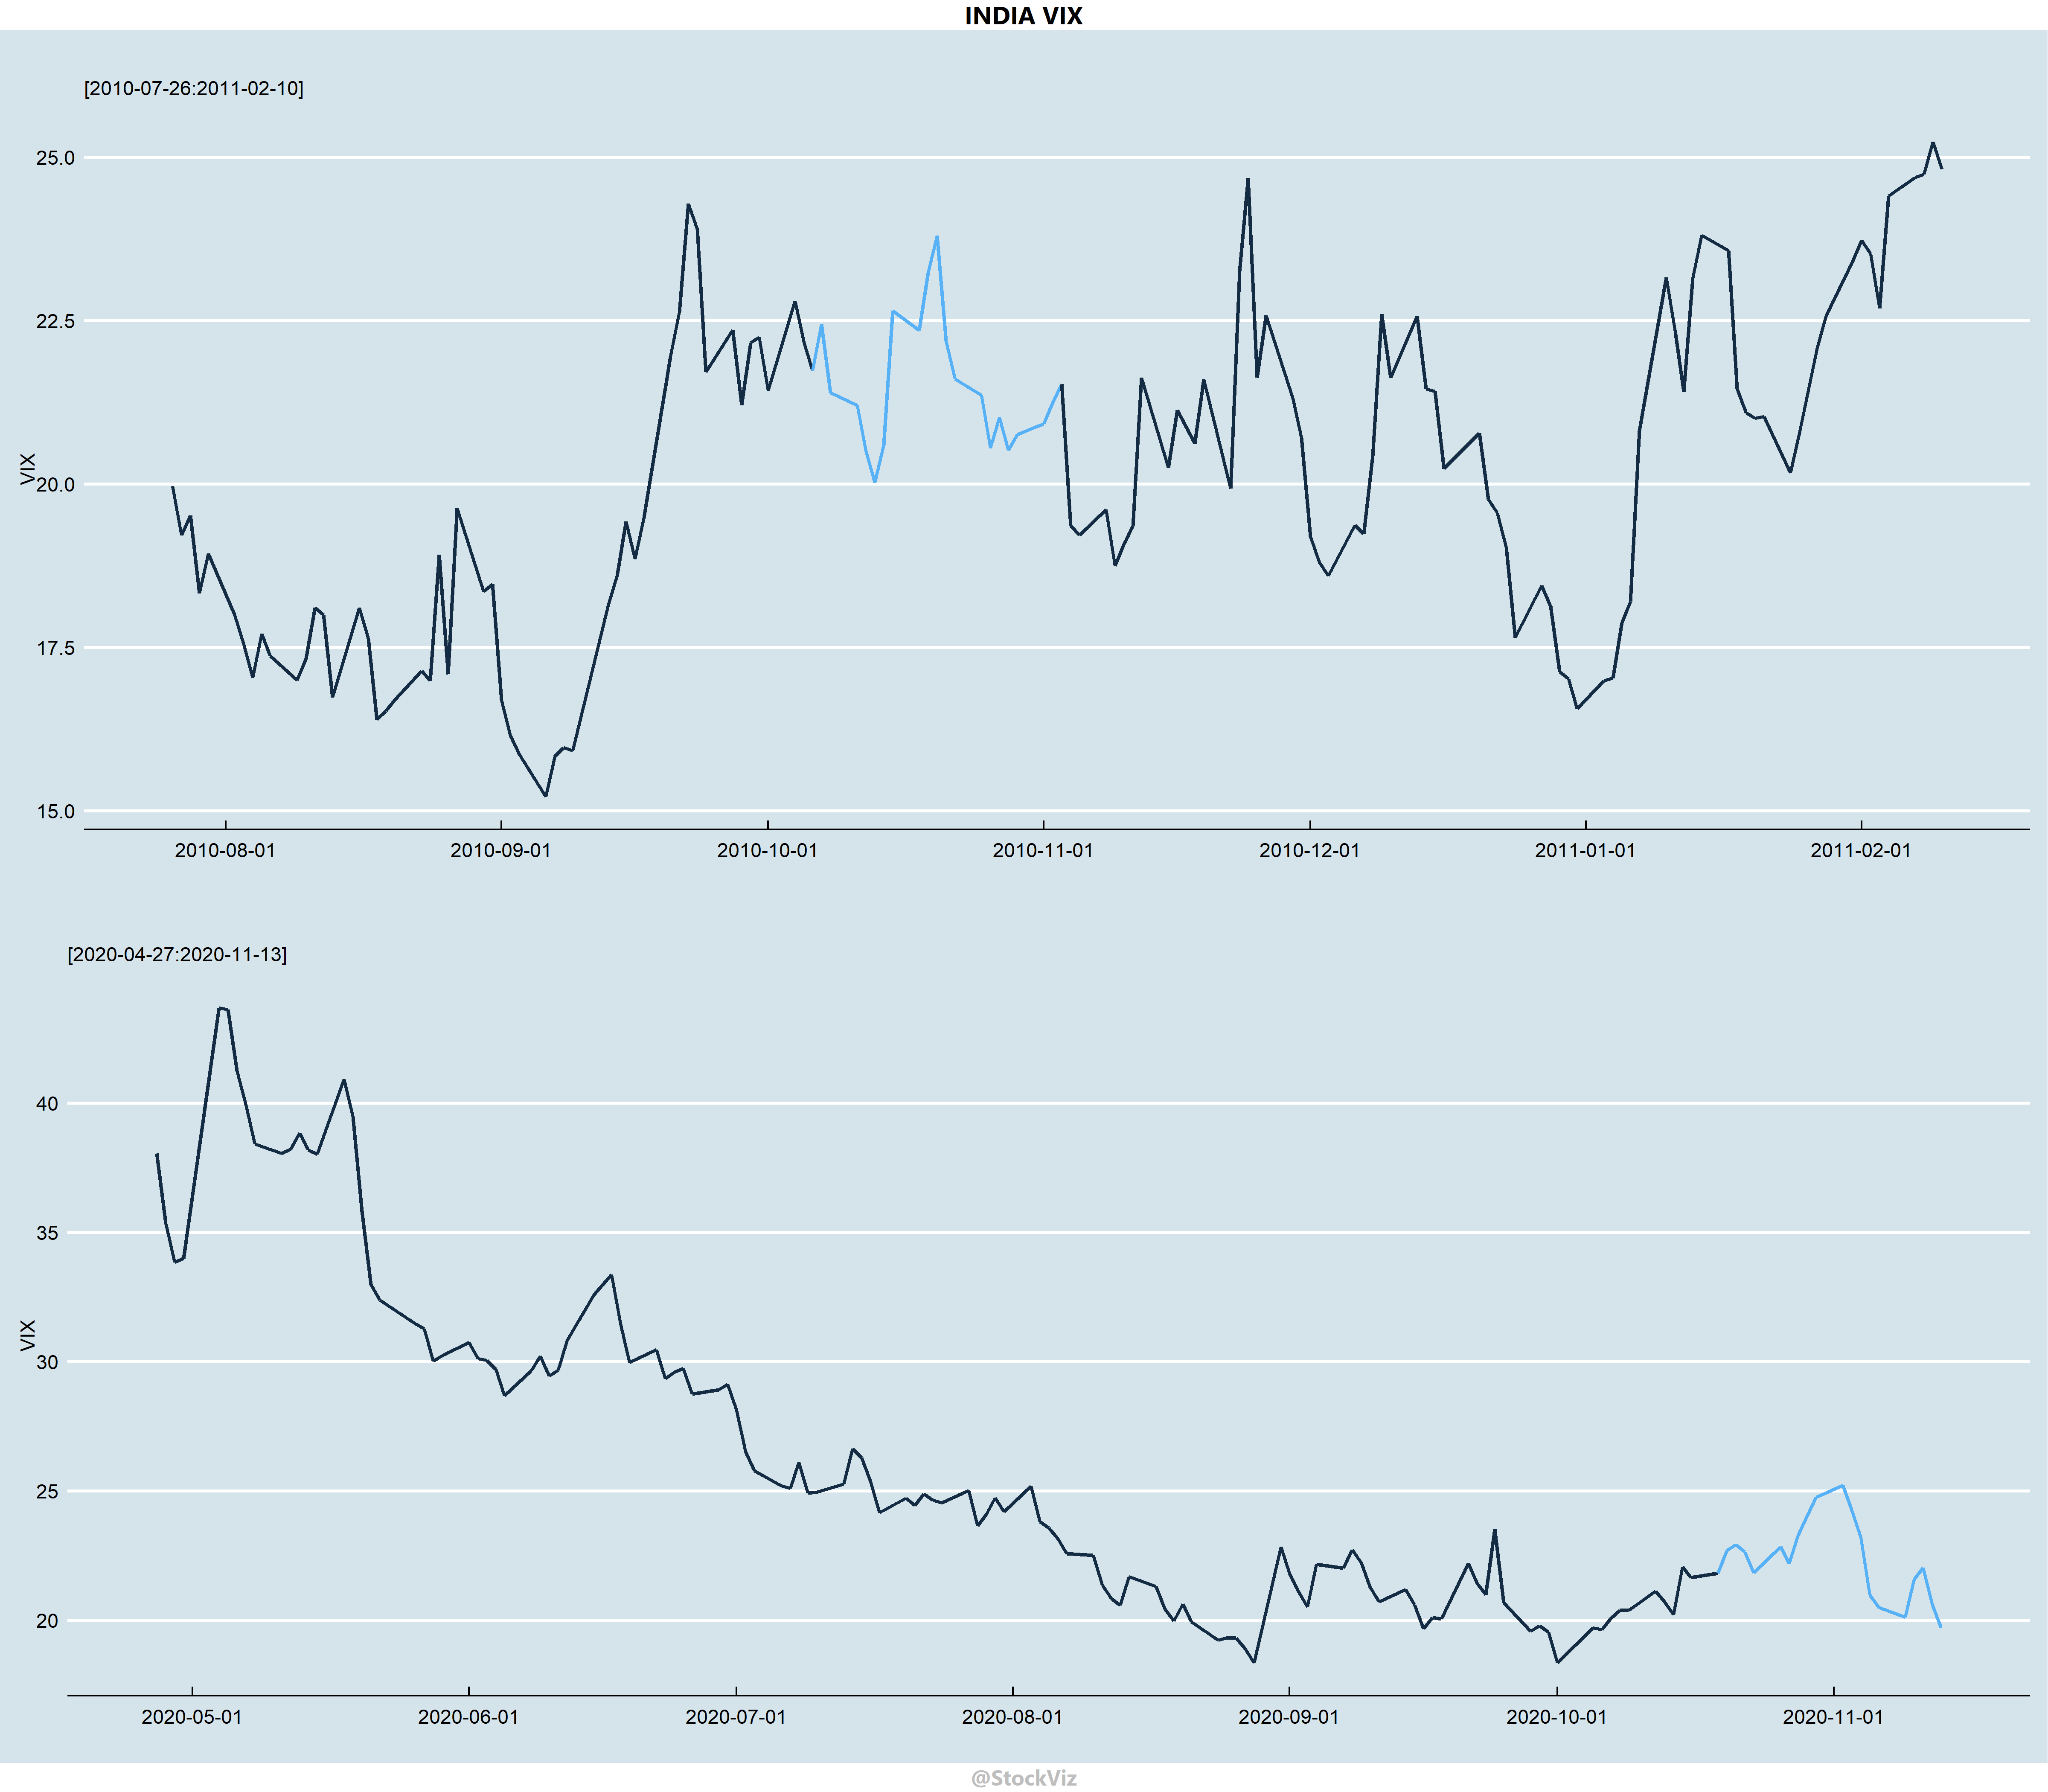
Here, the ED has dug up a segment from November-2010 as one of the top 5 matches. Take a closer look:

While not a perfect match, it “sort of” comes close.
Sometimes, a simple tool is good enough to get you 80% of the way. This is one of them.