The NSE has a couple of strategy indices – the NIFTY Alpha 50 Index and the NIFTY100 Alpha 30 Index – based on historical CAPM alphas. The former selects 50 stocks from the largest 300 stocks whereas the latter selects 30 stocks from the NIFTY 100 index.
First, a look at a simple buy-and-hold strategy.
Buy-and-Hold Curves
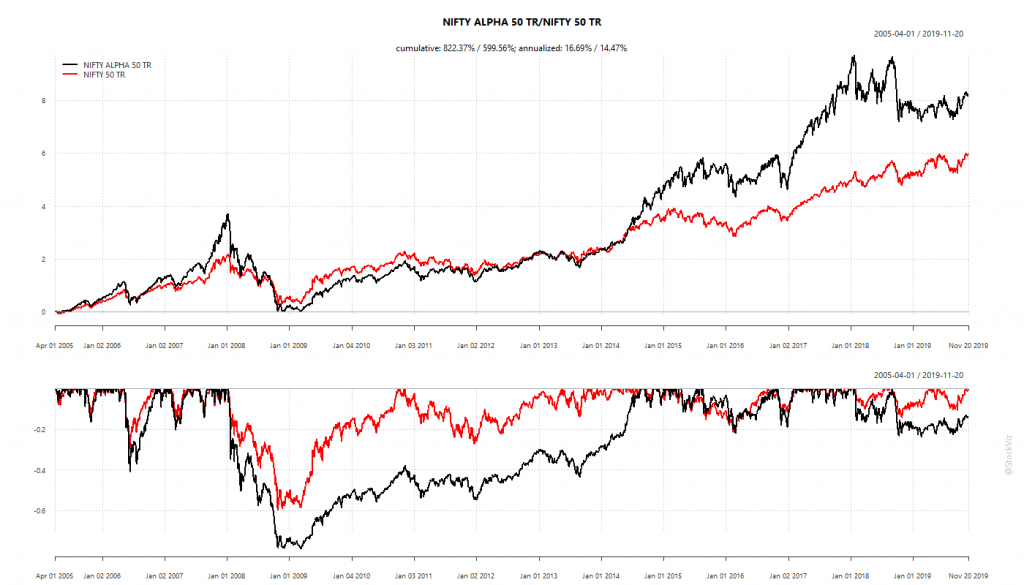
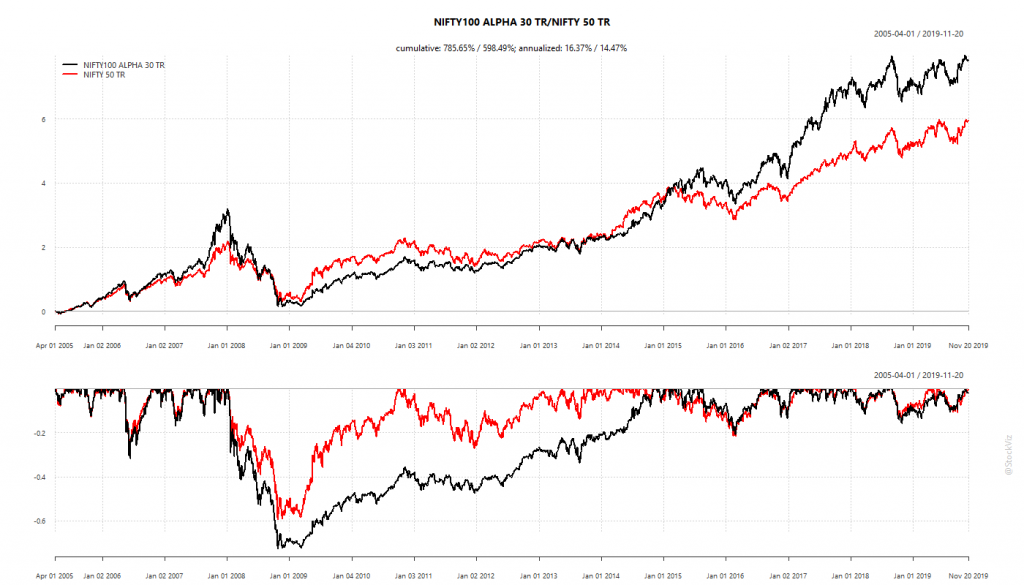
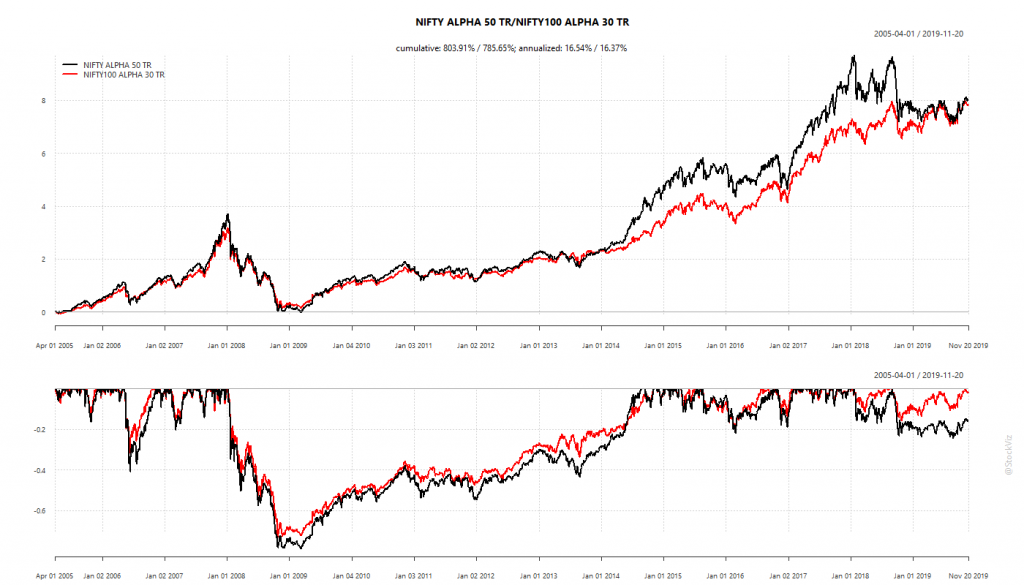
The alpha indices have out-performed the plain-vanilla NIFTY 50. However, what jumps out off the page is the sheer depth and length of the drawdows that these indices have made.
Even though they give vastly better returns than the NIFTY 50 index, the lived experience would be too painful for most investors. Is there a way to reduce these drawdowns while retaining most of the out-performance?
In a 2012 paper, Momentum has its moments, Barroso and Santa-Clara outline a way in which historical volatility could be used to reduce momentum crashes.
Strategy Outline
The basic idea is that momentum risk is time-varying and sticky. And, periods of high risk are followed by low returns.
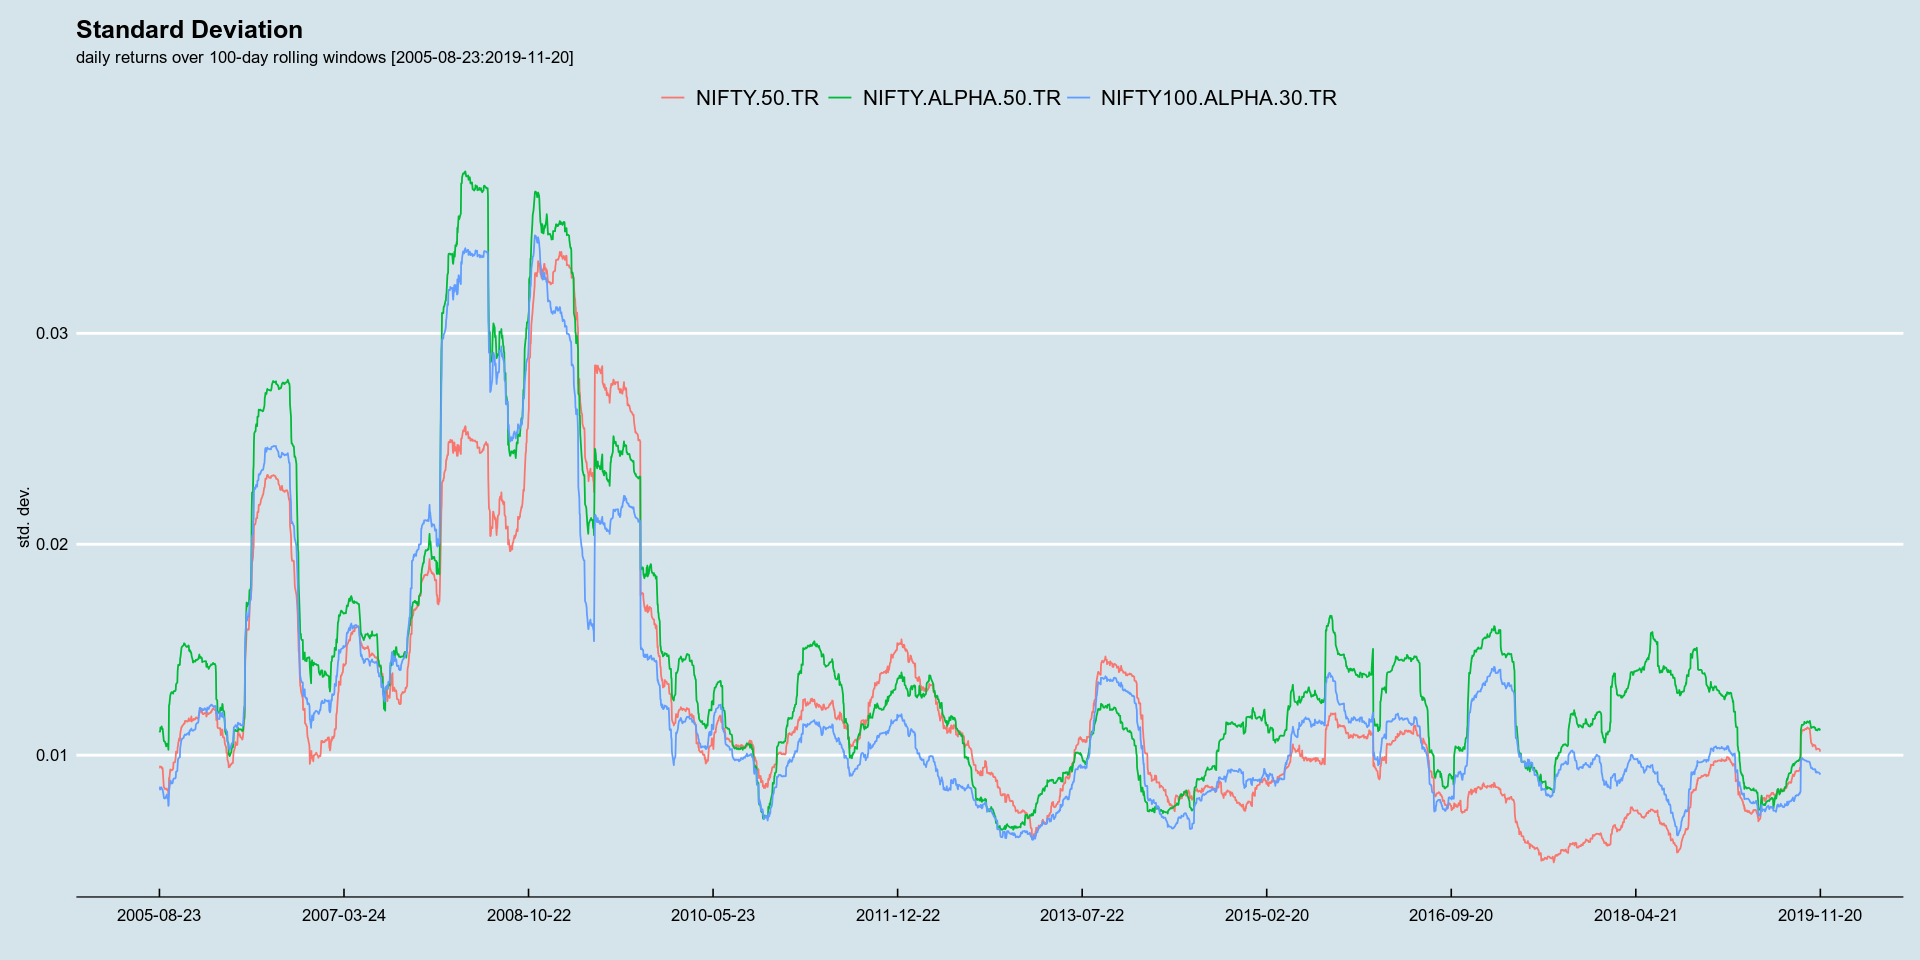
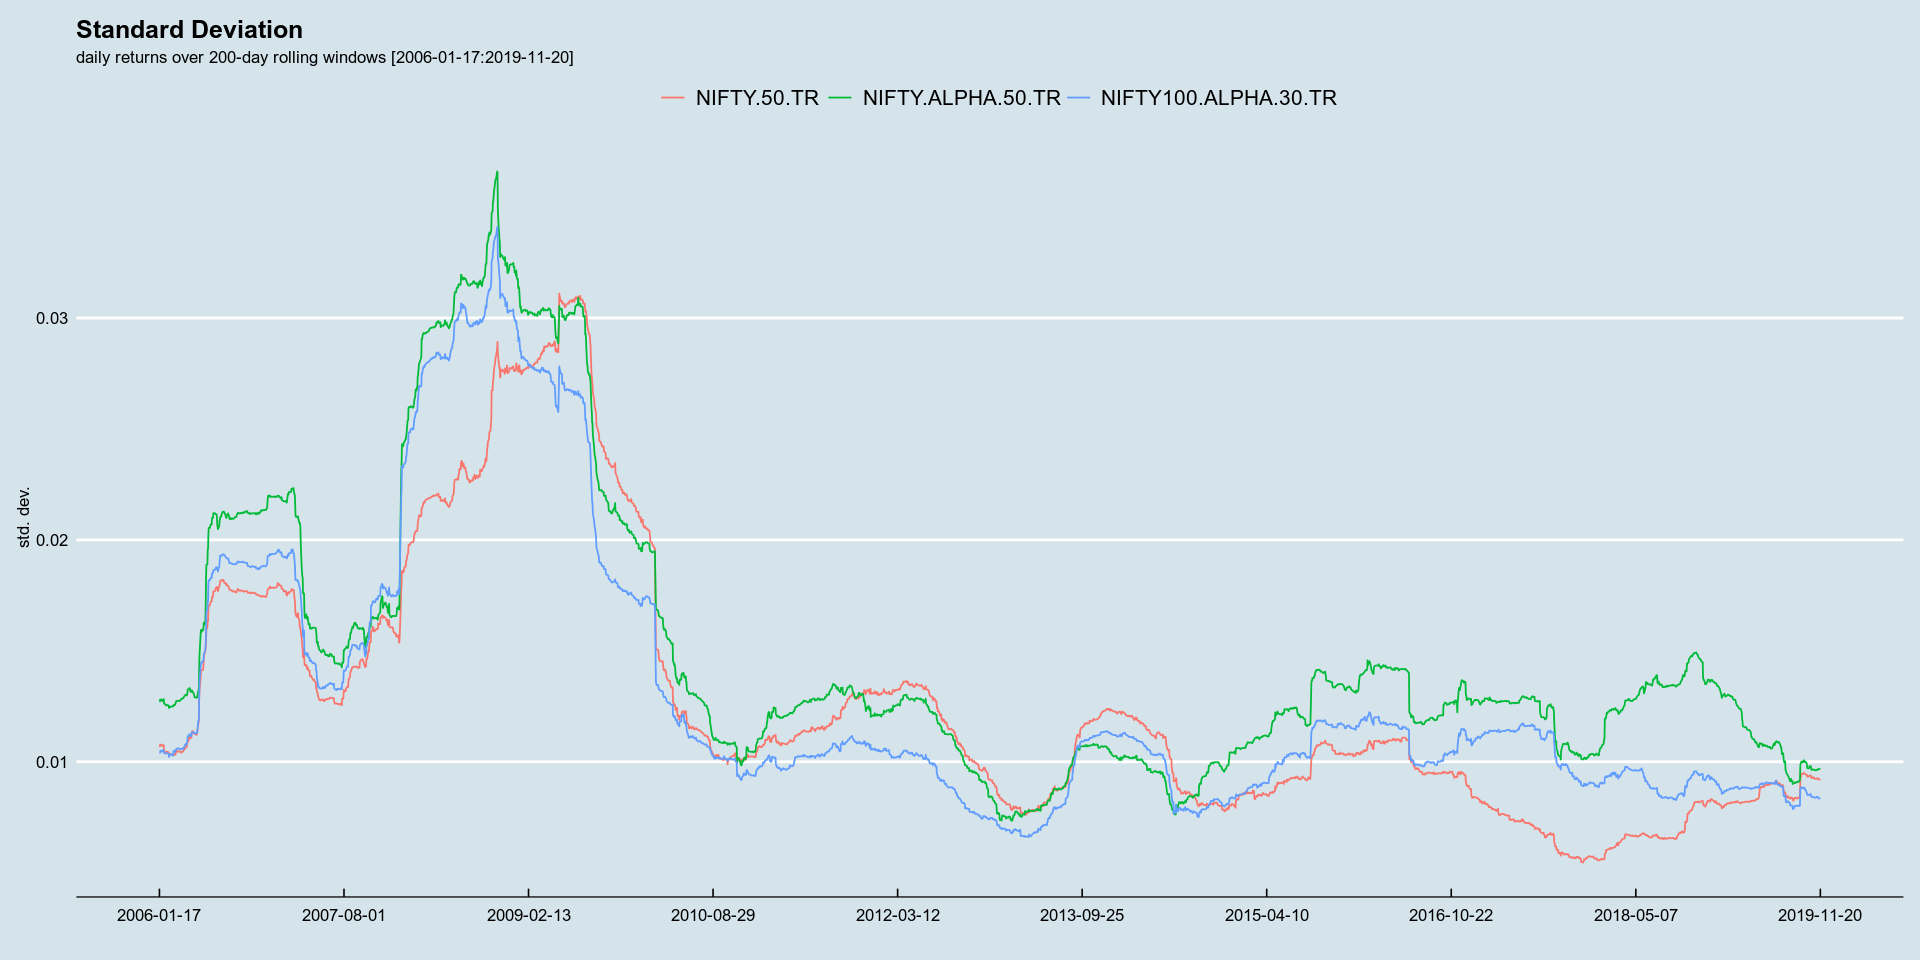
To test this theory out on the Alpha indices, we first split the time series into halves. The first to “train” and the second to “test.” We need a training set because we are not sure what the appropriate look-back for calculating risk should be (we check 100- and 200-days). The test set is a check of out-of-sample behavior of the strategy.
The theory laid out in the paper, that periods of high risk is followed by periods of low returns, is true. Subsequent returns when std. dev. is in the bottom deciles show large negative bias. Also, perhaps indicating a bit of mean-reversion, returns after std. dev. is in the 7-9th decile, have fat right tails.
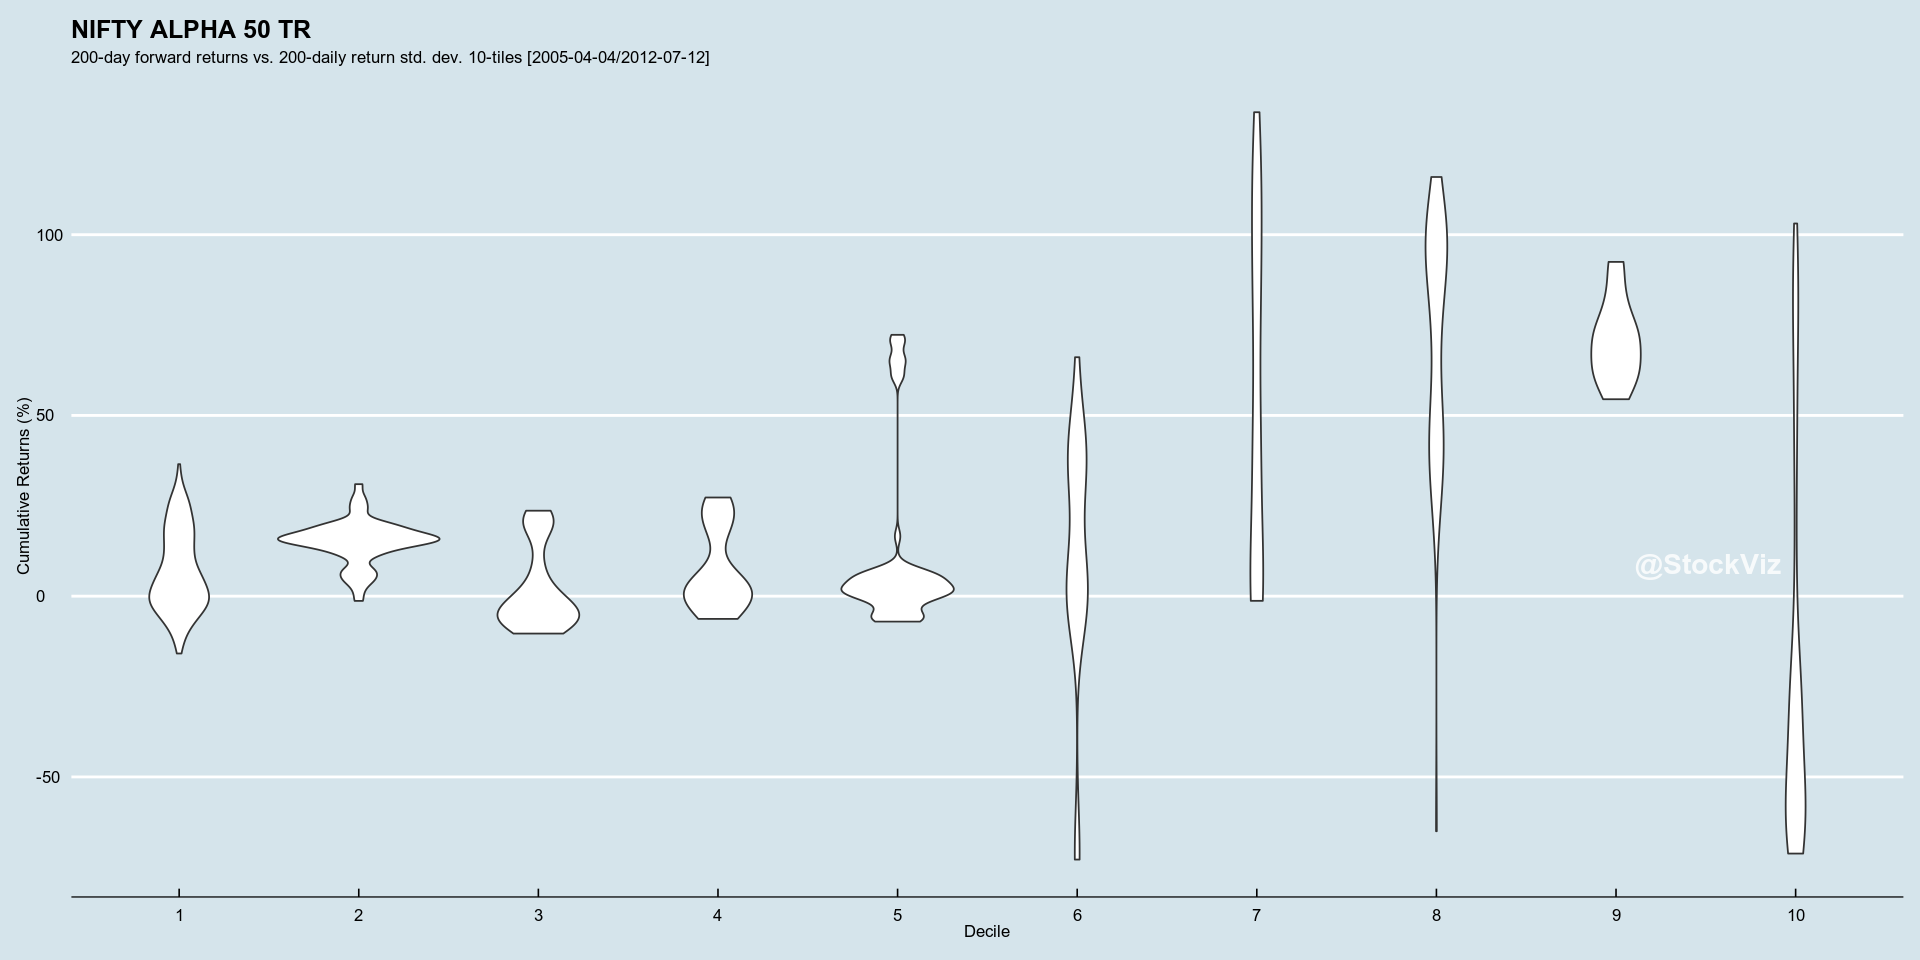
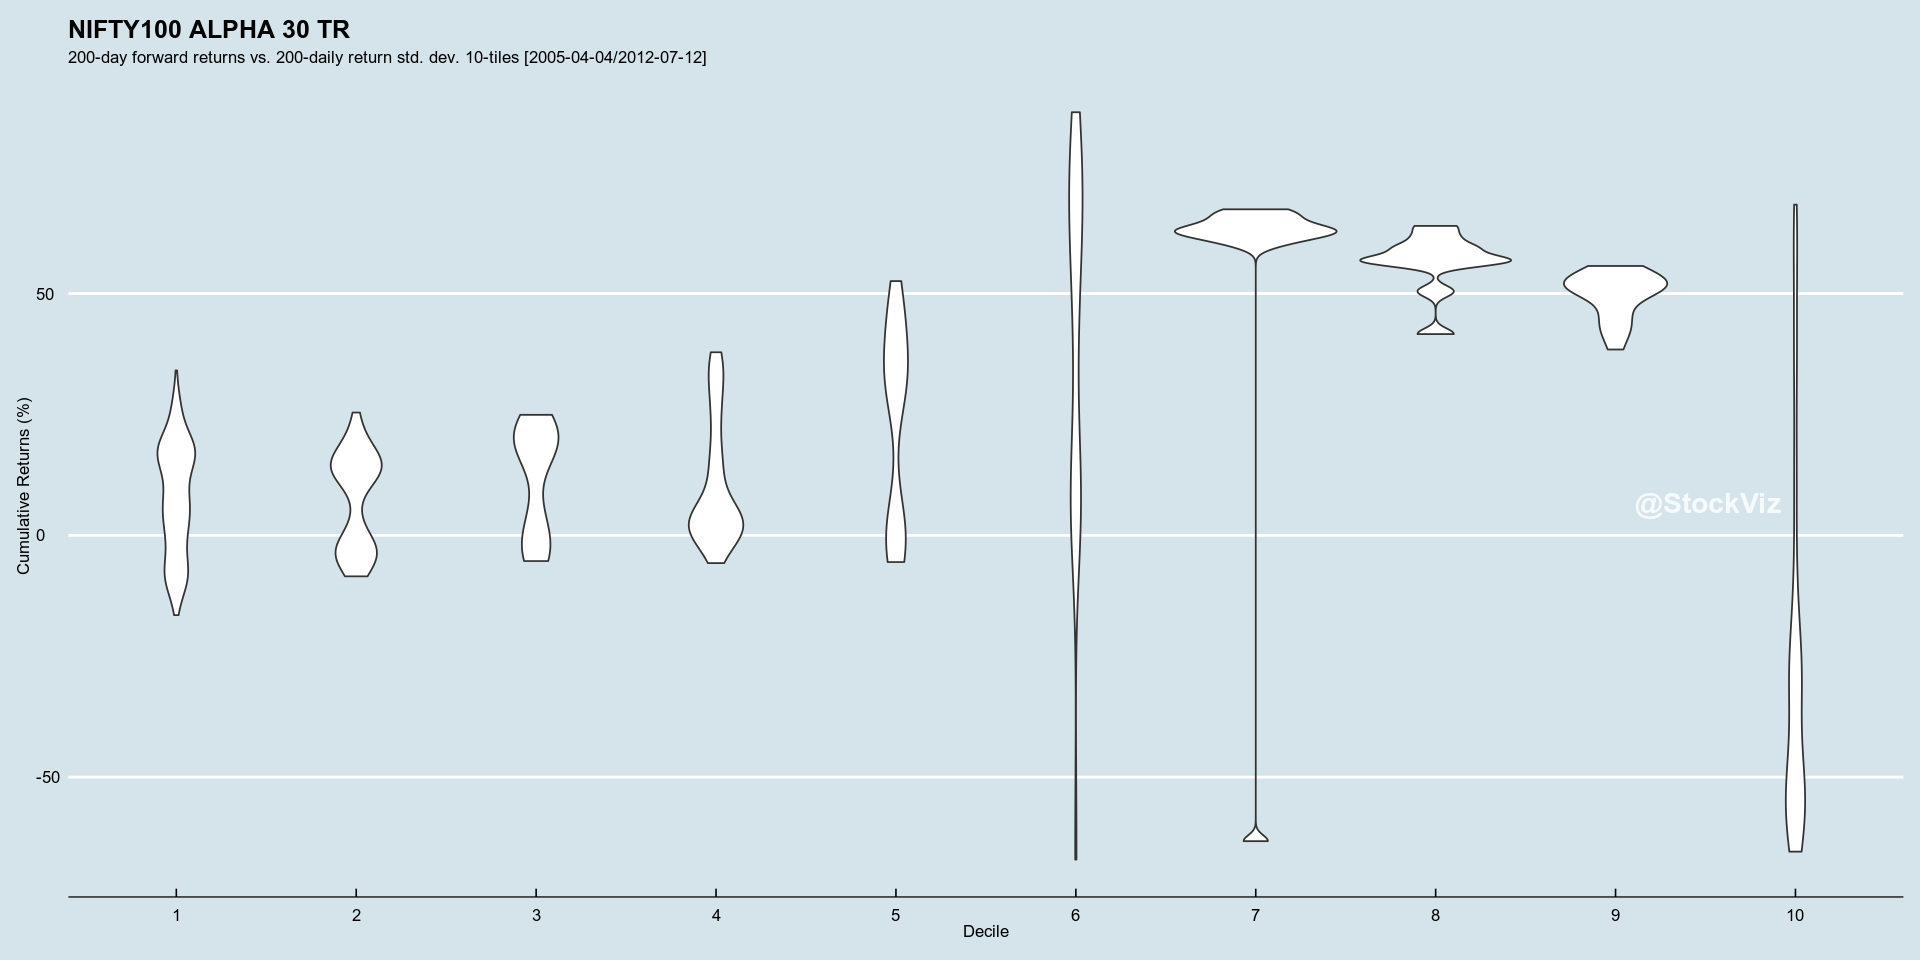
Train In-Sample
The next question is the appropriate lookback and deciles for calculating the std. dev. Running this on the training set, we find:
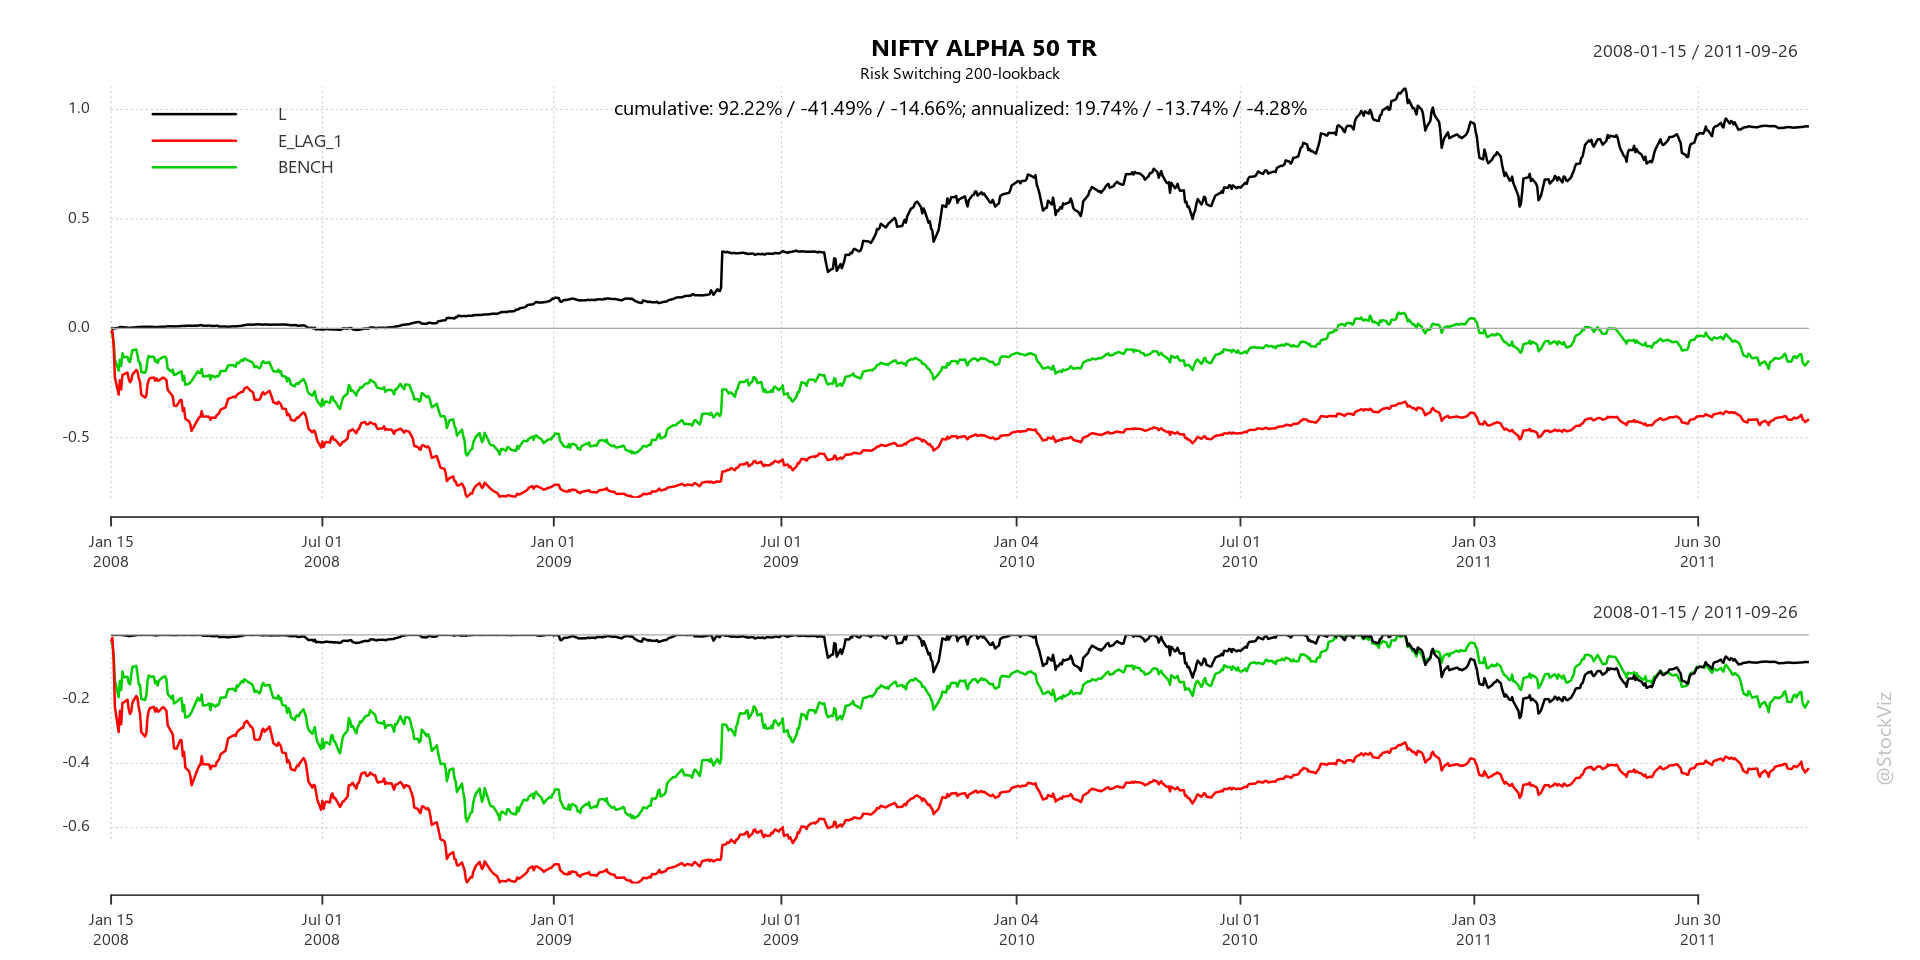
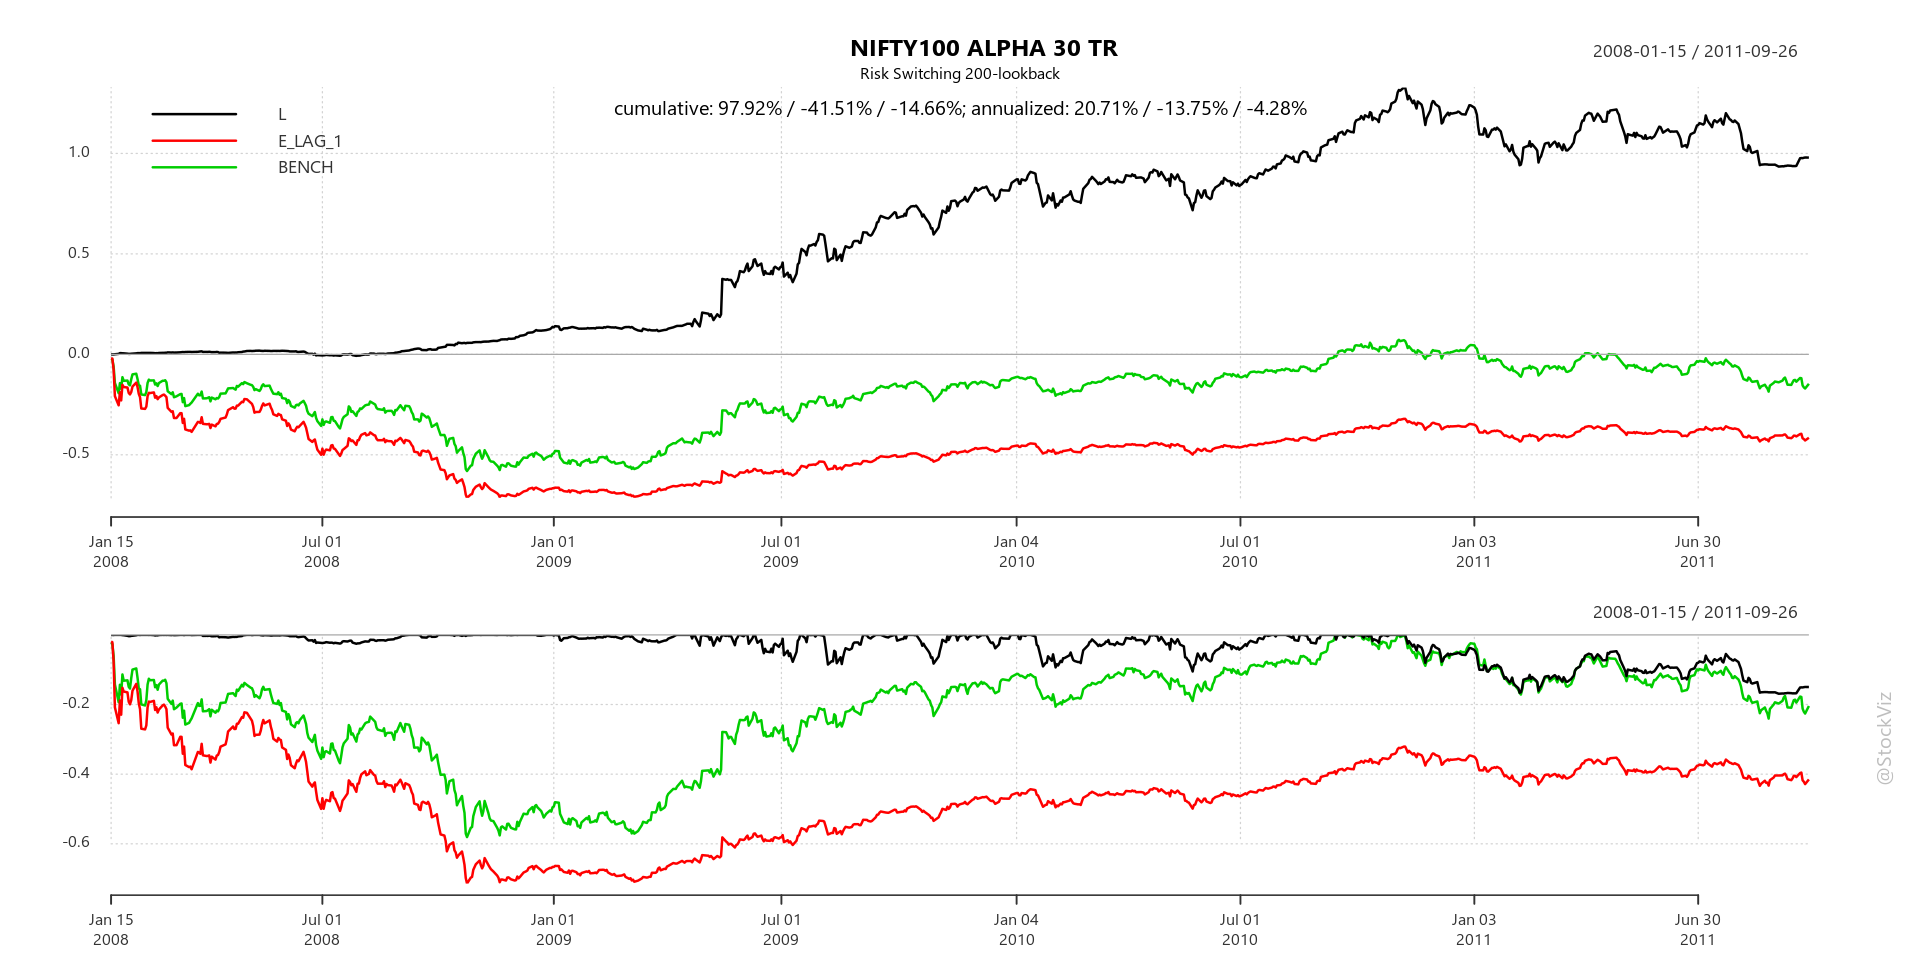

A strategy that goes long Alpha when std. dev. is in the 1-5 deciles side-steps severe drawdowns in the training set. Note, however, that it under-performed buy-and-hold during the melt-up of 2007.
Test Out-of-Sample
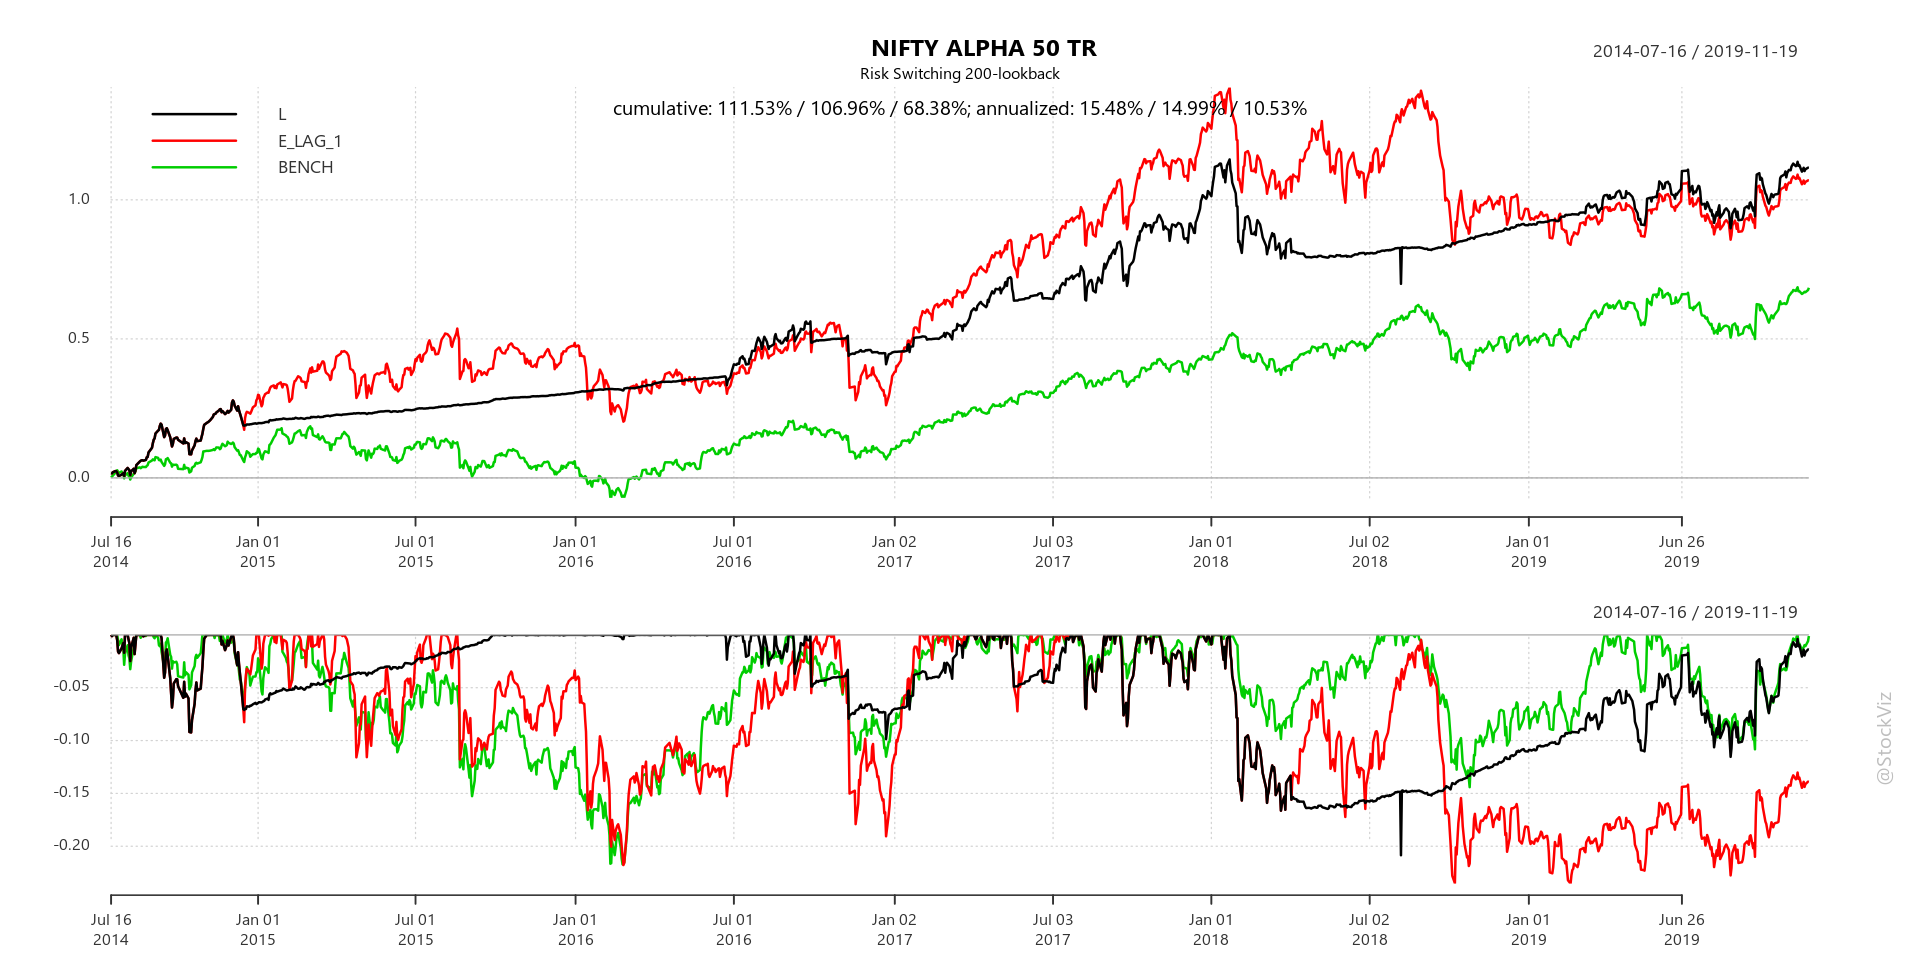
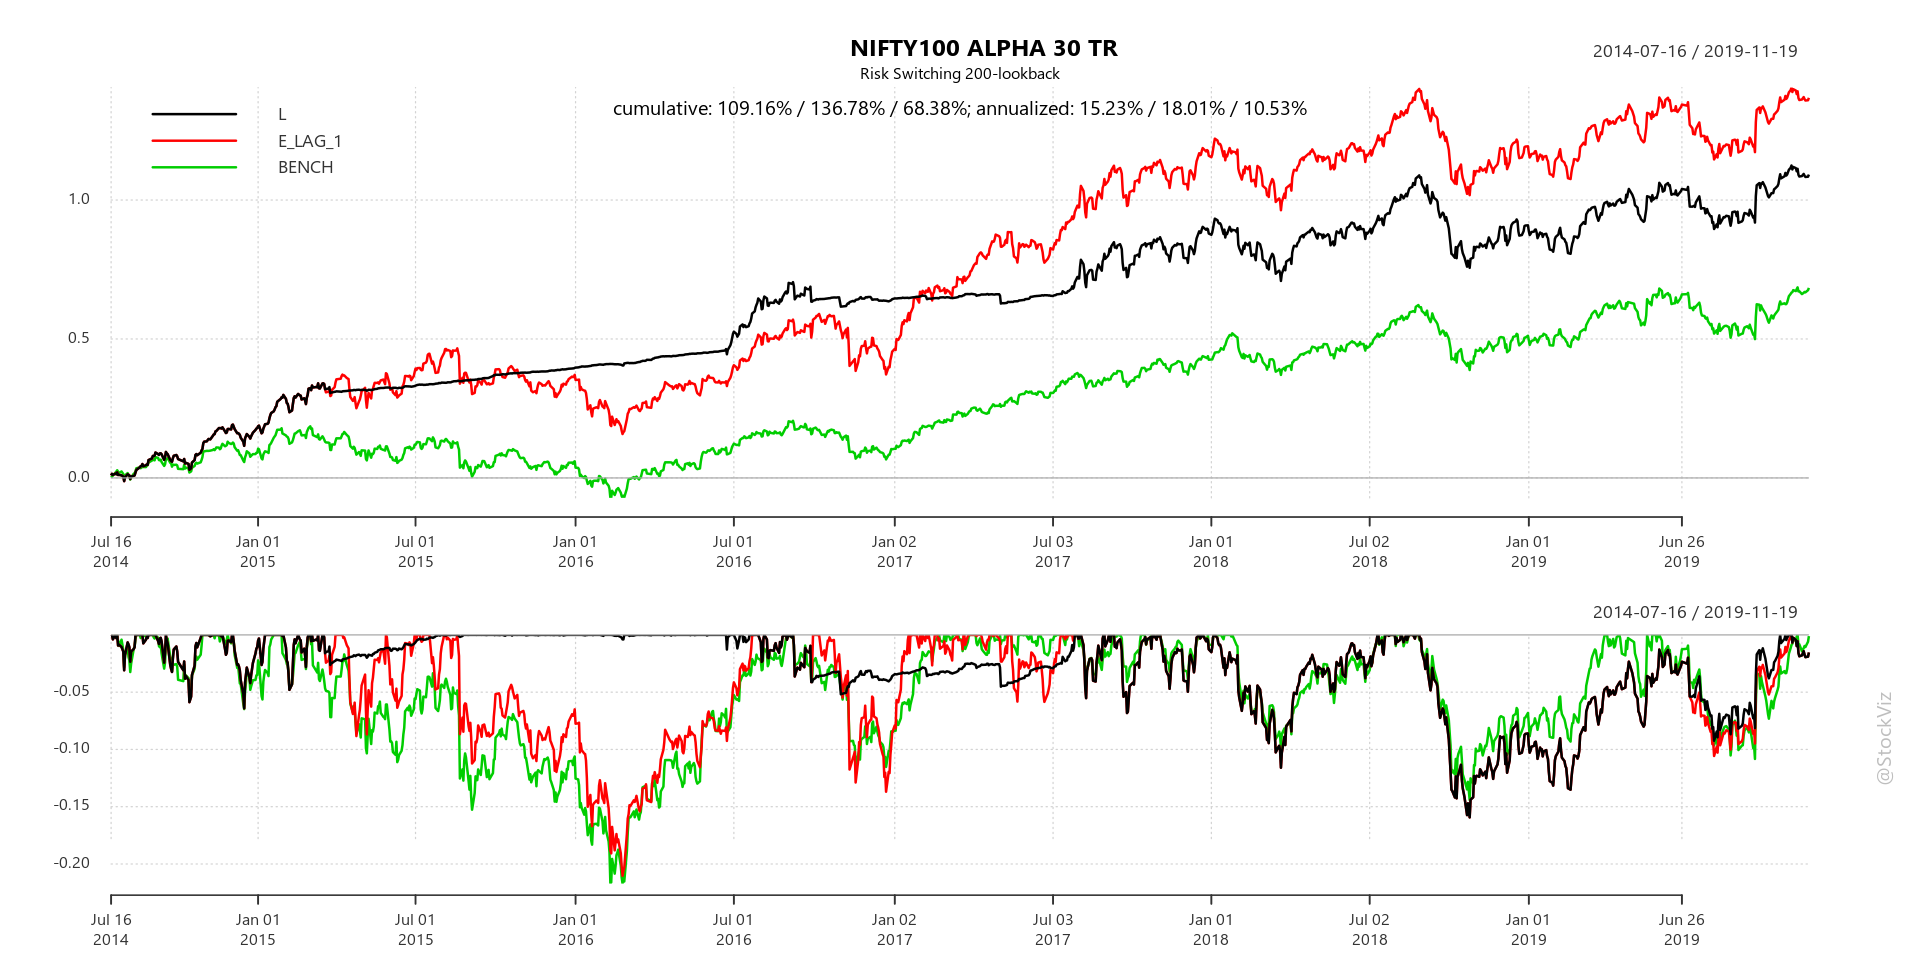
Applying a 200-day lookback on both the indices over the test set, we find that the strategy continues to side-step drawdowns but no longer out-performs buy-and-hold by a large margin.

Conclusion
Using historical volatility (std. dev.) reduces drawdown risk in Alpha indices. But it comes at the cost of reduced overall returns over buy-and-hold over certain holding periods. However, given the magnitude of the dodge in 2008 and 2016, it is well worth the effort (and cost) if it helps keep the discipline.
Check out the code for this analysis on pluto. Questions? Slack me!