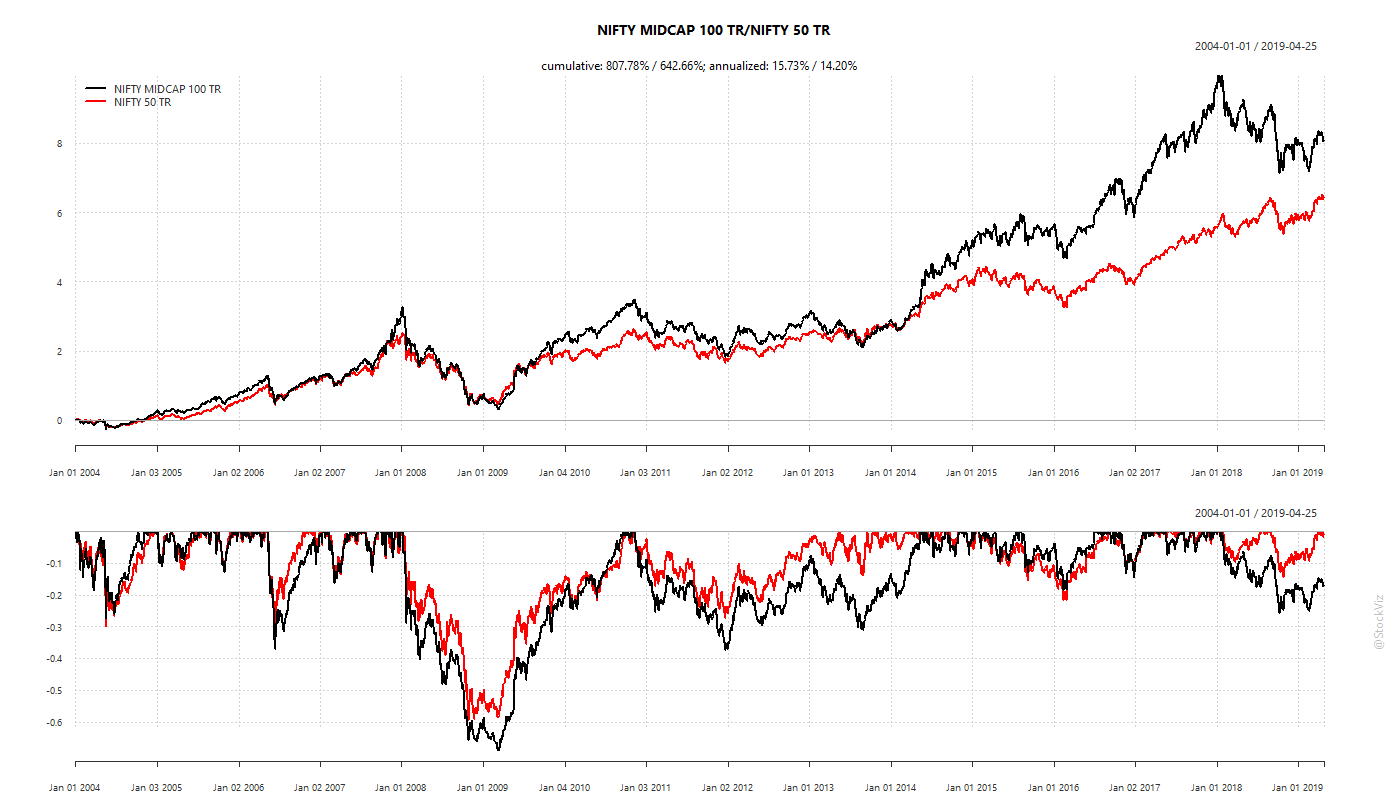
Indian mid-caps, represented by the NIFTY MIDCAP 100 TR index, has out-performed its large-cap peer, the NIFTY 50 TR index.

It has done so with higher volatility. Here is the rolling 200-week standard deviation of weekly returns of the two indices:

MIDCAP volatility has been persistently higher than NIFTY volatility in the past:

A portfolio of bonds and mid-caps should exhibit lower volatility than an all-equity portfolio. Here are the standard-deviation ratios for different allocations to bonds:

B05, for example, represents a portfolio of 5% short-term bonds and 95% MIDCAP index. As allocation to bonds increases, portfolio volatility decreases.
We see from the chart above that a 75% MIDCAP + 25% BOND portfolio has almost never seen volatility greater than an all NIFTY portfolio. So, what are we giving up in returns to reduce volatility? About 2% in returns:
Take-away
- On an annualized basis, the allocation portfolio gives up about 2% in returns compared to all MIDCAP portfolio and is on par with NIFTY’s.
- After taxes and transaction costs, expect the allocation portfolio to under-perform buy-and-hold NIFTY.
- No pain. No gain.
Code and charts are on github.
