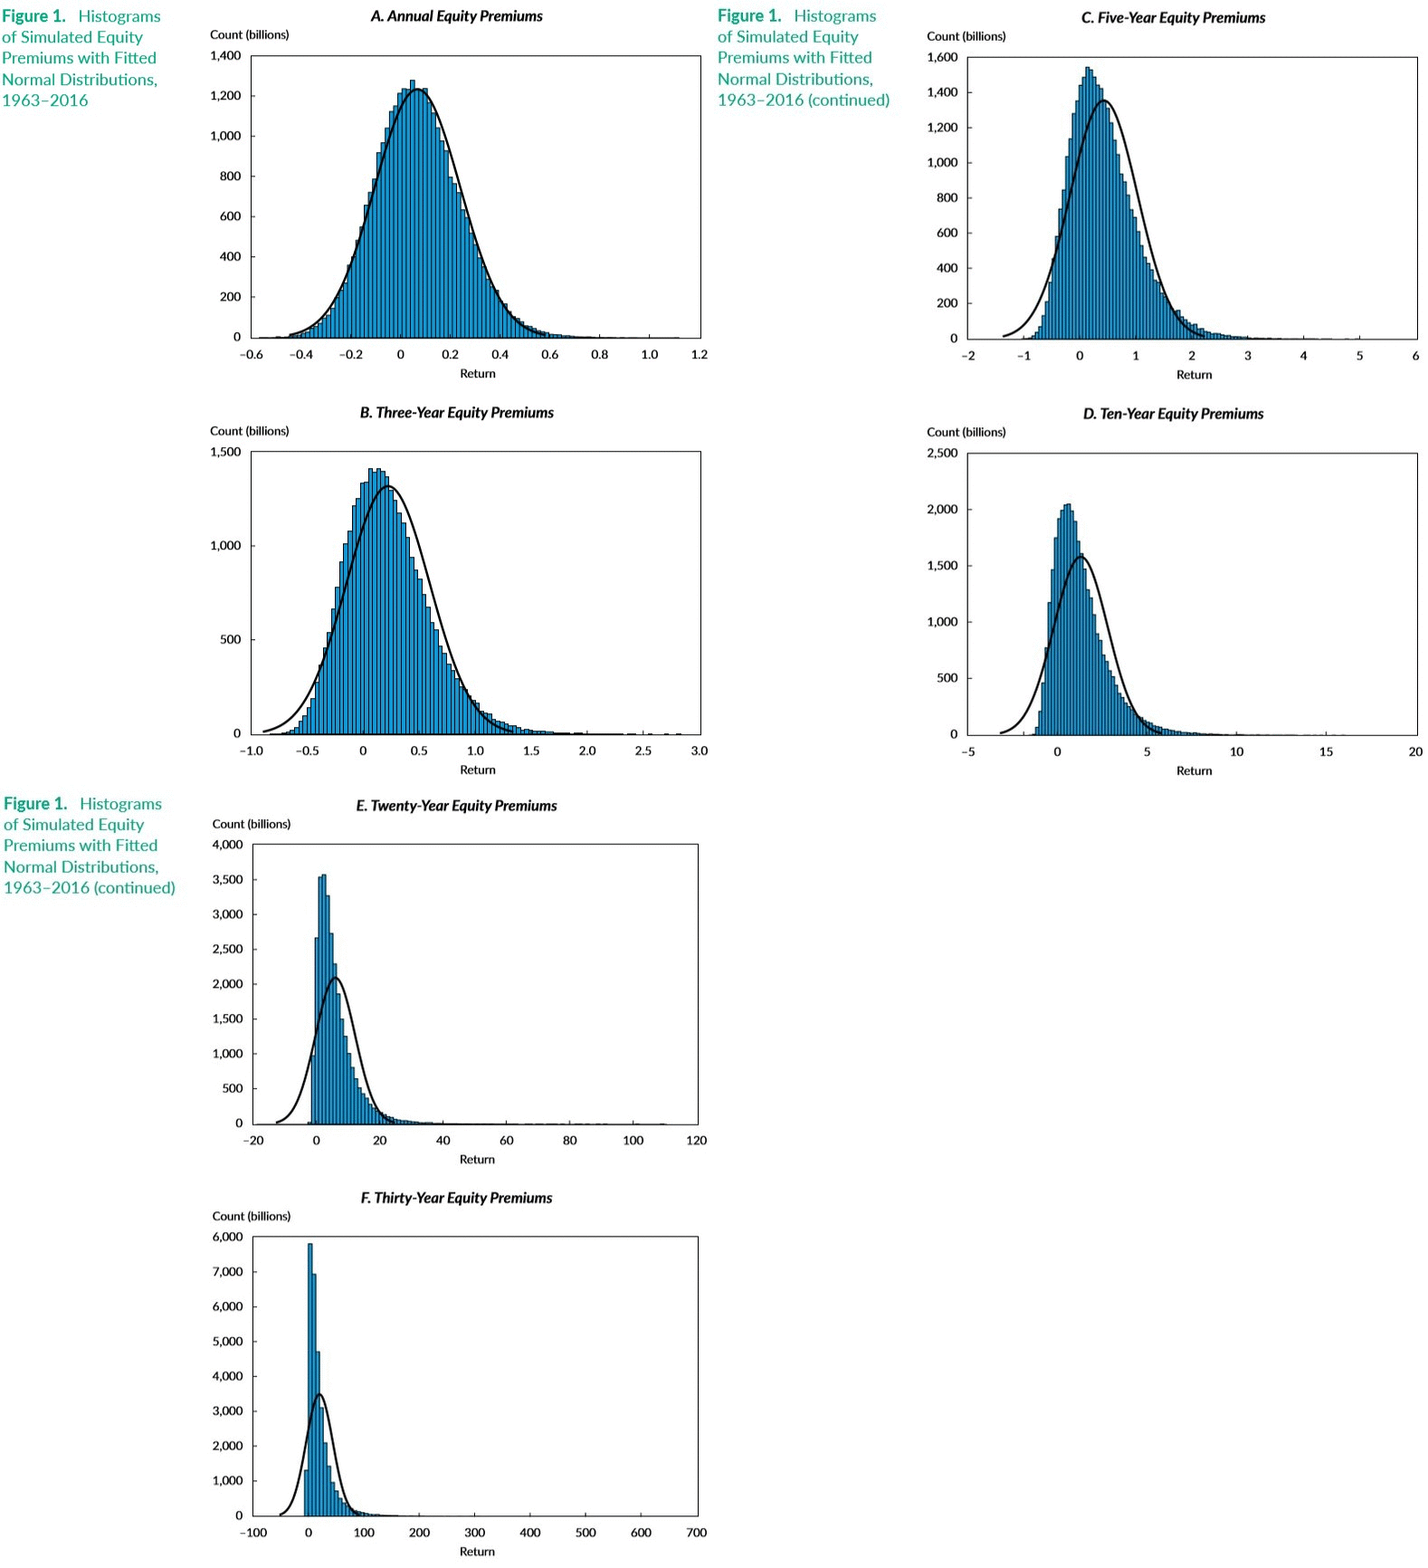
Most new equity investors think “long term” is three years. Some think its five. This leads to expectations that are setup to fail. We wrote about projecting future returns recently where we showed how we expect 20-year returns to be statistically distributed. In the simulations that we ran for that article, we also projected returns for 10- and 30-year horizons. We reproduce the charts below.
10-year S&P 500 return distribution
20-year S&P 500 return distribution
30-year S&P 500 return distribution
As your investment horizon grows larger, the probability of you facing severe losses come down and the overall probability of positive outcomes increase.
Fama and French agree
In a recent paper, Volatility Lessons for the Financial Analysts Journal, Eugene F. Fama and Kenneth R. French pretty much arrive at the same result. Here are the charts from their paper:

And they conclude:
The high volatility of monthly stock returns and premiums means that for the three- and five-year periods used by many professional investors to evaluate asset allocations, the probabilities that premiums are negative on a purely chance basis are substantial, and they are nontrivial even for 10- and 20-year periods.
Basically, long-term is ~30 years, anything less that is prone to be influenced by noise (luck.)


