There are a lot of conflicting statistics regarding the brokerage industry in India. Depending on the source of the data and what gets counted, one ends up with different numbers. The numbers vary depending on whether only unique demat accounts (based on PAN) are measured, the definition of an “active” account, whether purely derivative accounts are to be included, etc. The NSE has been publishing aggregated statistics for “active” accounts (measured by UCC) for different brokers for a while now. Below are some charts constructed from that data.
Number of active accounts
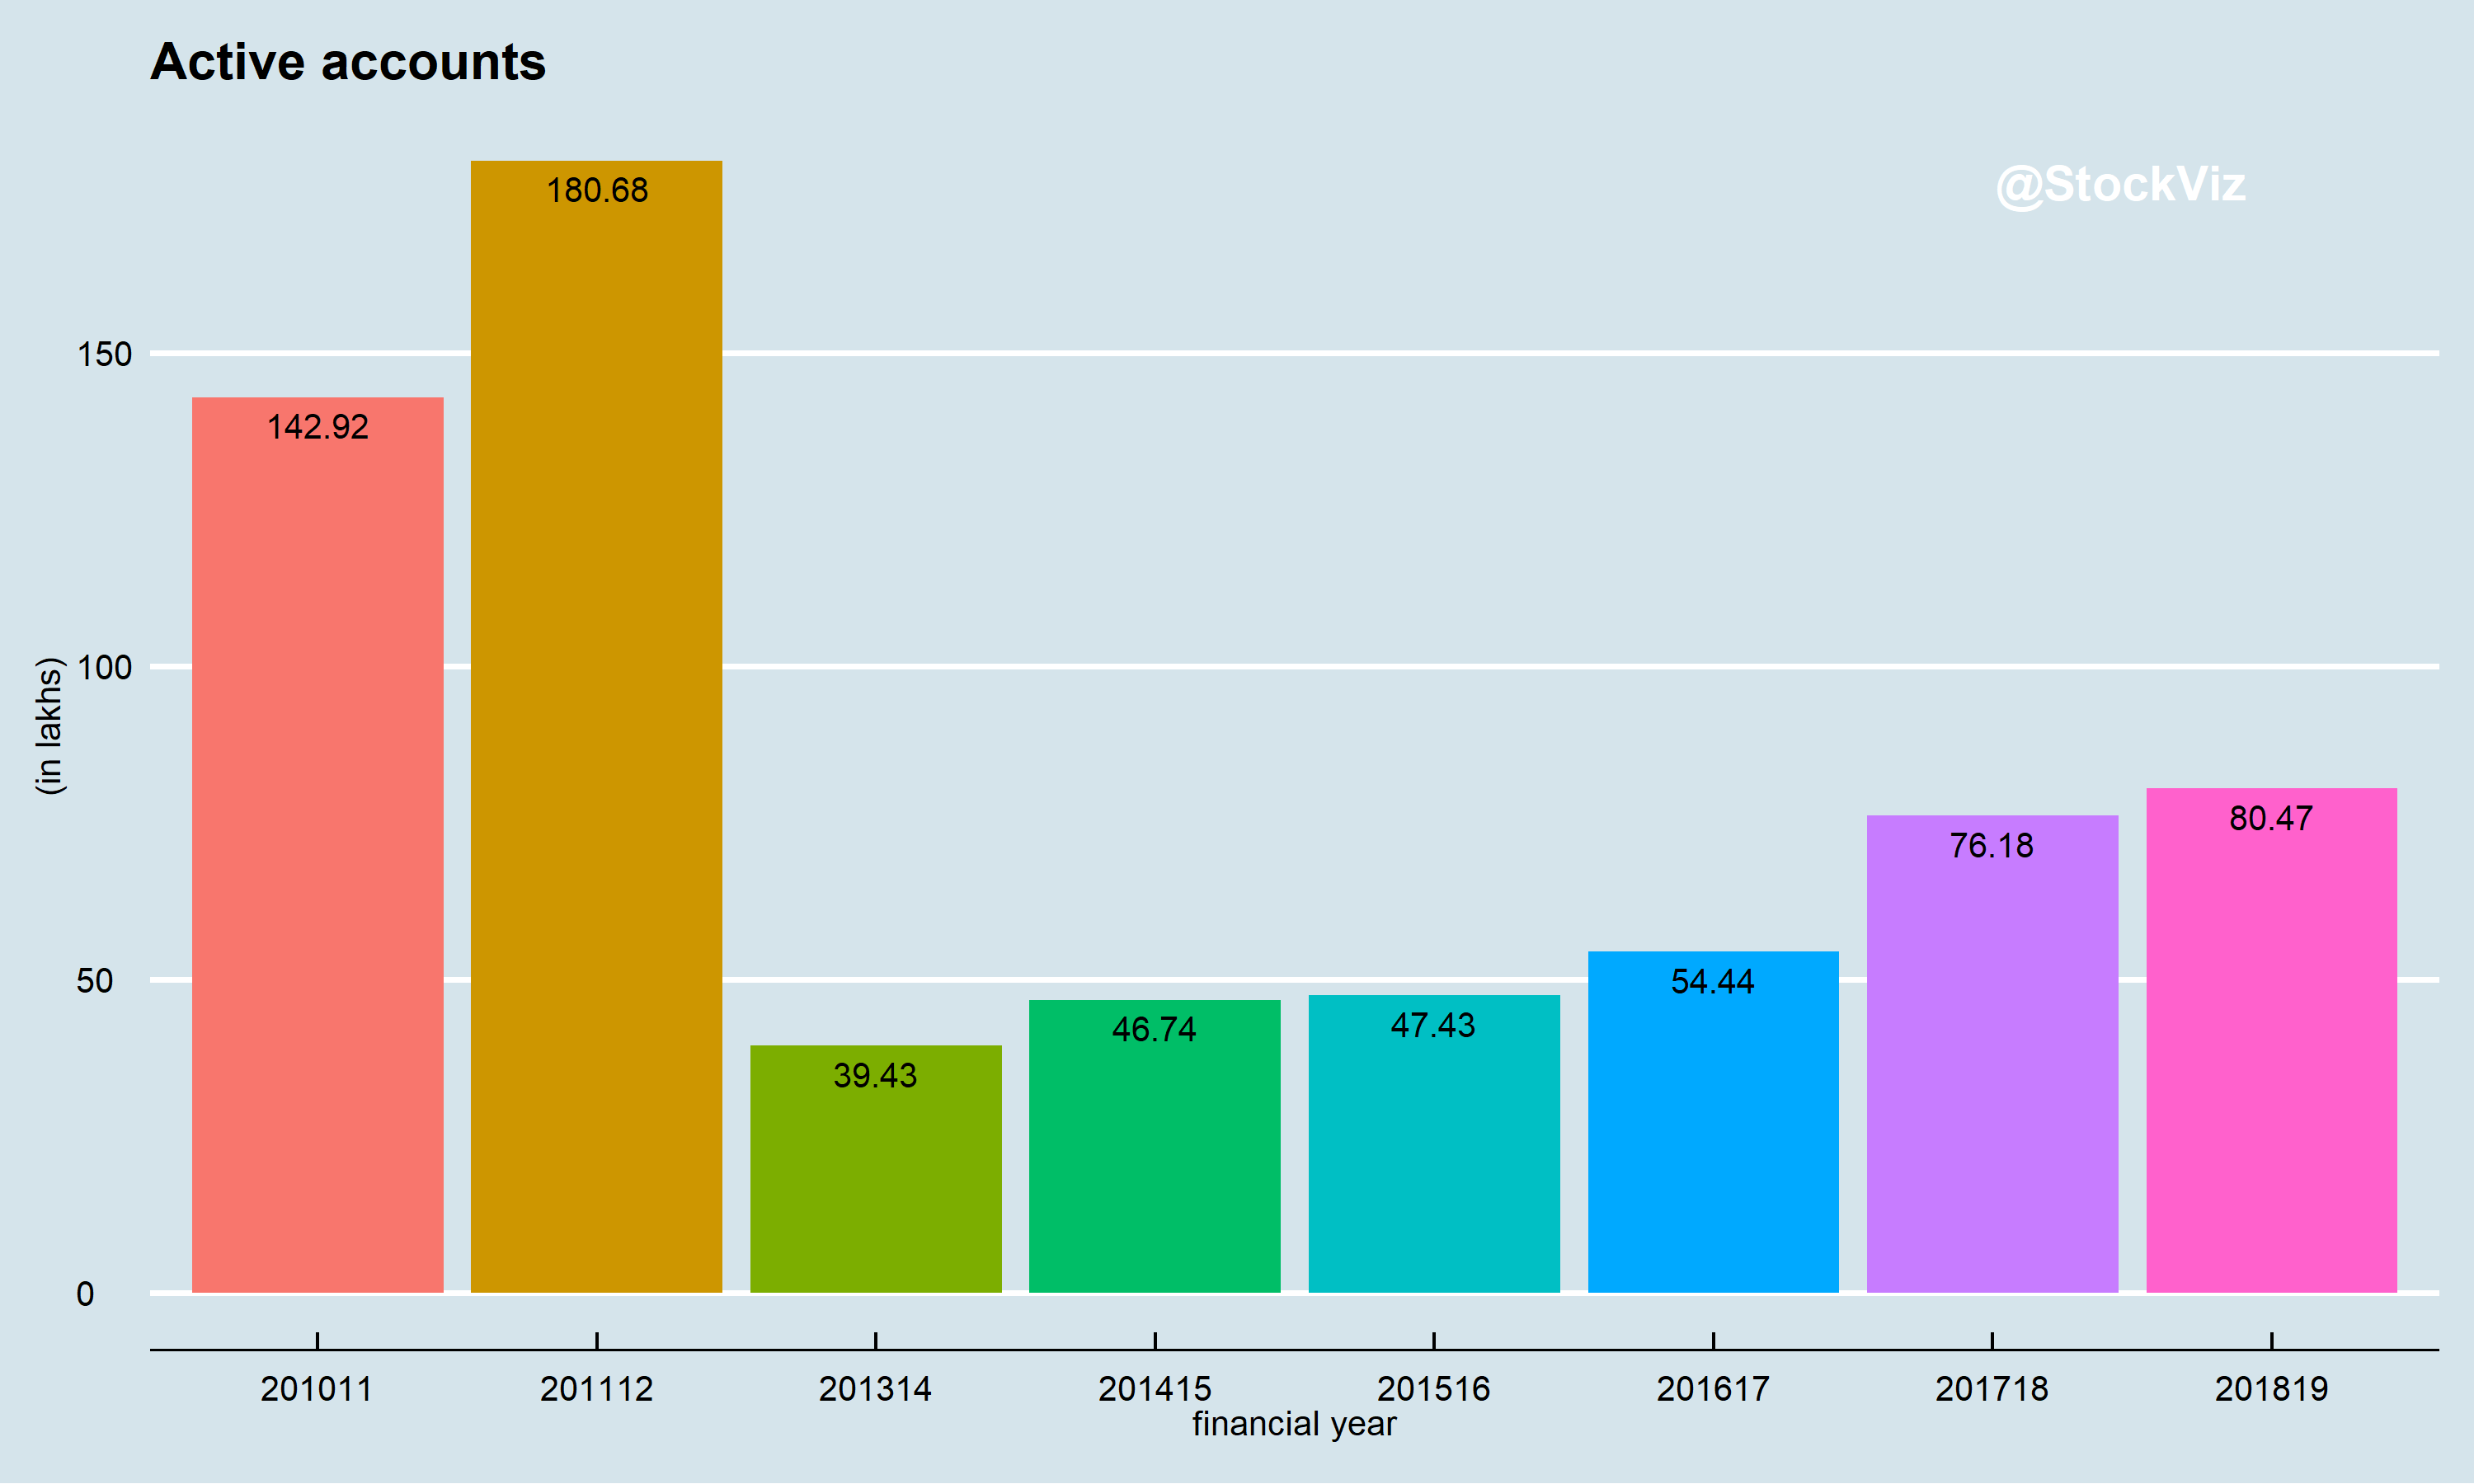
It looks like SEBI’s drive to redefine an “active” account lead to large scale deactivation of accounts in 2013-14. Duplicate accounts notwithstanding, you could tell that its a bull market by the 40% jump in active accounts between FY2016-17 and FY2017-18. However, 80 lakh total active accounts looks skinny.
The changing face of the industry

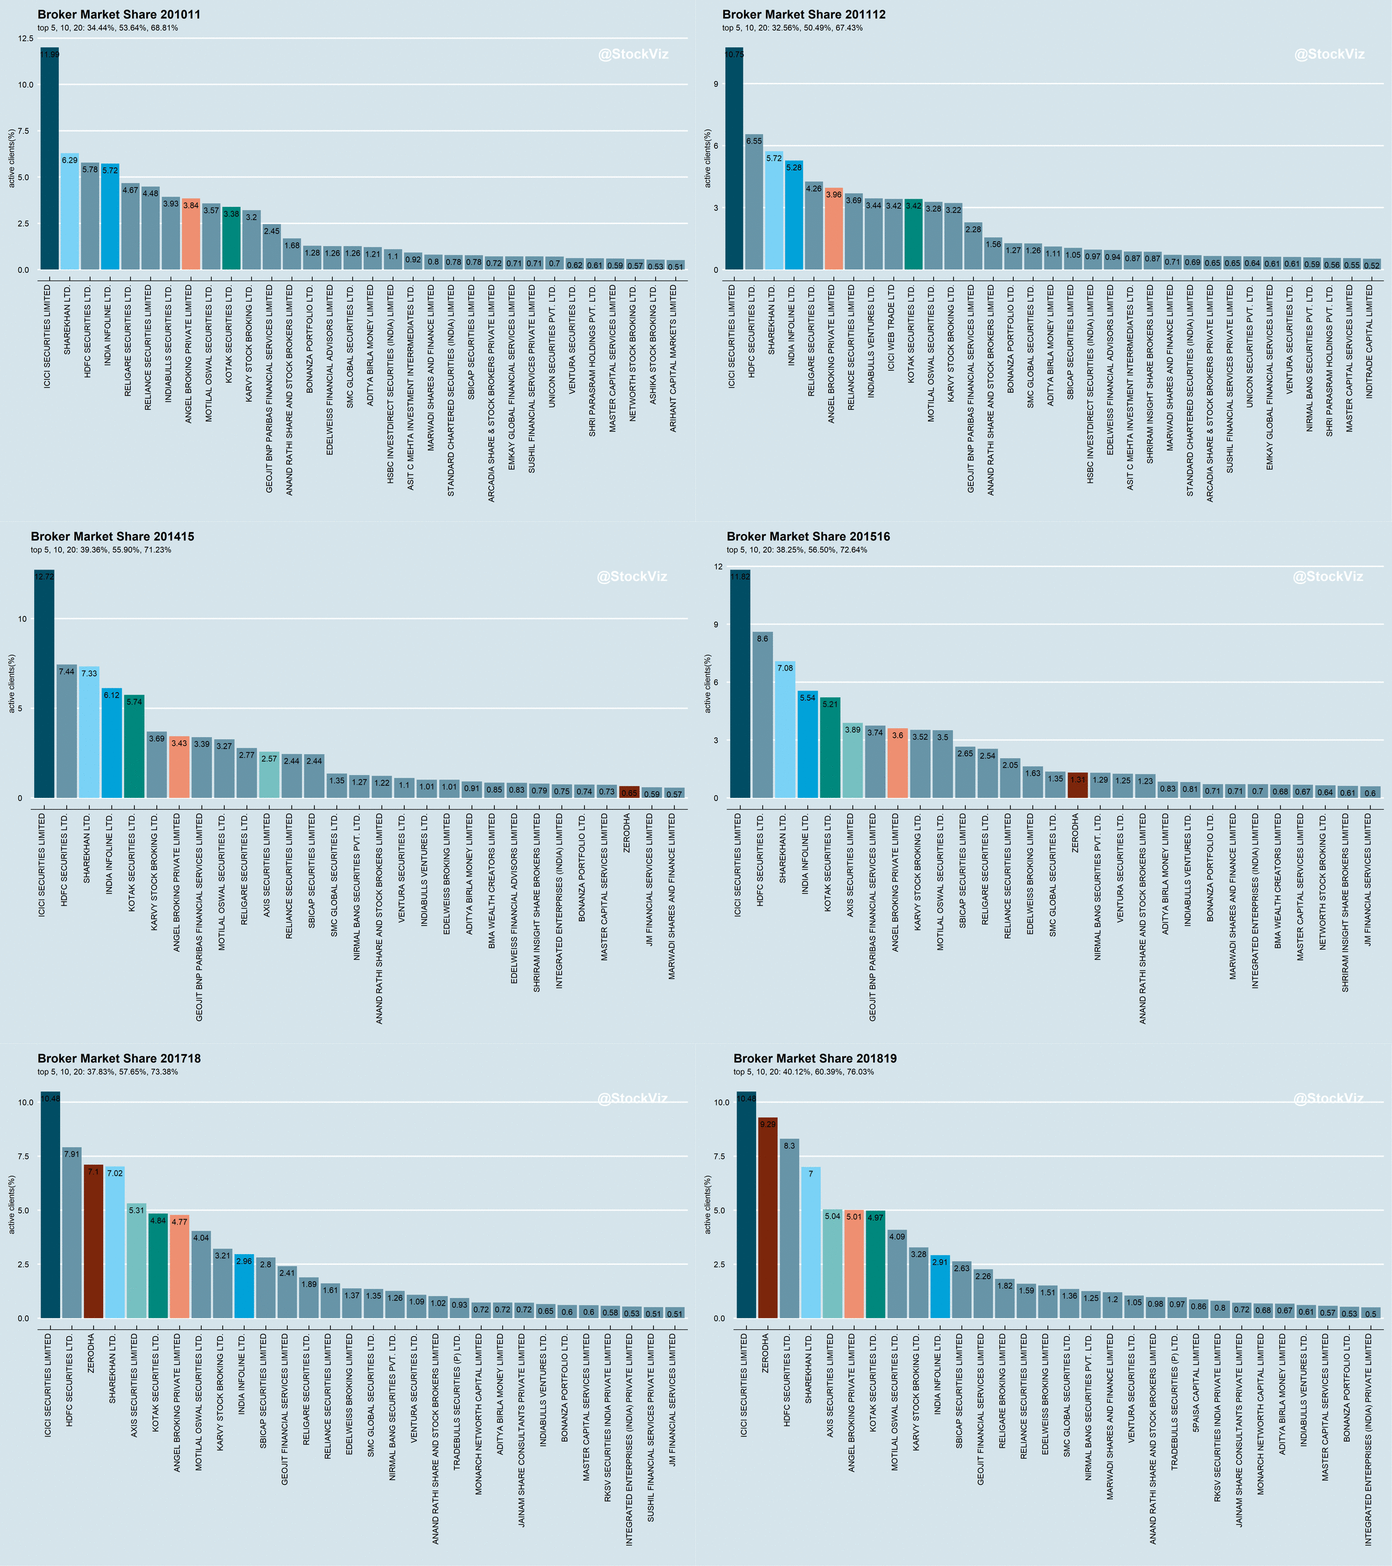
According to the latest numbers available, top 20 brokers by market-share (based on number of active accounts) had cornered 76% of the market, compared to 69% back in FY2010-11. The top 5 have further widened the lead with the rest. However, there has been a lot of churn in the leadership. At current growth rates, it appears that it is only a matter of time before discount broking displaces full-service broking.
We don’t have much more to add at this point but we will keep yanking on this thread over the days to come.
