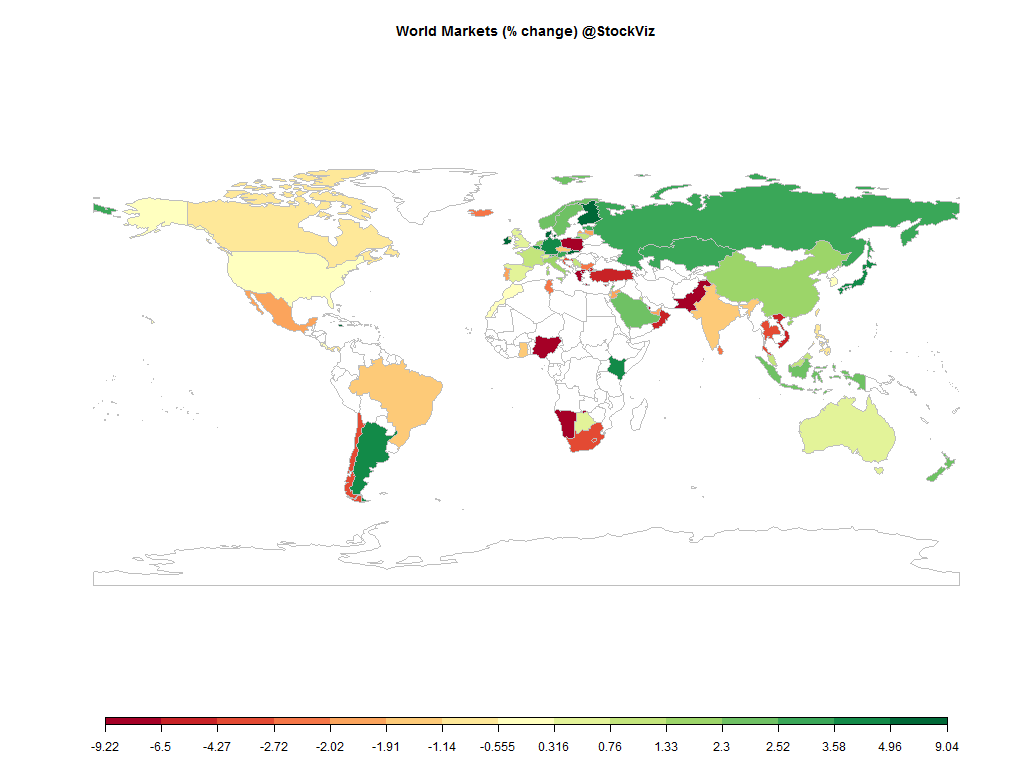
Equities
Commodities
| Energy |
| RBOB Gasoline |
-5.10% |
| Brent Crude Oil |
-11.02% |
| Ethanol |
-7.28% |
| Heating Oil |
-9.08% |
| Natural Gas |
-4.35% |
| WTI Crude Oil |
-11.31% |
| Metals |
| Silver 5000oz |
-8.39% |
| Gold 100oz |
-6.35% |
| Platinum |
-14.84% |
| Palladium |
-18.51% |
| Copper |
-10.39% |
| Agricultural |
| Cocoa |
+1.63% |
| Feeder Cattle |
-14.79% |
| Lean Hogs |
-1.22% |
| Orange Juice |
+5.55% |
| Sugar #11 |
+2.00% |
| Cattle |
-6.61% |
| Cotton |
-3.22% |
| Lumber |
-3.23% |
| Soybean Meal |
-5.11% |
| Wheat |
-11.24% |
| White Sugar |
+2.58% |
| Coffee (Arabica) |
-3.65% |
| Corn |
-3.66% |
| Coffee (Robusta) |
-7.95% |
| Soybeans |
+0.45% |
Credit Indices
| Index |
Change |
| Markit CDX EM |
+0.54% |
| Markit CDX NA HY |
-0.97% |
| Markit CDX NA IG |
+5.91% |
| Markit iTraxx Asia ex-Japan IG |
-1.93% |
| Markit iTraxx Australia |
+7.62% |
| Markit iTraxx Europe |
-0.81% |
| Markit iTraxx Europe Crossover |
-7.97% |
| Markit iTraxx Japan |
+9.43% |
| Markit iTraxx SovX Western Europe |
-0.27% |
| Markit LCDX (Loan CDS) |
-0.04% |
| Markit MCDX (Municipal CDS) |
-0.50% |
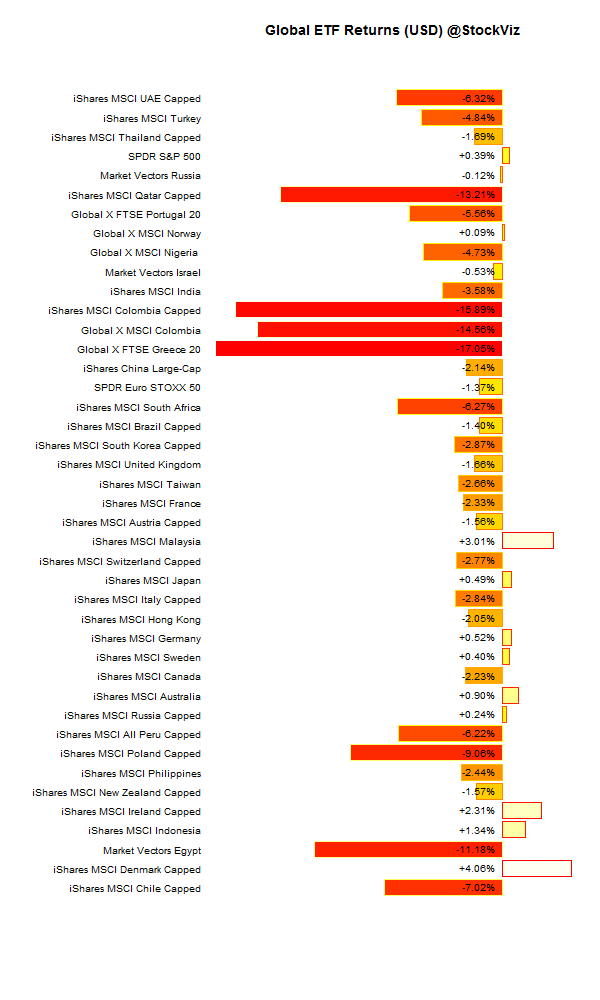
Most global indices ended the month in the red. The US Dollar rallied against most major currencies and the market seems to have come to terms with a December liftoff in US interest rates.
International ETFs (USD)
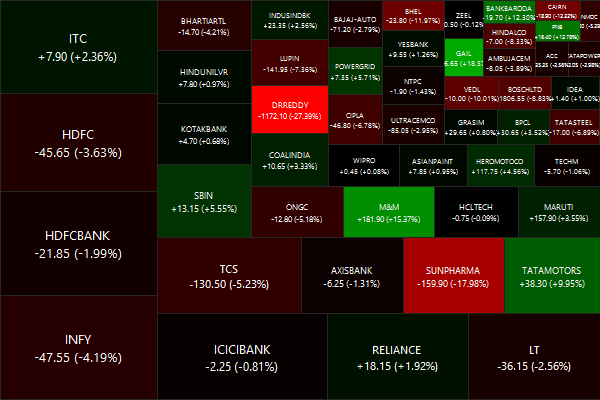
Nifty Heatmap
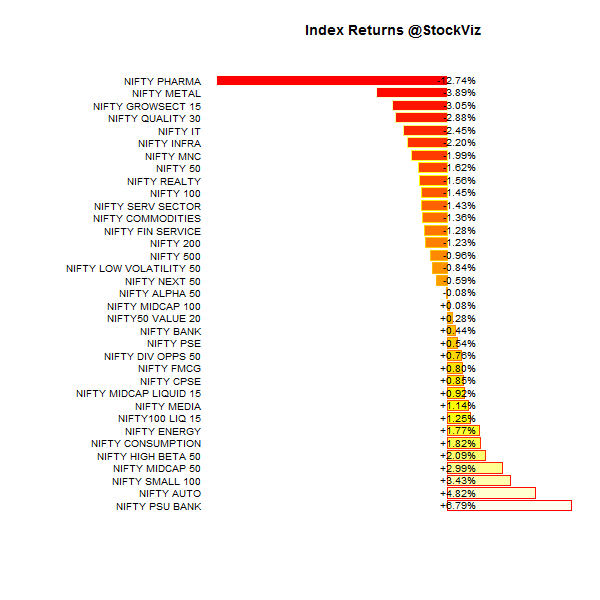
Index Returns
Market Cap Decile Performance
| Decile |
Mkt. Cap. |
Adv/Decl |
| 1 (micro) |
+9.56% |
68/67 |
| 2 |
+10.94% |
78/56 |
| 3 |
+9.16% |
78/56 |
| 4 |
+5.00% |
74/60 |
| 5 |
+4.13% |
84/50 |
| 6 |
+4.99% |
78/56 |
| 7 |
+2.13% |
71/63 |
| 8 |
+1.53% |
65/69 |
| 9 |
+0.87% |
67/67 |
| 10 (mega) |
-1.62% |
64/71 |
Large caps trailed mid and small caps…
Top Winners and Losers
Biggest moves where brought about by regulatory events…
ETF Performance
PSU Banks: dead cat bounce or are government efforts finally turning things around?
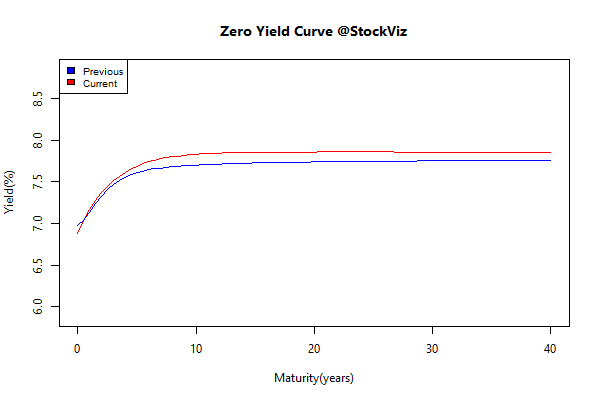
Yield Curve
Bond Indices
| Sub Index |
Change in YTM |
Total Return(%) |
| 0 5 |
+0.08 |
+0.38% |
| 5 10 |
+0.13 |
-0.07% |
| 10 15 |
+0.13 |
-0.28% |
| 15 20 |
+0.15 |
-0.83% |
| 20 30 |
+0.13 |
-0.72% |
Next rate cuts are probably six months away…
Investment Theme Performance
Most investment strategies did well… November saw Quality to Price post over +250% and Momentum post over +200% gains since their inception in August 2013.
Equity Mutual Funds
Bond Mutual Funds
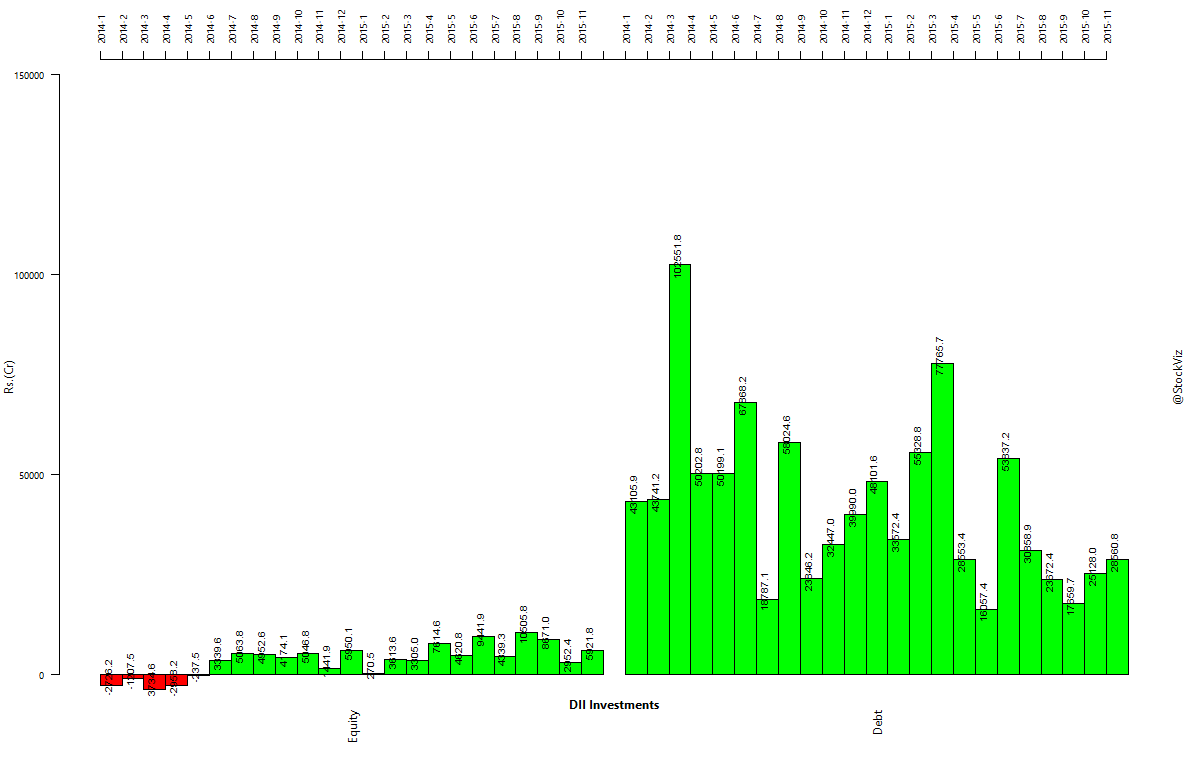
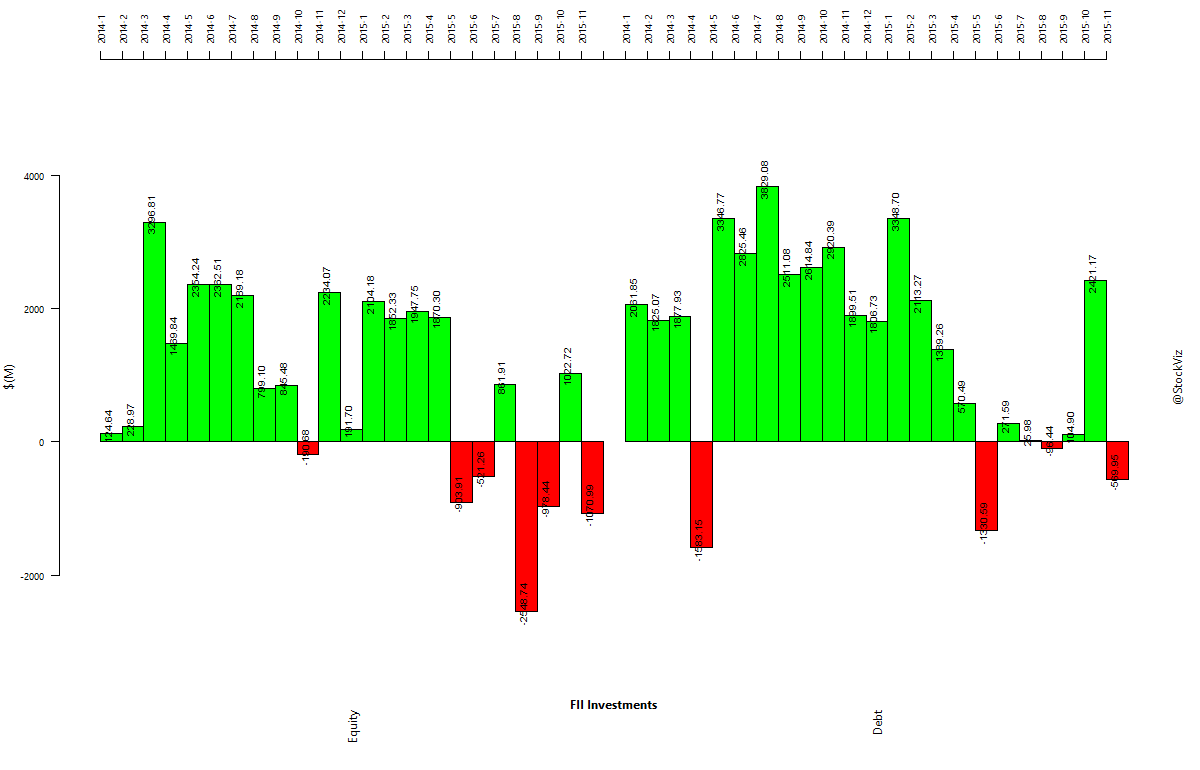
Institutional flows
FPIs sold off both bonds and equities…
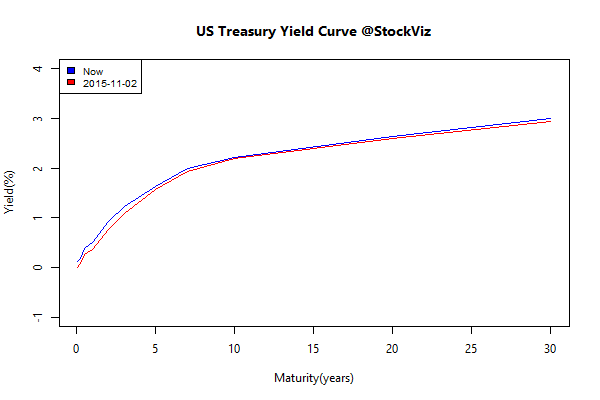
US Yield Curve
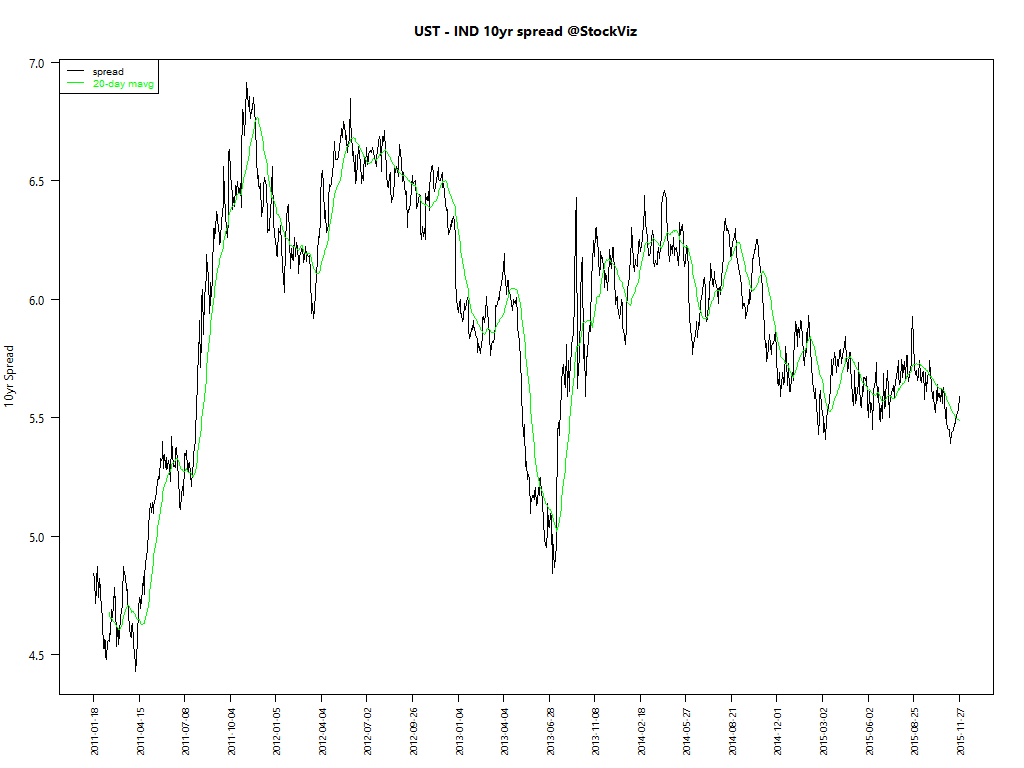
Spread between Indian and US long bonds
