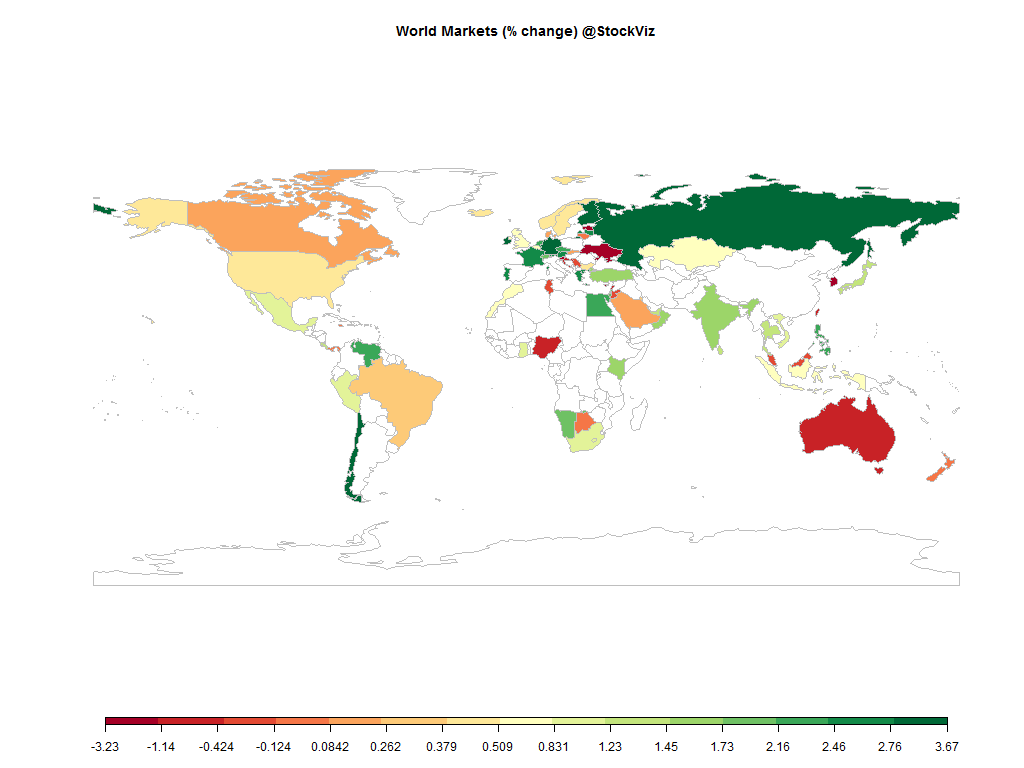
Equities
Commodities
| Energy |
| Brent Crude Oil |
-1.73% |
| Ethanol |
-8.18% |
| Heating Oil |
-0.90% |
| Natural Gas |
-5.58% |
| RBOB Gasoline |
-6.24% |
| WTI Crude Oil |
-1.13% |
| Metals |
| Copper |
+0.96% |
| Gold 100oz |
-1.59% |
| Palladium |
-0.87% |
| Platinum |
-1.15% |
| Silver 5000oz |
-2.05% |
| Agricultural |
| Cattle |
+3.42% |
| Cocoa |
-3.62% |
| Coffee (Arabica) |
+1.24% |
| Coffee (Robusta) |
+1.28% |
| Corn |
-4.01% |
| Cotton |
-1.55% |
| Feeder Cattle |
+3.42% |
| Lean Hogs |
+10.34% |
| Lumber |
-0.83% |
| Orange Juice |
-0.73% |
| Soybean Meal |
+1.53% |
| Soybeans |
+0.98% |
| Sugar #11 |
-3.65% |
| Wheat |
-4.14% |
| White Sugar |
-2.32% |
Credit Indices
| Index |
Change |
| Markit CDX EM |
-0.35% |
| Markit CDX NA HY |
-0.23% |
| Markit CDX NA IG |
+0.85% |
| Markit CDX NA IG HVOL |
+0.36% |
| Markit iTraxx Asia ex-Japan IG |
-4.93% |
| Markit iTraxx Australia |
-1.97% |
| Markit iTraxx Europe |
+0.18% |
| Markit iTraxx Europe Crossover |
-0.53% |
| Markit iTraxx Japan |
-3.44% |
| Markit iTraxx SovX Western Europe |
+0.00% |
| Markit LCDX (Loan CDS) |
+0.00% |
| Markit MCDX (Municipal CDS) |
+0.00% |
The energy complex took a major hit this week. While most investors were worried about inflation, it turns out that most central banks are barely winning the war against deflation. The ECB announced their version of Quantitative Easing, the missed employment numbers pushed rate hikes in the US farther out. And it looks like money continued to pour into equities.
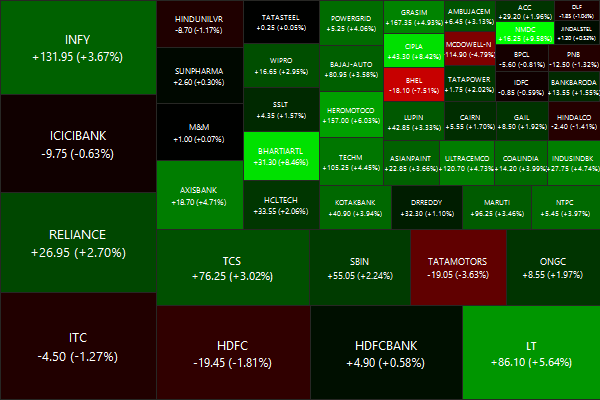
Nifty Heatmap
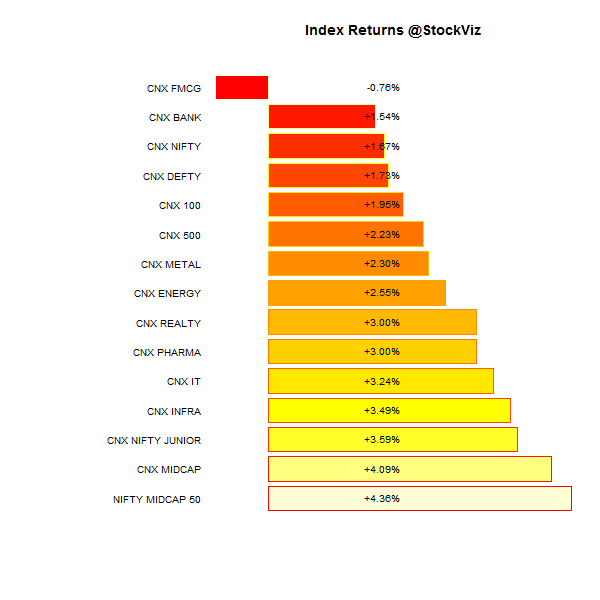
Index Returns
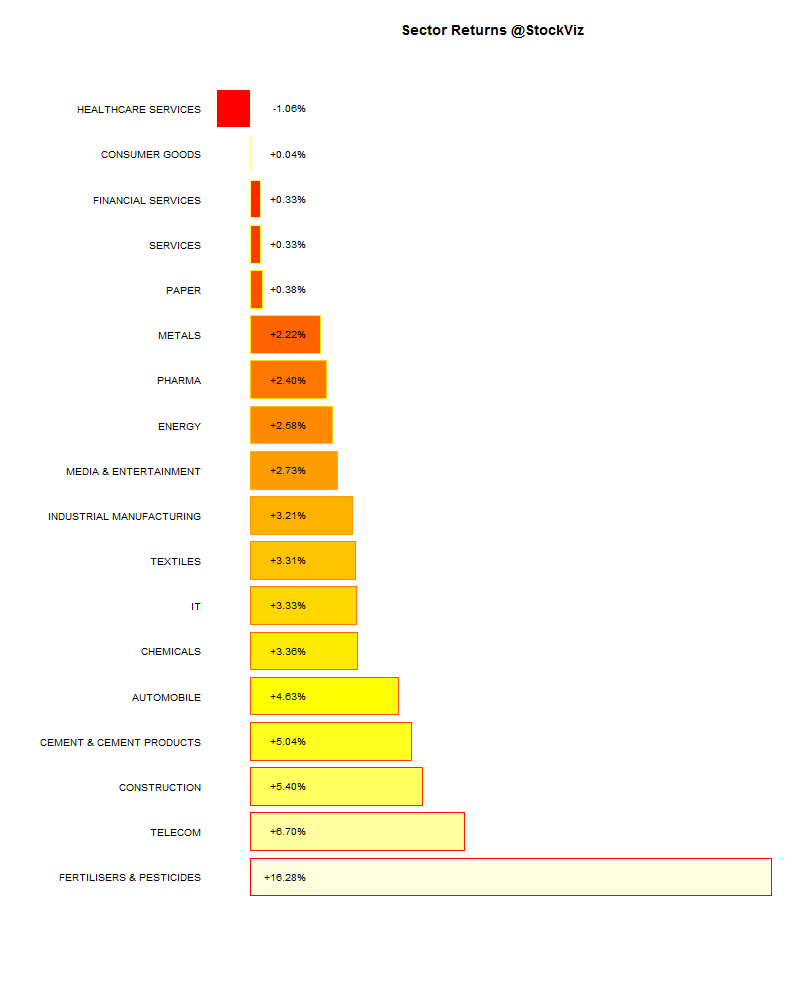
Sector Performance
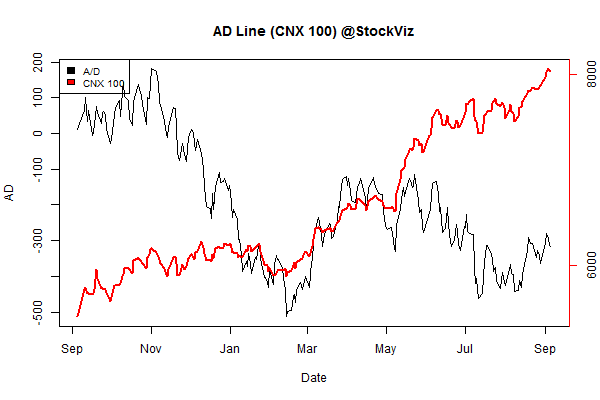
Advance Decline
Market Decile Performance
| Decile |
Mkt. Cap. |
Adv/Decl |
| 1 (micro) |
+1.33% |
67/71 |
| 2 |
+4.14% |
73/64 |
| 3 |
+3.09% |
75/62 |
| 4 |
+4.68% |
72/65 |
| 5 |
+4.56% |
72/64 |
| 6 |
+4.59% |
79/59 |
| 7 |
+3.92% |
77/60 |
| 8 |
+3.25% |
70/67 |
| 9 |
+3.46% |
67/70 |
| 10 (mega) |
+2.07% |
70/68 |
Midcaps outperformed large caps after spending nearly a month in the doghouse…
Top winners and losers
Who put Tata Chemicals up there? And what’s up with UPL? FII’s can’t even buy the stock…
ETFs
No love for gold… equities FTW!
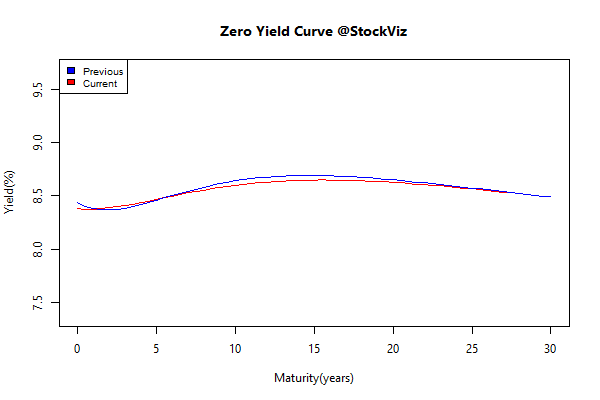
Yield Curve
Bond Indices
| Sub Index |
Change in YTM |
Total Return(%) |
| GSEC TB |
+0.01 |
+0.18% |
| GSEC SUB 1-3 |
-0.10 |
-0.15% |
| GSEC SUB 3-8 |
+0.35 |
-1.15% |
| GSEC SUB 8 |
+0.23 |
-1.42% |
Is the long-end reverting?
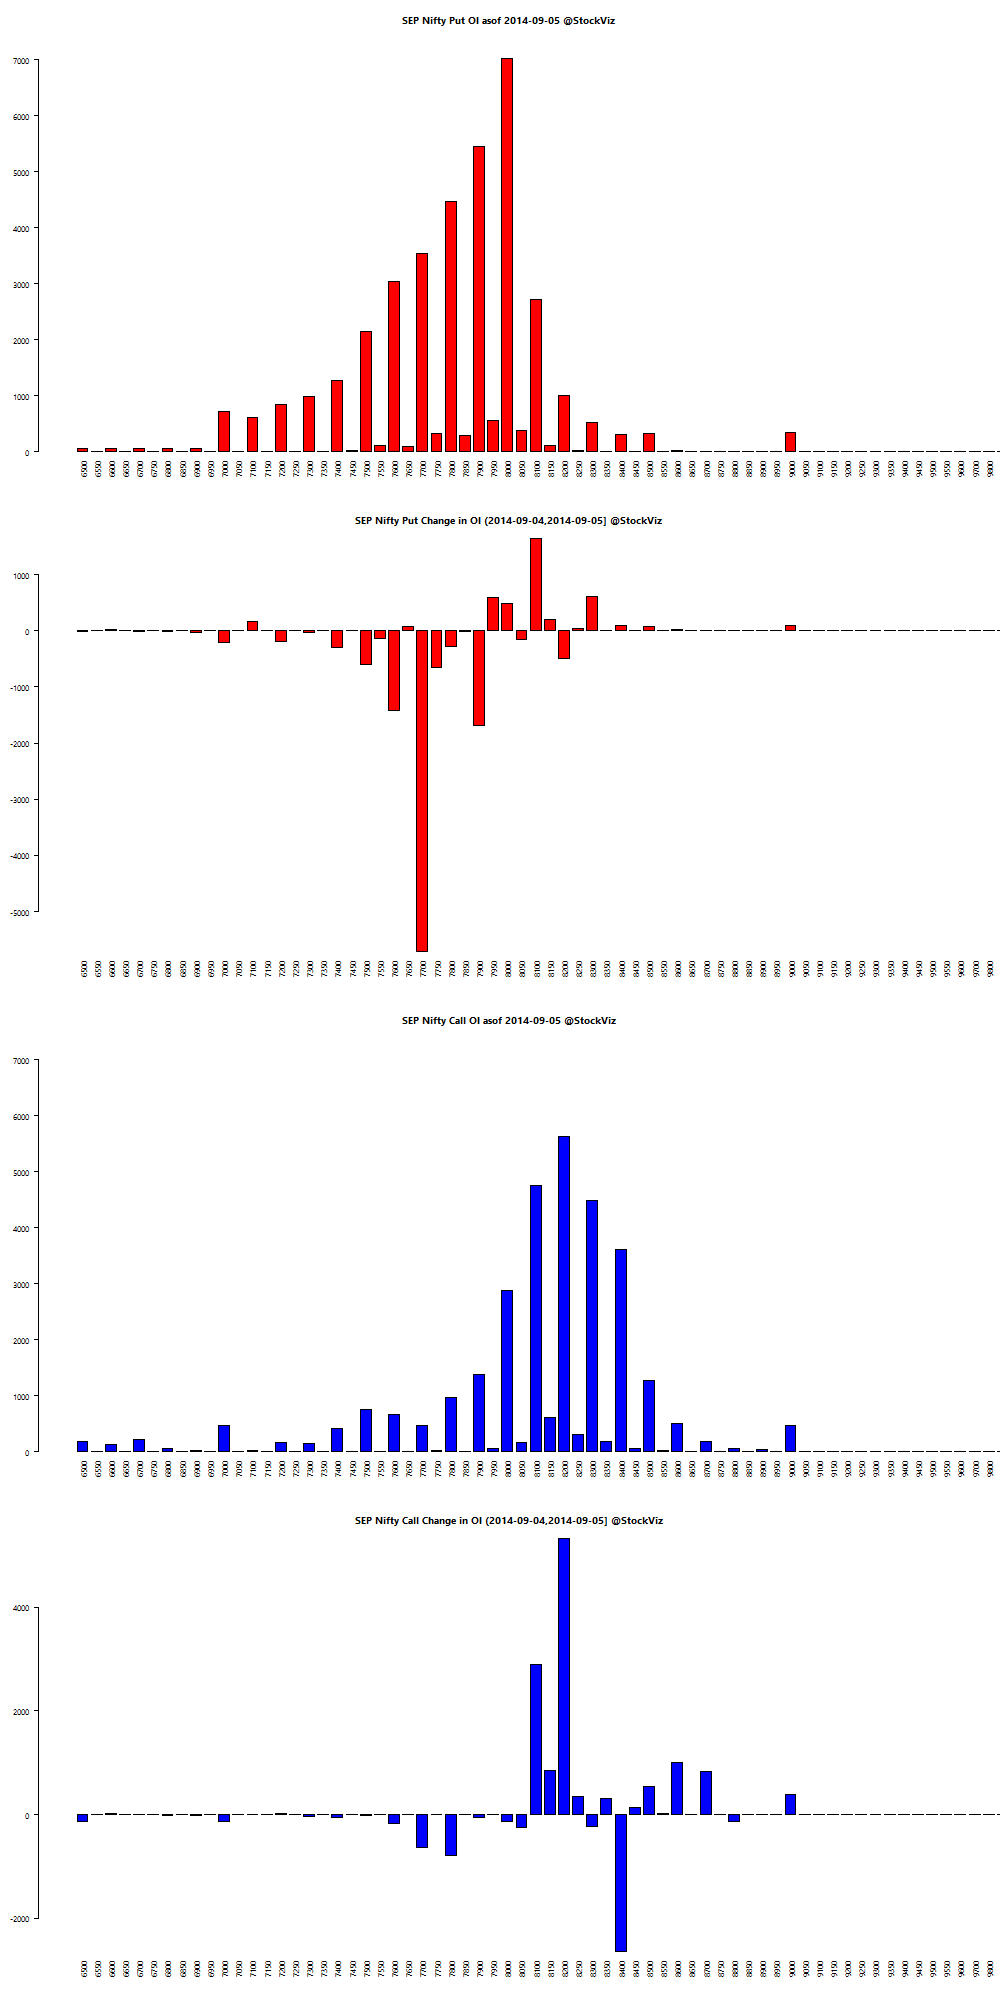
Nifty OI
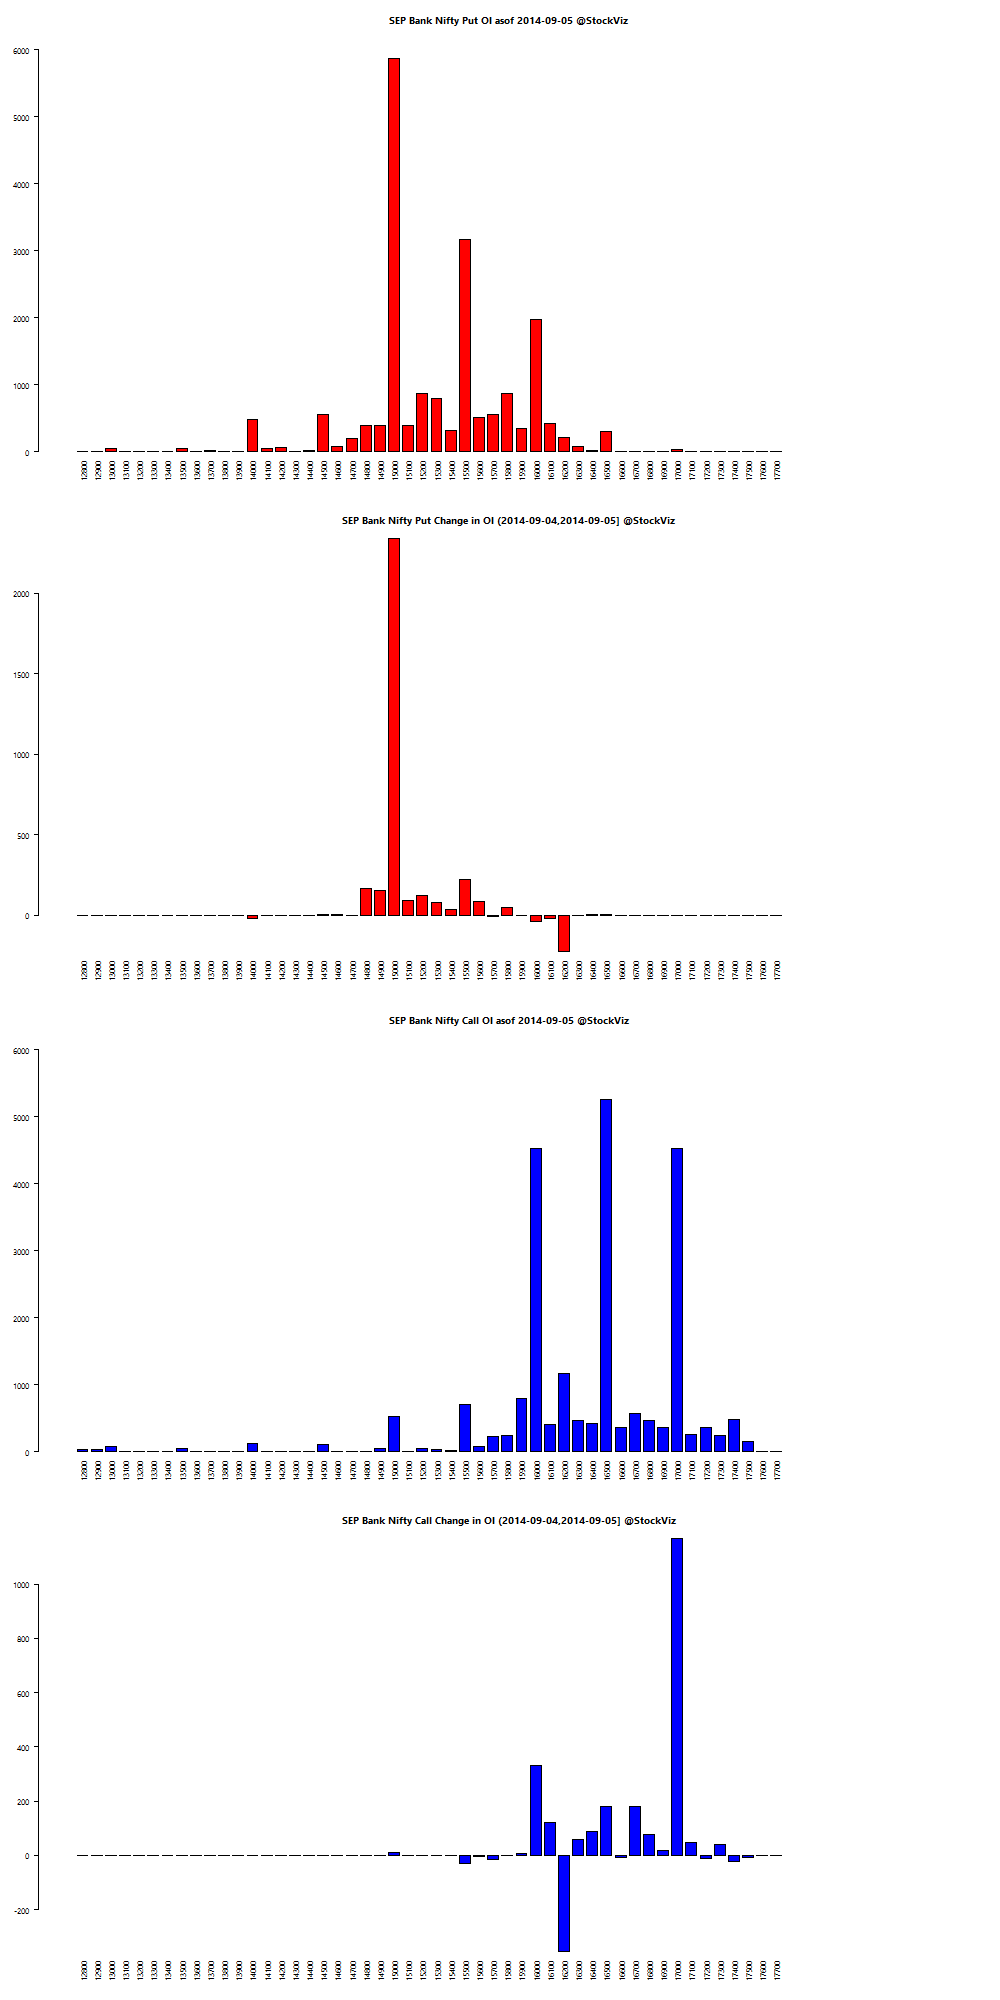
Bank Nifty OI
Thought for the weekend
Most investment policies today are Big Bets on world peace. The history of the 20th Century has shown that previously dominant empires can fall. In 1899, which was 15 years before the start of World War I, the Major Powers were:
- Britain
- Germany
- France
- Austro-Hungary
- Russia
Here’s the cumulative return of a dollar invested in Austro-Hungarian market:
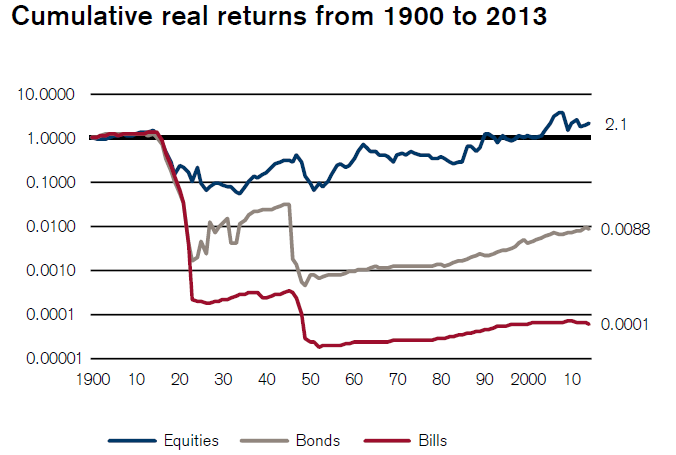
Britain was a dominant global power at the dawn of the 20th Century. The real return on $1 invested in British equities in 1899 is $372. France returned $36 in the same period. The US? $1,248. And the US was still a promising emerging market country at that time (as was Argentina.)
If you wanted to project equity risk and return expectations, what figure would you use? The US 1,248 real return, the British 372 or the French 36 real return figure?
Source: The One Big Bet made by most buy-and-hold portfolios


