Category: News

Ranking and Visualizing Model Performance Metrics

On StockViz, we have over 50 quantitative models that are available for investing. They all have different risk and return profiles. It is fairly simple to pull up, say, the Sharpe Ratio of a particular model by navigating to its home page. However, it doesn’t say how it compares to all the other models we have going.

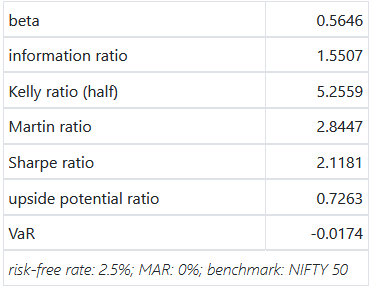
Let’s say you are looking to invest in one of our “Rapid-fire” Momo strategies. Our oldest ones are Relative, Velocity and Acceleration. Their (gross) performance metrics are displayed in a table.

Relative
Velocity
Acceleration

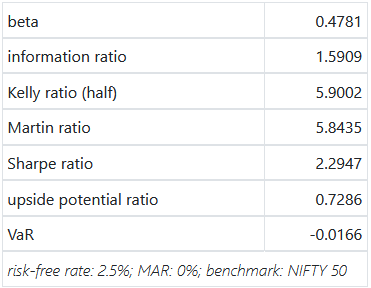
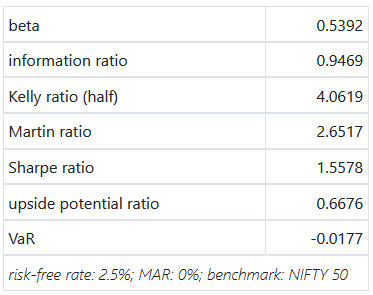
If you add net performance metrics into the mix, you’ll end up with a combinatorial explosion. How do you pick the “best” one of them to invest in?

Enter Radar Charts.

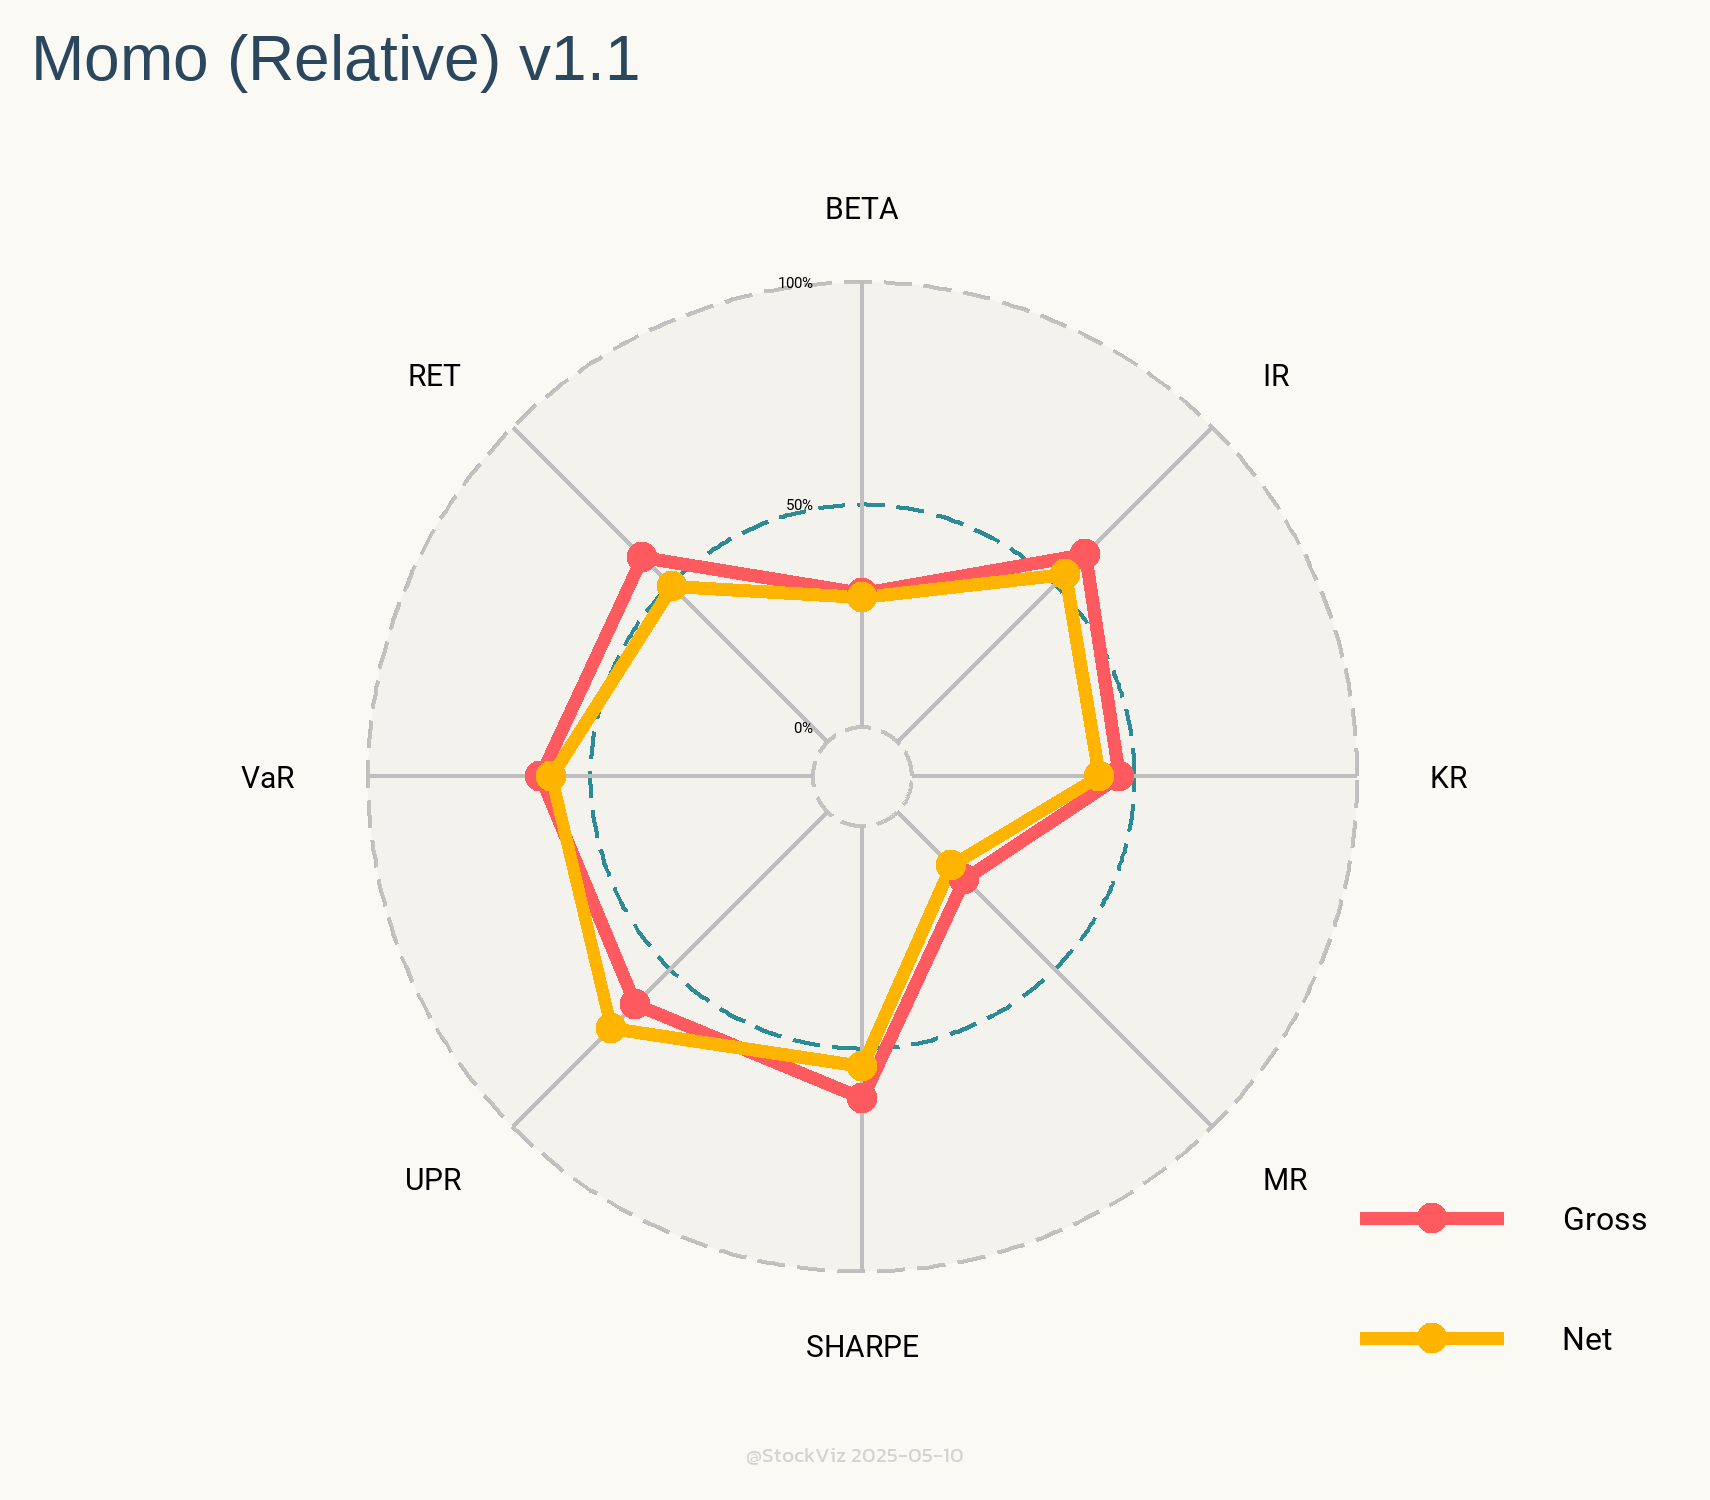
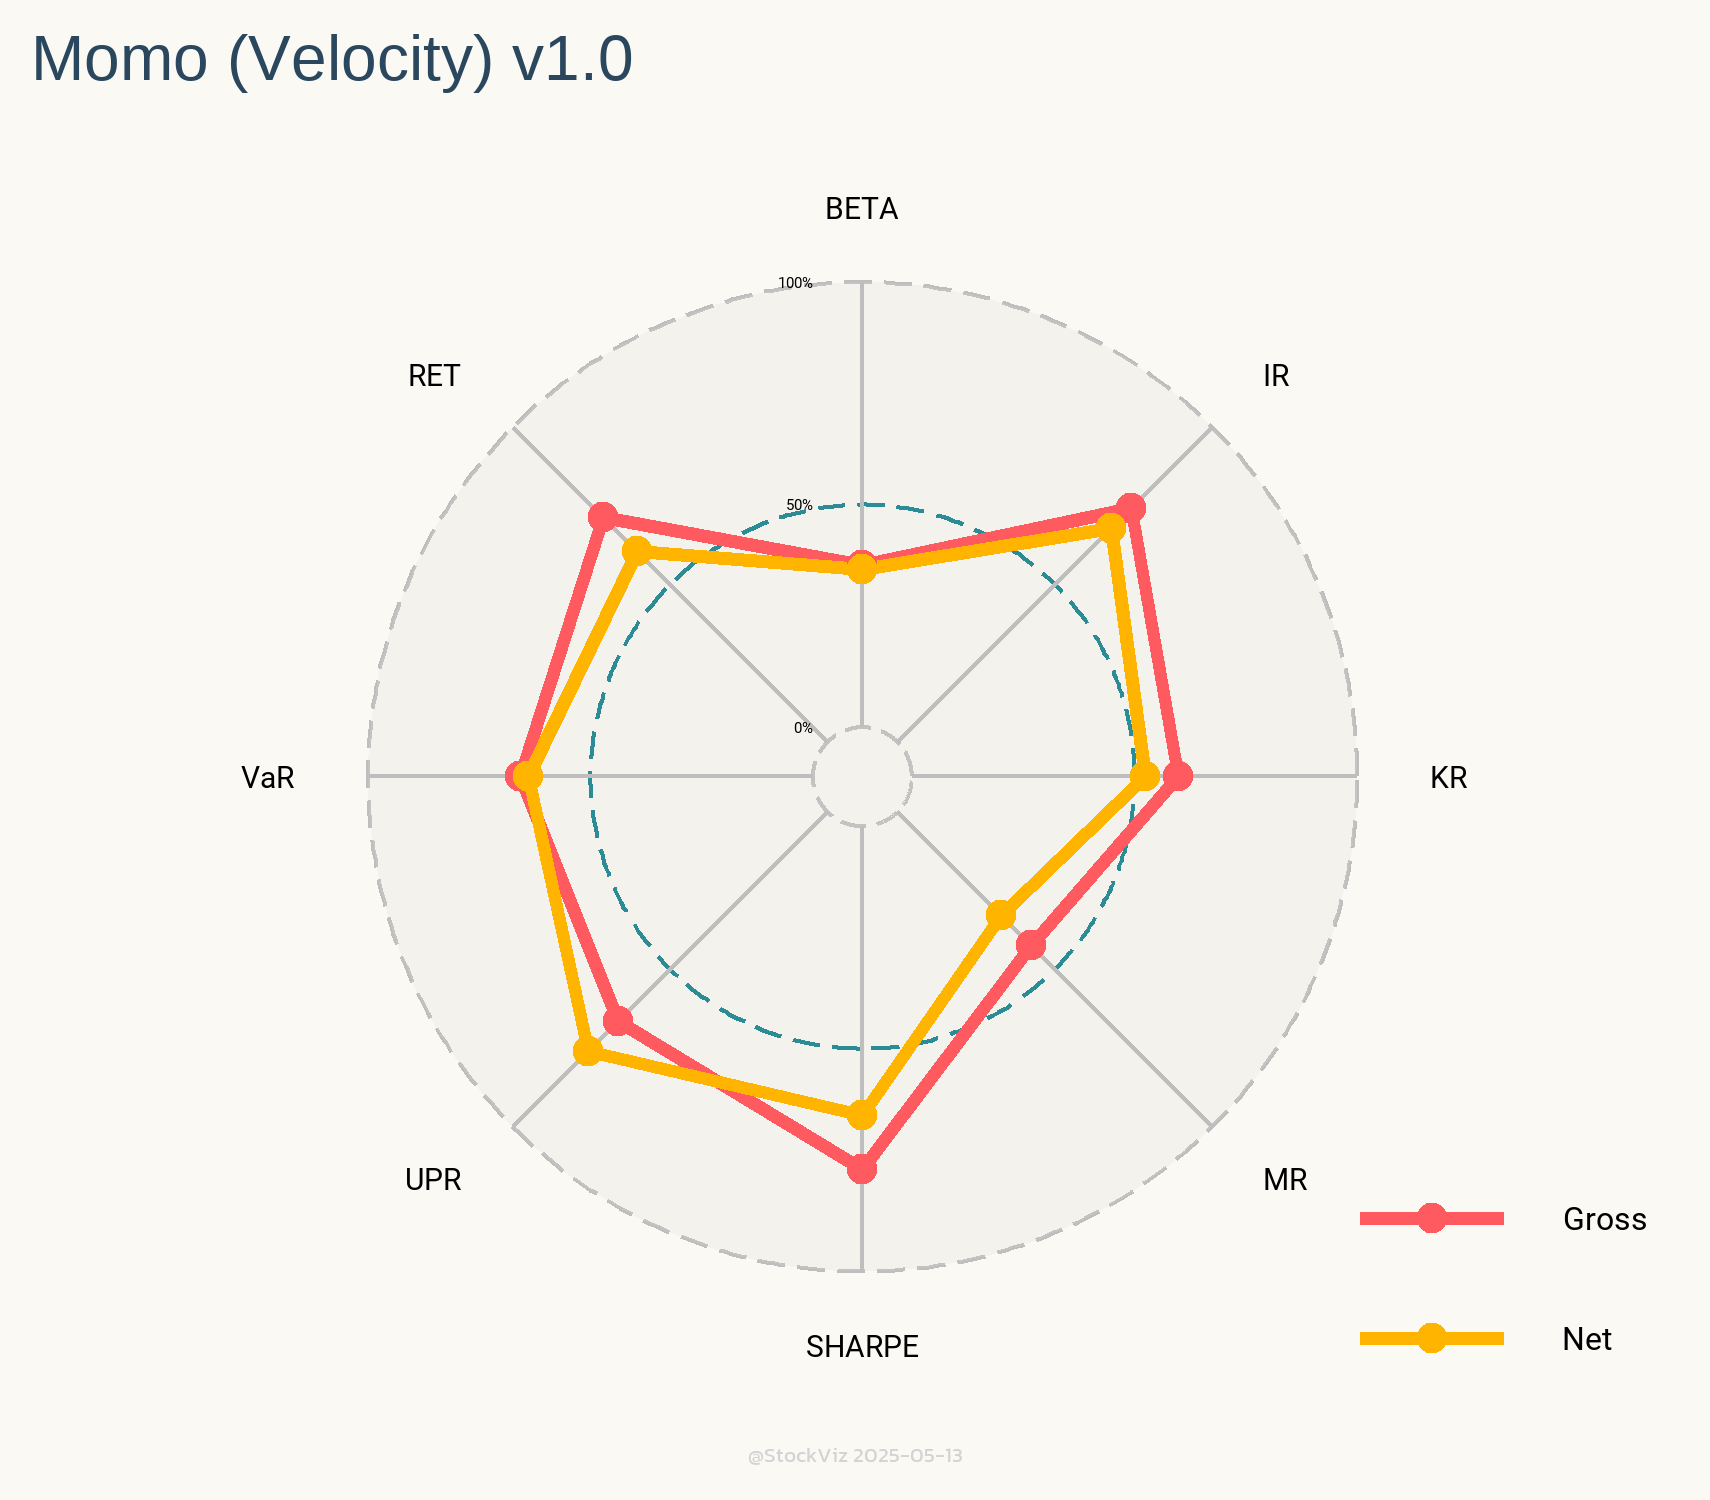
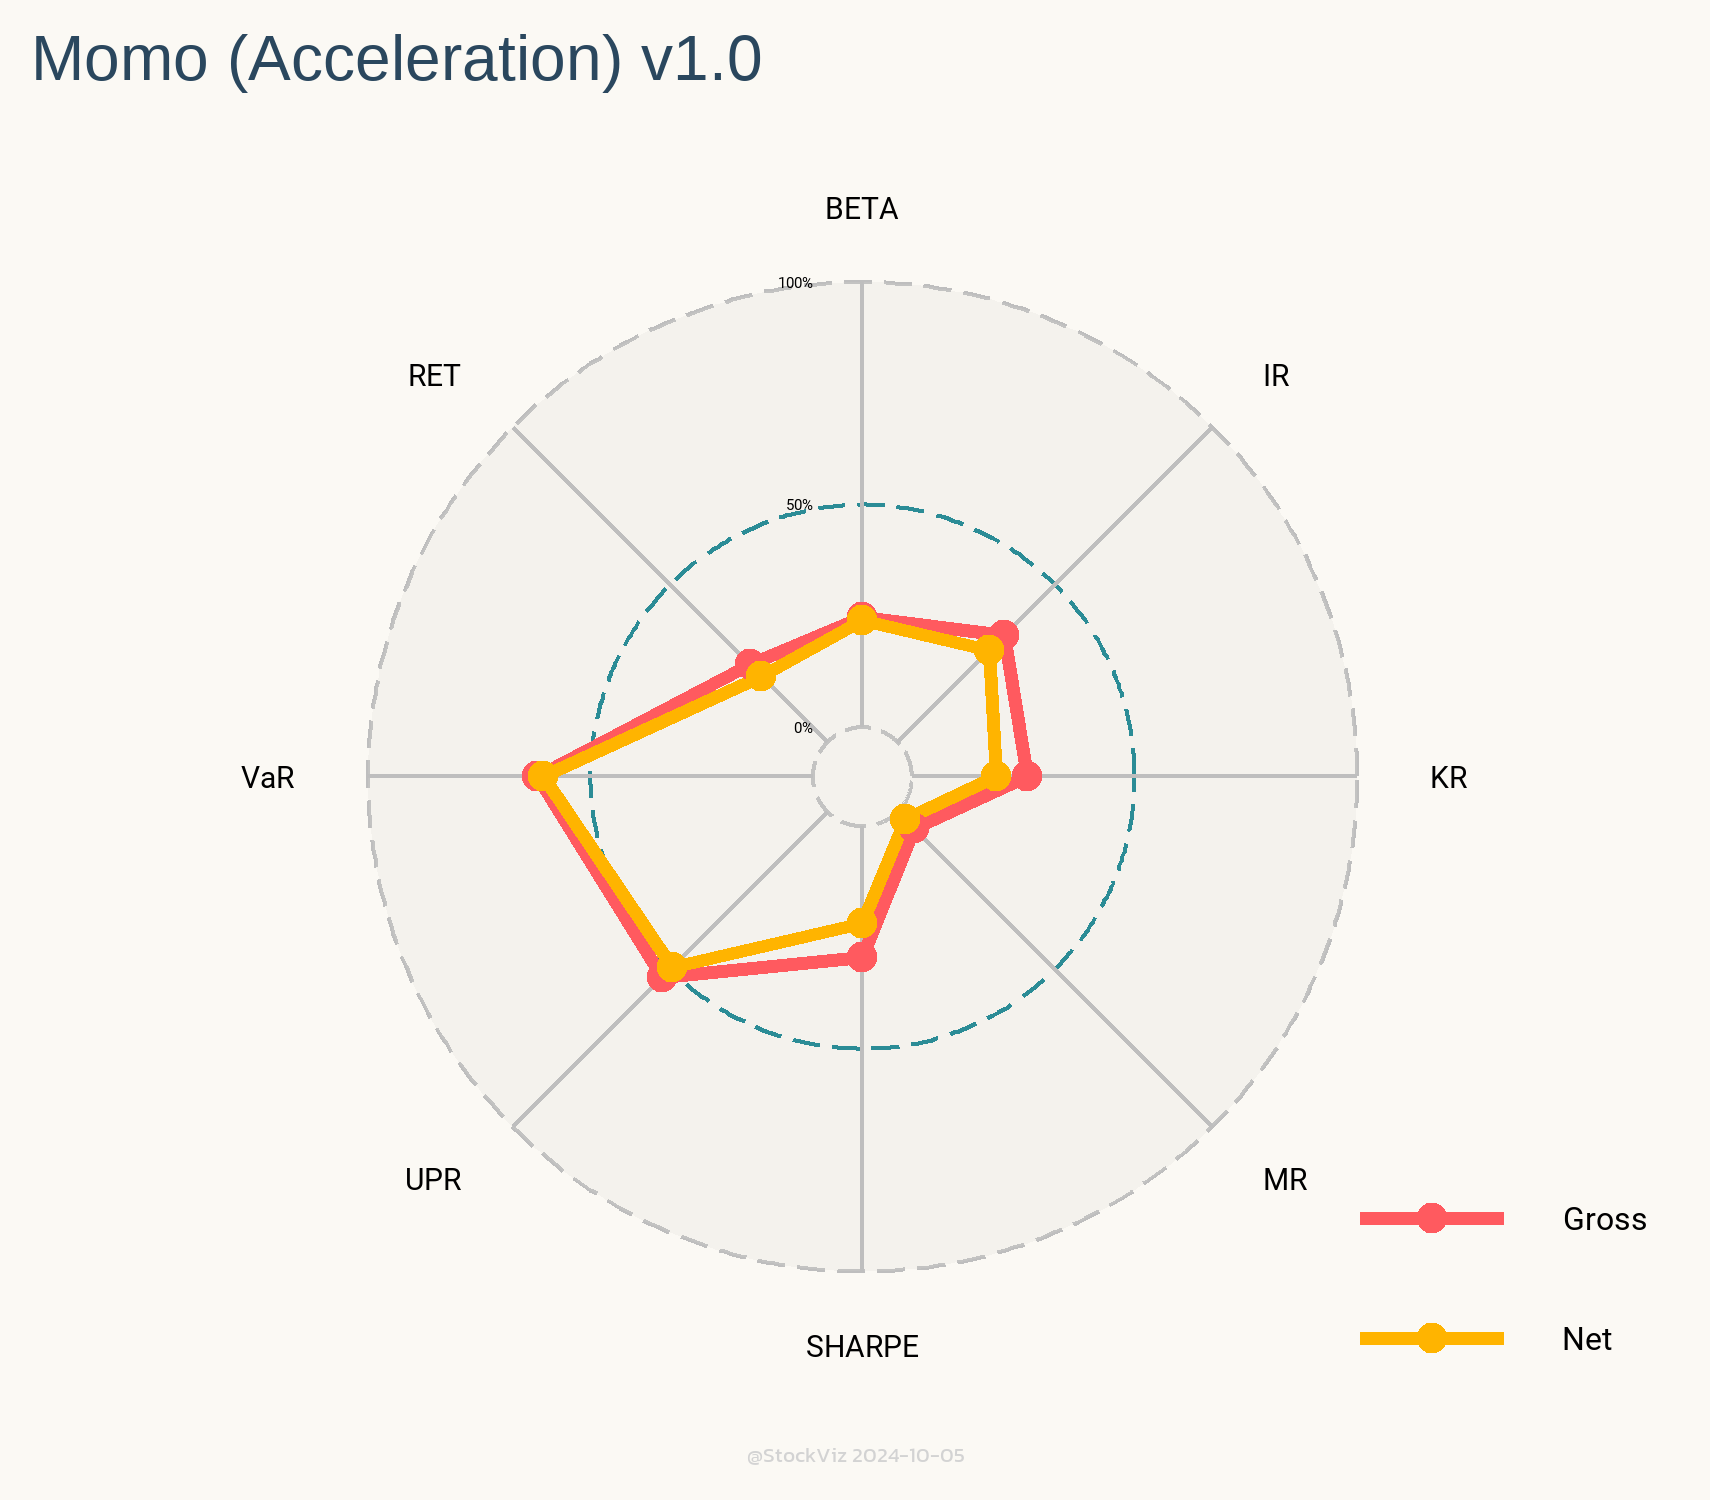
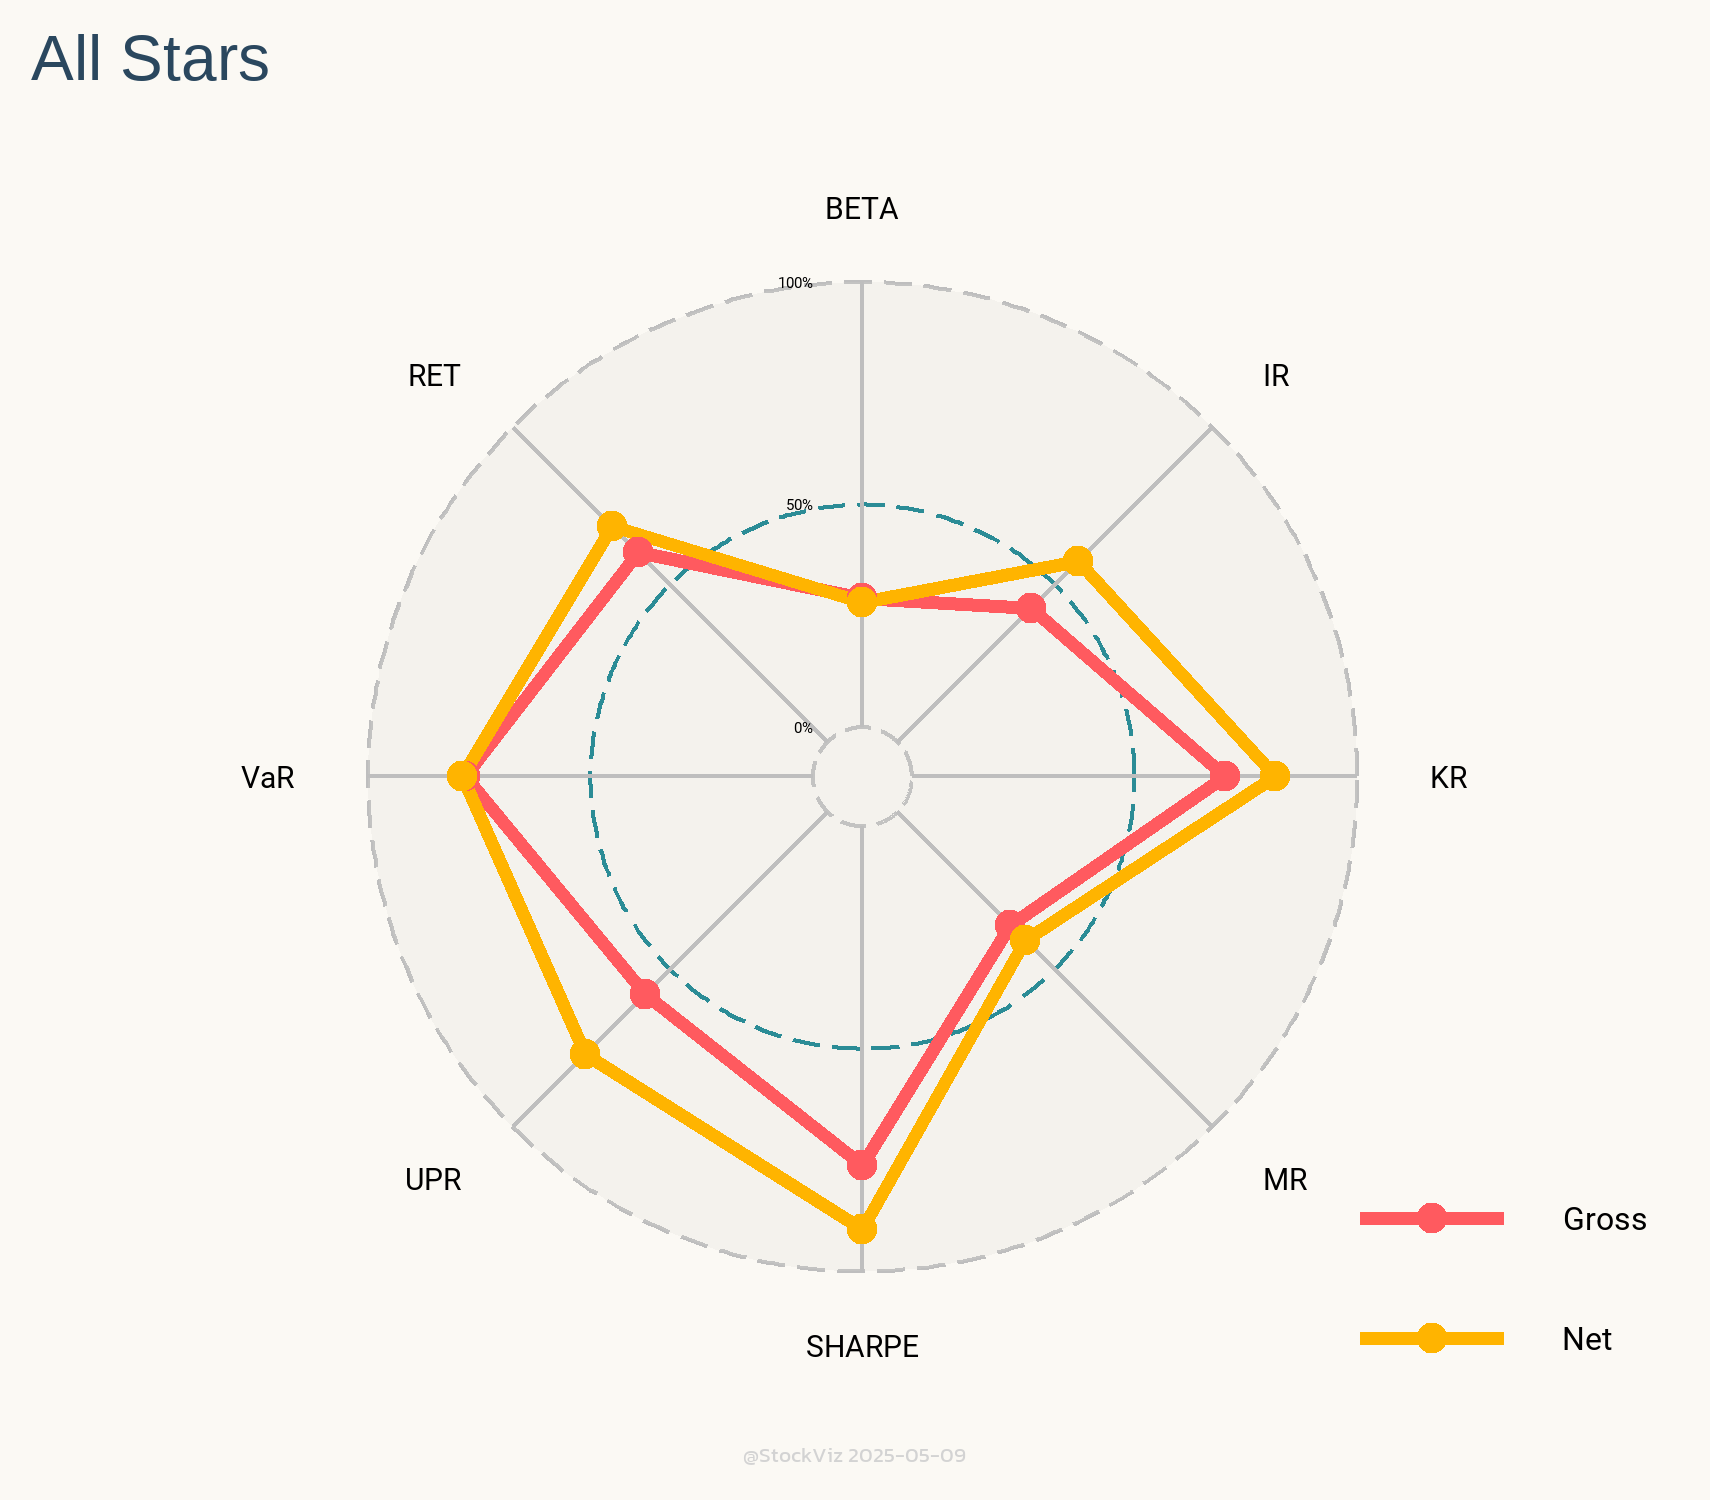
These charts show you the relative rank of each of these models against all the other 50+ models we have going. Intuitively, larger the area under the yellow (net) lines, better the model.

The only caveat with these Radars is that you should compare them against models of similar vintage. For example, we went live with our All Star momentum model in May 2020. Since then, the market regime has been extremely favorable to momentum strategies. It should come as no surprise that its Radar looks like the Queen’s Crown.

With that caveat out of the way, Radars are a great way to visualize how models square up against each other.

StockViz is now encrypted

SSL

SSL (Secure Sockets Layer) is the standard security technology for establishing an encrypted link between a web server and a browser. This link ensures that all data passed between the web server and browsers remain private and integral. SSL is an industry standard and is used by millions of websites in the protection of their online transactions with their customers. (ssl.com)

https You may have noticed the ‘lock’ icon in your browser address bar followed by ‘https://’ – this indicates that the communication between your browser and the StockViz server is encrypted.

Mixed content

https2
Although everything that is coming from StockViz is encrypted, we depend on external vendors who do not support SSL. Besides, all of our old blog post images are un-encrypted. When both encrypted and un-encrypted data is supplied to your browser, you will get a “mixed content” warning.

You can ignore this warning – both Chrome and Firefox don’t make a big deal out of it. However, Internet Explorer users may face annoying warning messages.

Internet Explorer

IE users will need to go to Internet Options -> Security -> Custom Level -> Display mixed Content and select ‘Enable’

ie mixed content setting

If you run into any issues, send us a WhatsApp or email us.

Your Portfolio Correlations

We often like to quote Howard Marks before we begin any discussion on diversification:

If you concentrate your portfolio, your mistakes will kill you;
If you diversify, the payoff from your successes will be diminished.

Irrespective of what your preference is, you can now track it on StockViz. Head over to Portfolio and click on ‘Analytics.’ You should see one-year and one-month correlation charts of your portfolio right away. These are updated overnight.

Here’s how my one-month correlation chart looks like. How does yours look like?

Correlation between Theme components

If you concentrate your portfolio, your mistakes will kill you;
If you diversify, the payoff from your successes will be diminished.
-Howard Marks

Investors can now look at the correlation (over one-year and one-month horizons) between stocks that make up an investment ‘Theme’ strategy. For example, here’s how the one-year correlation of the Financial Strength Value Theme looks like:

one year correlation

A lot of thick blue squares mean that positive correlations are high. Red squares mean negative correlations are high. Whites are the doldrums.

Happy Sankranti and Pongal!

Alerts through PushBullet

StockViz Alerts

This would have happened to us more than once: you like a stock, but you don’t like its price. You come up with a level at which you would buy it and then… forget all about it. Never again!

You can now subscribe to price alerts for Indices, ETFs and stocks by clicking on the orange ‘Alert’ button on their pages.

alerts

Manage your alerts

You can manage your alerts by navigating to the ‘Alerts’ tab on your ‘Portfolio’ page. Make sure you check the ‘Notify me via PushBullet’ box.

alerts2

Setup PushBullet

Go to PushBullet.com and sign in with the same email address that you use for your StockViz account. And voila! Whenever your alerts are triggered, you will receive a notification on all the devices that you have PushBullet installed! Ain’t that cool!