There are a number of ways in which you can allocate funds (weigh) the stocks in your portfolio. The simplest of them are equal-weight and market-cap weight.
In an equal-weight portfolio, all stocks get the same allocation. If you have 20 stocks, then each stock would have a 5% weight in the portfolio. So the WAVG capitalization of these portfolios end up skewing towards mid/small caps within the portfolio.
In a cap-weight portfolio, each stock gets an allocation based on its market-capitalization. So large-cap stocks get a large weight and smaller-cap stocks get a smaller weight.
The advantage of a cap-weight portfolio is that unless you want to change the constituents, you don’t have to do anything. The individual weights will be always tracking their corresponding market-caps. But in an equal-weight portfolio, you need to rebalance once a month/quarter to bring back all the constituents to their original weights. You will be selling your winners to add to your losers.
Needless to say, the all-in cost of maintaining an equal-weight portfolio will be more than that of a cap-weigh portfolio. Is it worth it?
The American Experience
For the US markets, lucky for us, Wilshire Indices has index data covering both the market-cap and equal-weight versions of the same portfolio starting from 1970. And the over-all out-performance of the equal-weight portfolio looks spectacular.
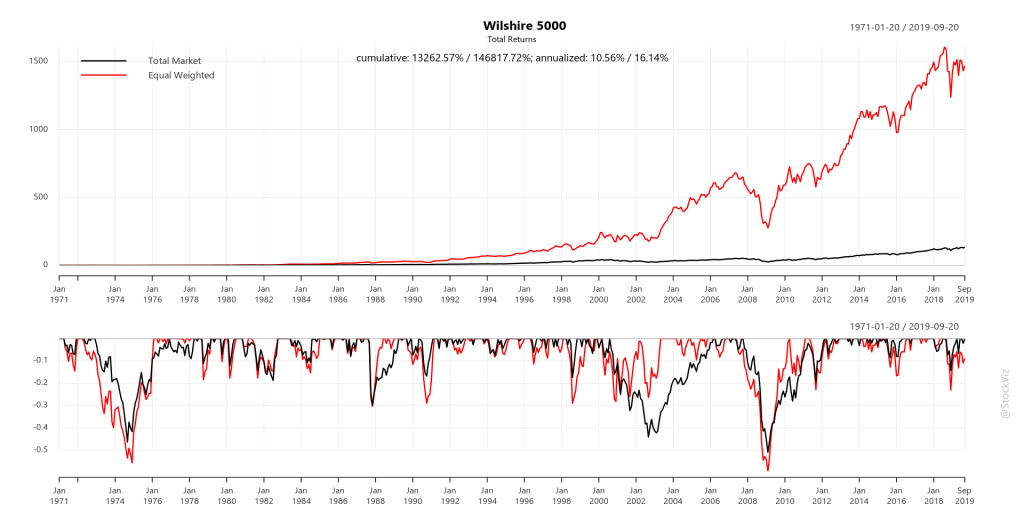
Whenever you see out-performance like this, you have to keep in mind that it is usually a combination of investor behavior and investment risk.
The reason why an investment strategy out-performs could be because it is prone to long draw-downs followed by large, but short-lived, upswings. Investors flood into the strategy during the upswing, only to exit during the soul-crushing drawdown. Happens in value and momentum investing a lot.
The second reason why something works is because of higher volatility. Stocks are more volatile than bonds so over a long enough period of time, they out-perform them.
To visualize if investor behavior is driving out-performance, you can look for the swings in annual returns and periods for which the strategy under-performs its benchmark.
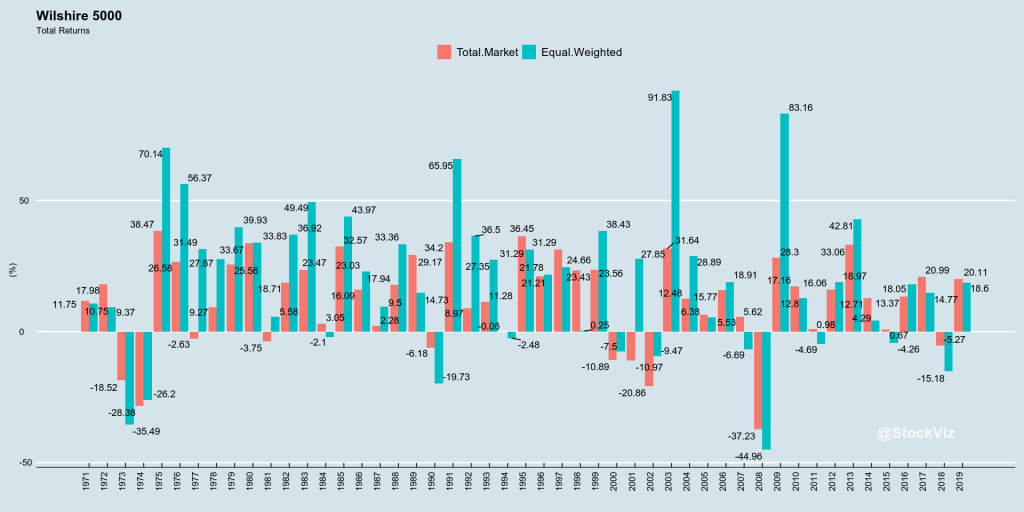
The equal-weighted index also has a larger standard-deviation (a measure of volatility) ~6% compared to ~4.4% of the market-cap index.
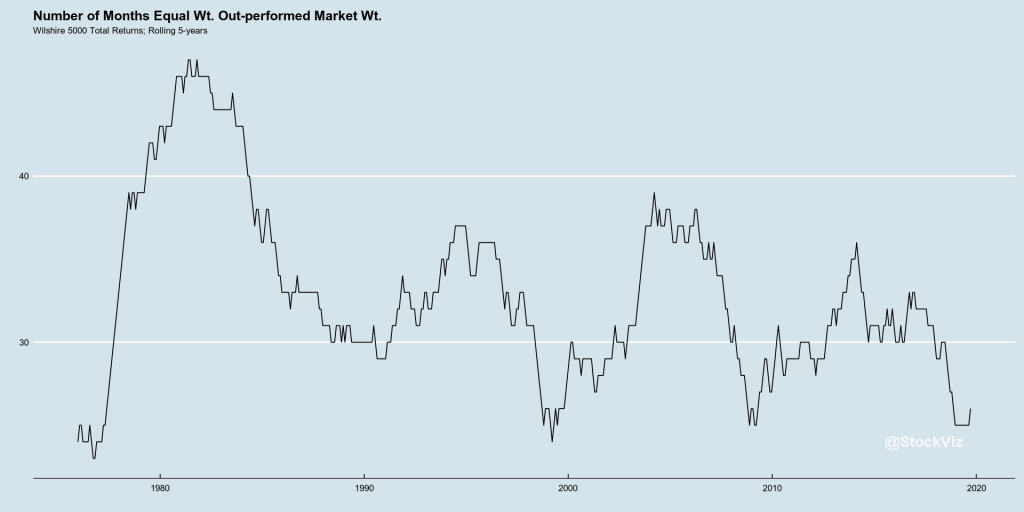
In short, equal-weighted portfolios are more volatile and there are significant periods where they under-perform their cap-weighted cousins in the short-term. This results in a larger probability of adverse investor behavior, partly explaining the out-performance over a longer period of time.
However, we don’t live in the 70’s anymore. The market structure has evolved. Costs have come down drastically and more investors are aware of the equal-weight strategy. If you think liquidity is thin in small-cap stocks today, it was impossible to trade them 20 years ago unless your uncle ran a brokerage firm. So some of the earlier-period excess returns are only theoretical – you could not implement this strategy even if you knew about it.
So, is it still a free-lunch? One way to visualize this is to plot the Information Ratio of the equal-weight returns over that of market-cap returns.
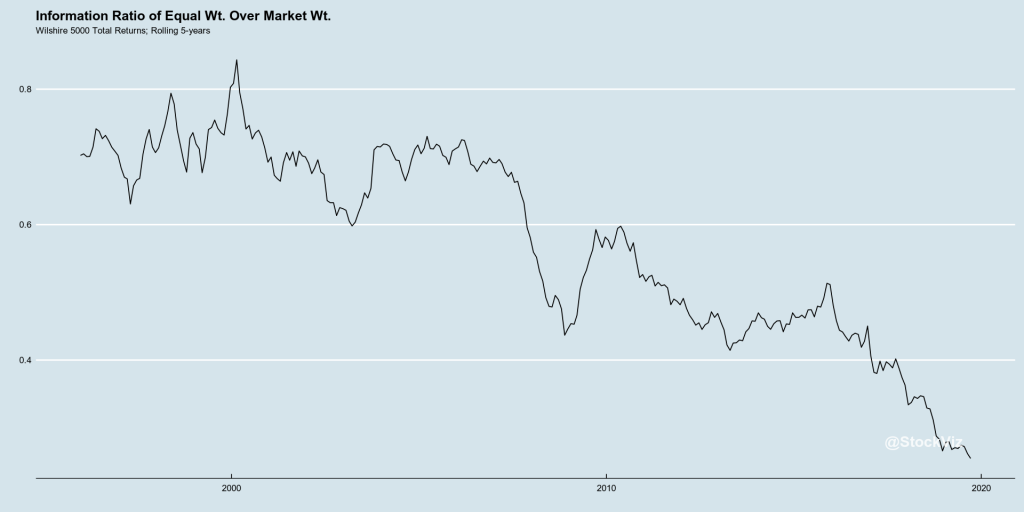
Equal-weight, as a strategy, has been losing its mojo and maybe, its best days are behind it. Excess returns could be entirely explained by higher risk.
The Indian Experience
It maybe too early for a large commitment to equal-weight portfolios in India.
First, India has a Securities Transaction Tax of 0.1% on the total notional amount traded. So, a market-cap weight portfolio that is rebalanced twice a year will have a far lower cost than an equal-weight portfolio that is rebalanced every month.
Second, there is no liquidity beyond the top 70-100 names by market-cap. So one cannot create an equal-weight version of the NIFTY 500 index. An equal-weighted NIFTY 50 is probably the only version that makes sense if you want to reduce impact costs. NIFTY 100 is the second-best option.
If you go with NIFTY 50, an equal weight portfolio of 50 stocks means than each stock has a 2% weight. Since you are constantly selling winners and buying losers, low dispersion in returns between their returns will have a big impact on the relative performance of the equal-weighted portfolio over its cap-weighted cousin.
For example, YESBANK, at its peak, had a 1.74% weightage in the NIFTY 50. And its recent troubles have brought it down to about 0.18%. In the equal-weighted NIFTY 50, this would have been a constant 2% through-out. Not exactly participating fully in the up-side but doubling down on the down-side.
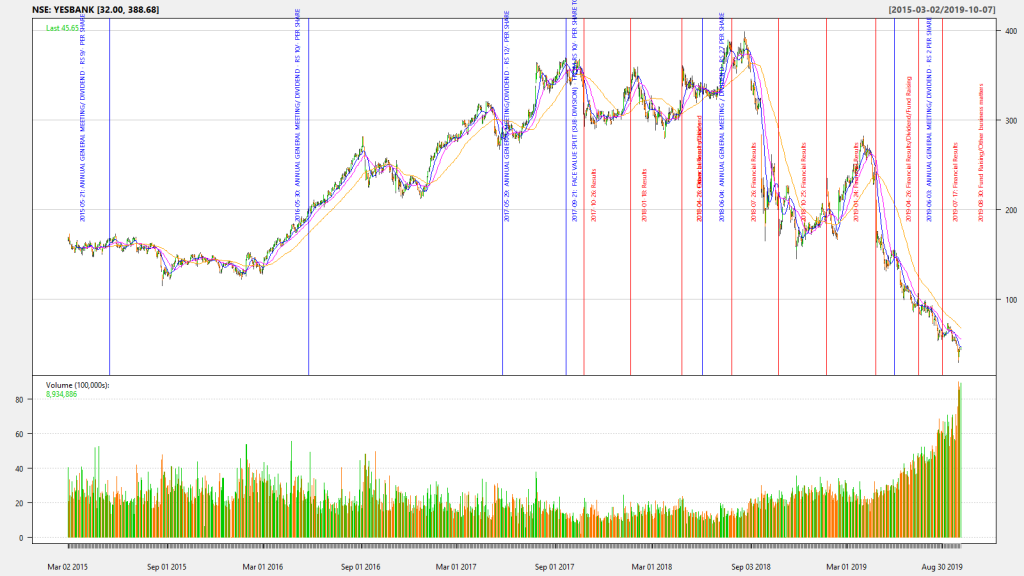
YESBANK wouldn’t have been a big problem if we were equal-weighting the NIFTY 500. But it is a problem with NIFTY 50.
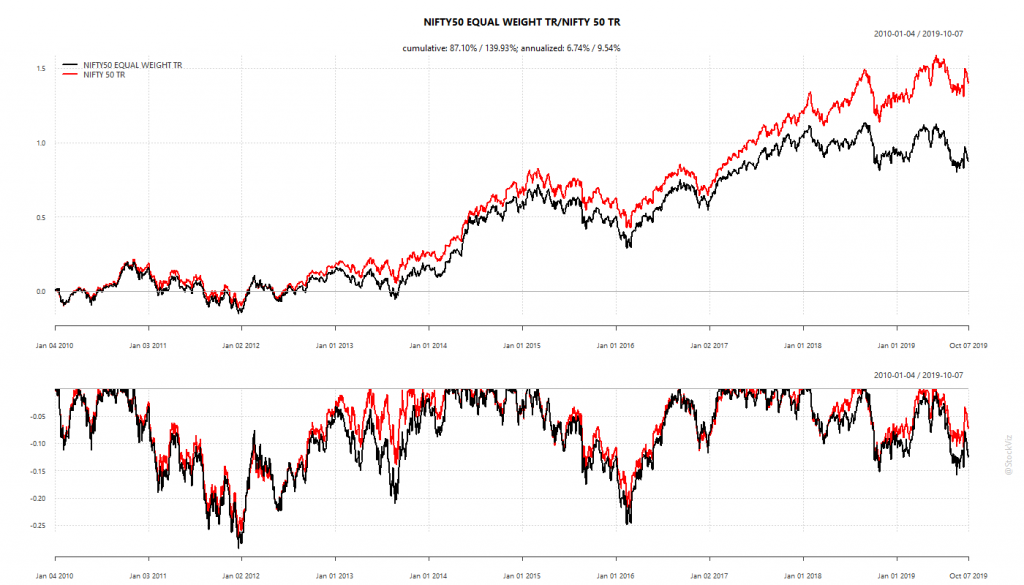
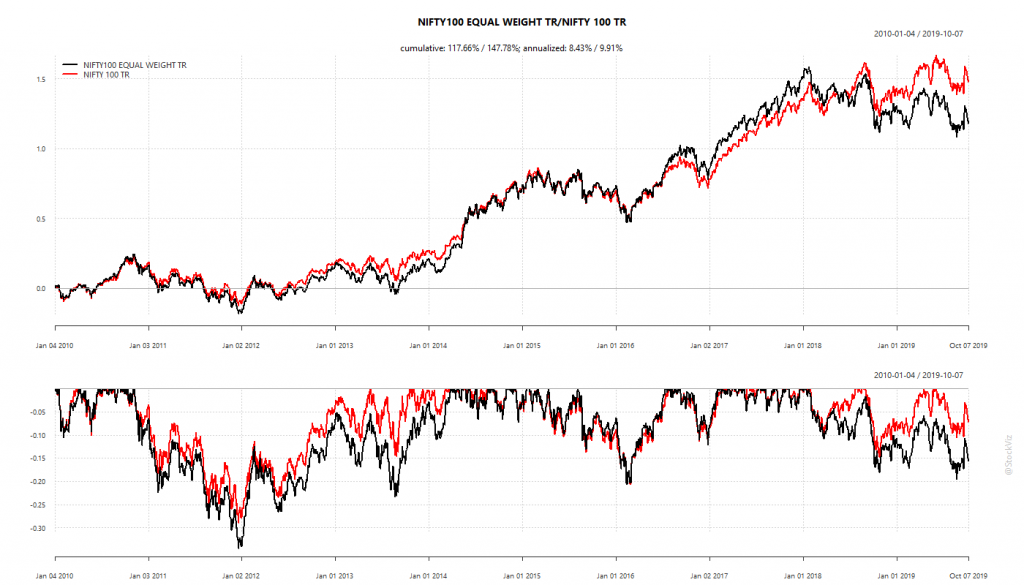
As expected, the gap between NIFTY 50 equal/cap is huge compared to that between NIFTY 100 equal/cap.
Conclusion
- Equal-weighting may not be “free lunch.” Excess returns are could mostly be explained by higher risk.
- Makes sense only on large portfolios. Maybe 500 stocks is the magic number.
- We wary of costs.
Reference
Questions? Slack me!