Previously, we looked at a dip buying strategy based on how low an index is trading below its peak. We now run some numbers against another popular strategy: the SMA crossover.
Introduction
Everybody wants to buy markets that are trending up. When a lower SMA (say, 3-day) crosses an upper SMA (say, 200-day) an uptrend is identified. What if one only buys when such a crossover occurs? What if one accumulates cash otherwise and collects interest while waiting for such crosses?
The following chart shows the periods in which NIFTY is below the upper SMA in red. Purchases are shown as green dots.

Here’s the one for the small-cap index:

Results
We calculate the min, max and mean difference in the final amount of the index accumulated over rolling 5-year periods. The second column in the table below is the lower SMA used in the cross-over.
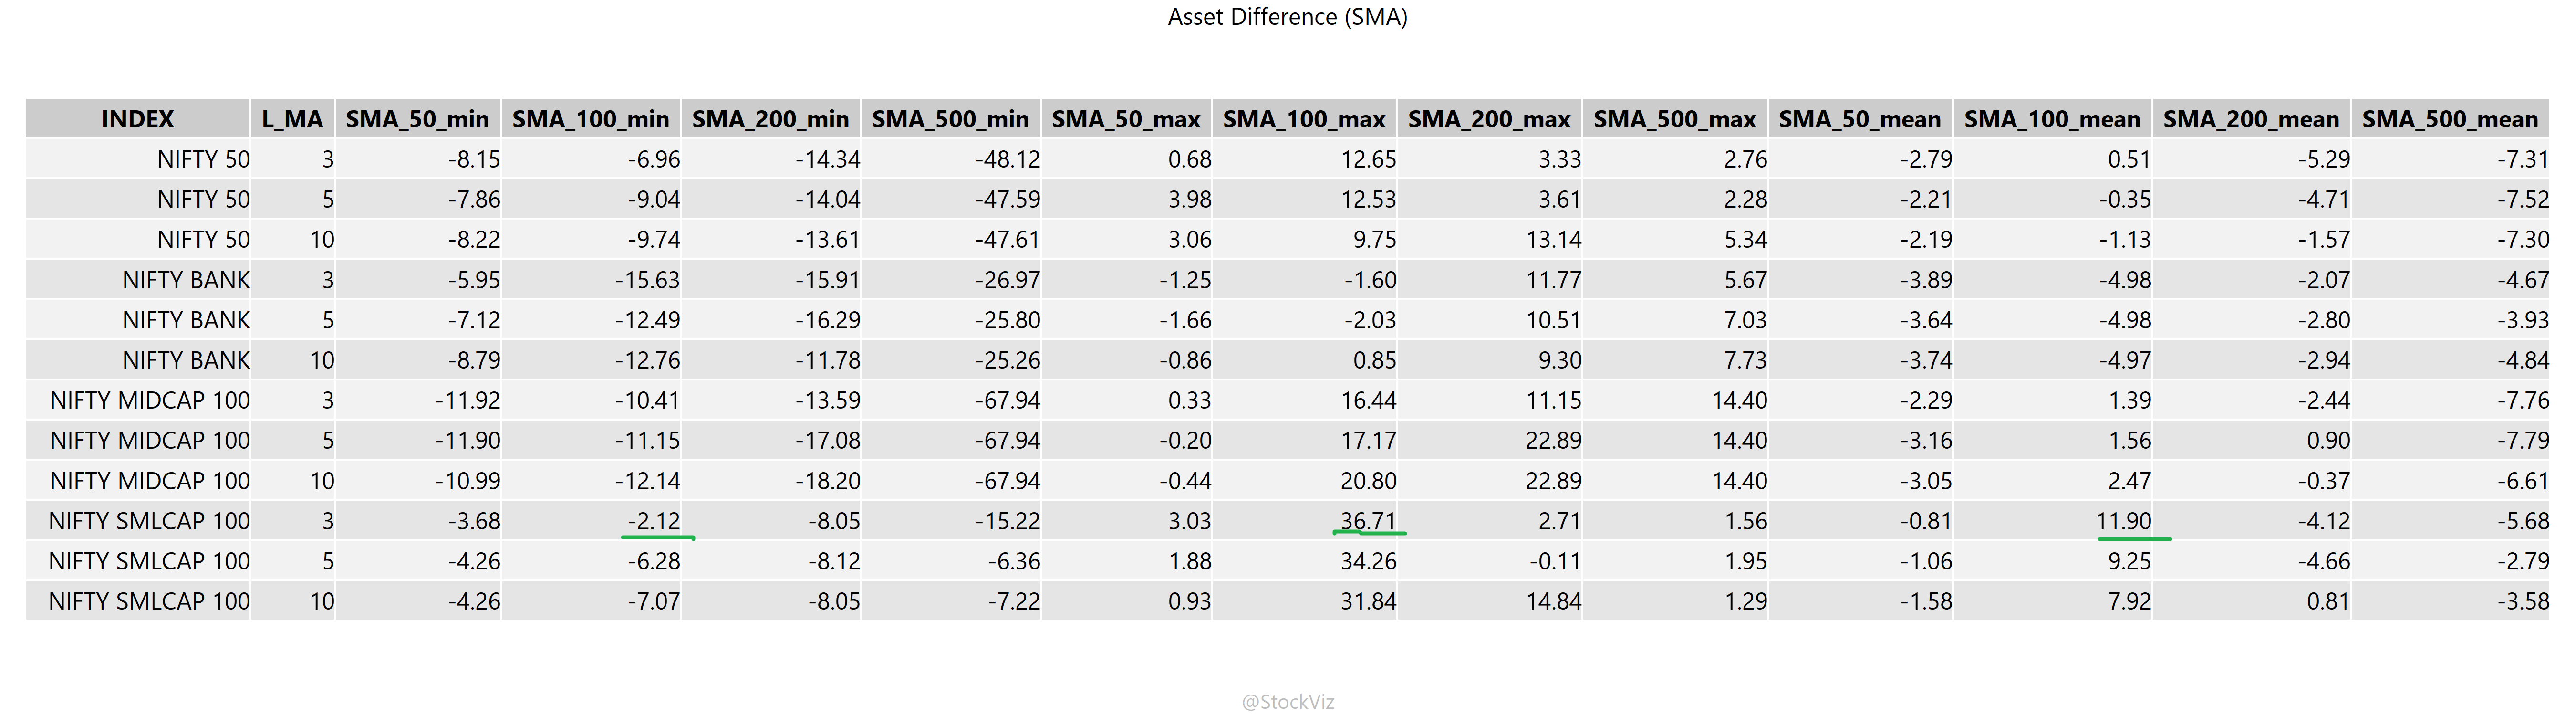
When it comes to small-caps, there are some configurations where, on average, the cross-over strategy accumulates more assets. However, investors are taking a risk where they could encounter 5-year periods where there is a shortfall in assets by an equal amount.
Waiting for the dip using this strategy is not a good idea compared to a simple daily SIP.
Note that we define success as the terminal value of the number of units of the index purchased. This is different from each unit being profitable.
Code is on github.