How did diversification across Midcap equity, bonds and gold work out for Indian investors over the last 10 years? Not too shabby, as it turns out:
Combined portfolio – Annualized: 12.16%; Max drawdown: -42.42%
Gold only portfolio – Annualized: 9.69%; Max drawdown: -21.49%
Equity only portfolio – Annualized: 12.55%; Max drawdown: -59.39%
Bond only portfolio – Annualized: 7.99%; Max drawdown: -8.52%
*Not including transaction charges/taxes.
The Setup
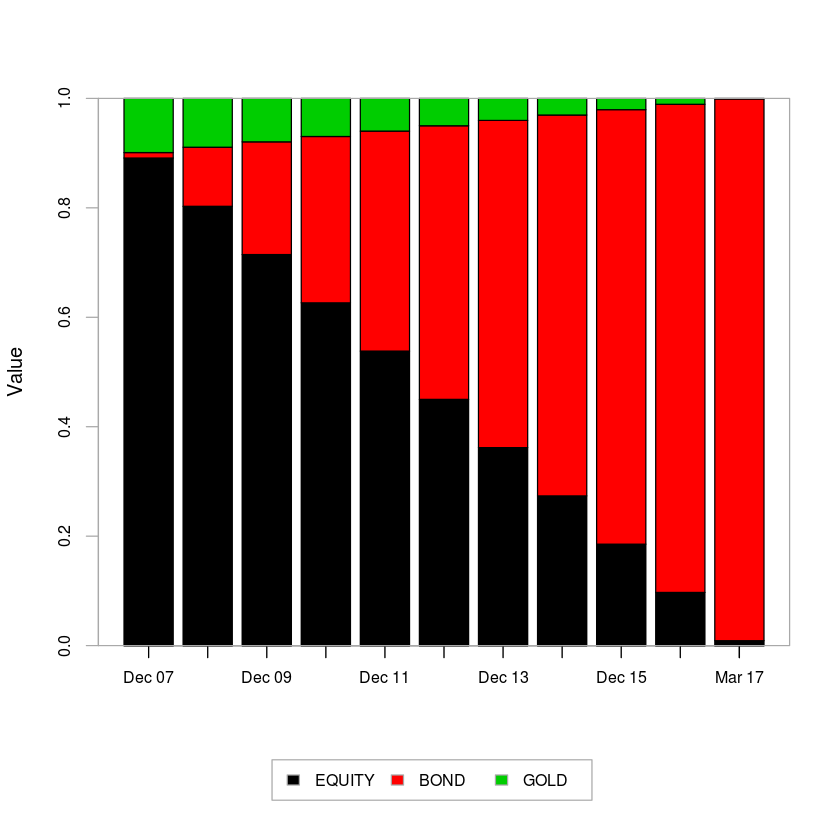
- Annual rebalance.
- Bonds start at 1%, the rest is divided between Gold (10%) and Equities.
- The total return index for the 5-10 year tenure published by CCIL is used as a proxy for Bonds.
- The MID100 FREE index is used as a proxy for Equities.
- The GOLDBEES ETF is used as a proxy for Gold.
- Period under observation: 2007-04-01 through 2017-03-31.
The idea is that you start with mostly Equity and Gold in the portfolio and rebalance at the end of every year so that at the end of 10 years, you end up with mostly Bonds.
Returns
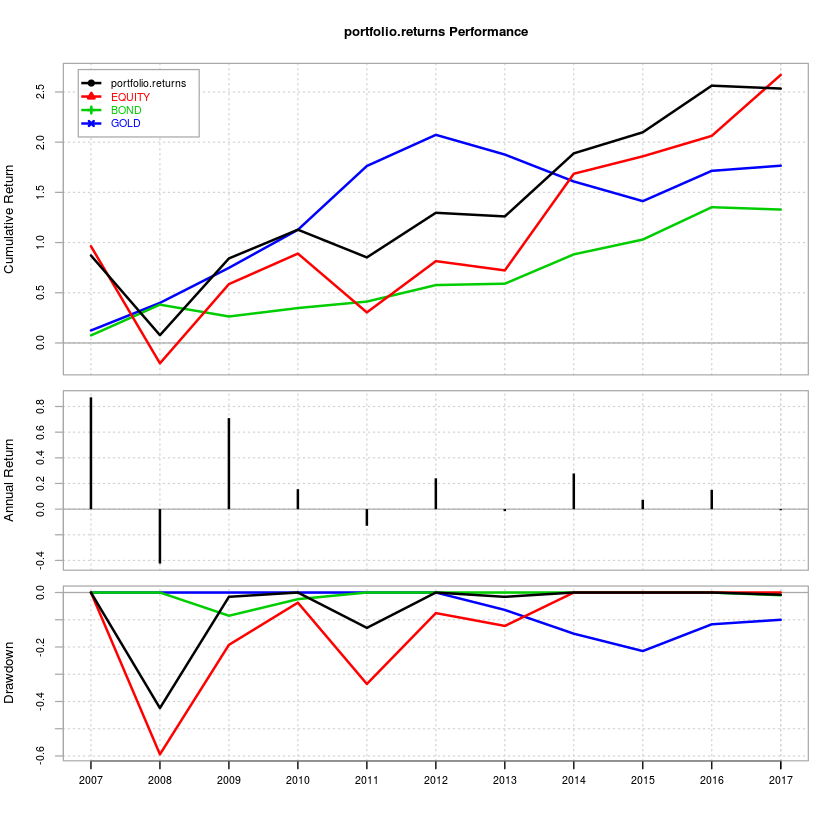
Notice the drawdown of the equity vs. that of the portfolio. You end up with similar returns but with lower volatility.
If you remove Gold from the equation and go with only Equity and Bonds:
Combined portfolio – Annualized: 11.38%; Max drawdown: -49.90%
Equity only portfolio – Annualized: 12.55%; Max drawdown: -59.39%
Bond only portfolio – Annualized: 7.99%; Max drawdown: -8.52%
Even though a diversified, rebalanced portfolio makes sense on the surface, the tax treatment on Gold and Bonds make an annual rebalance an expensive affair.
Code and detailed results are on Github.