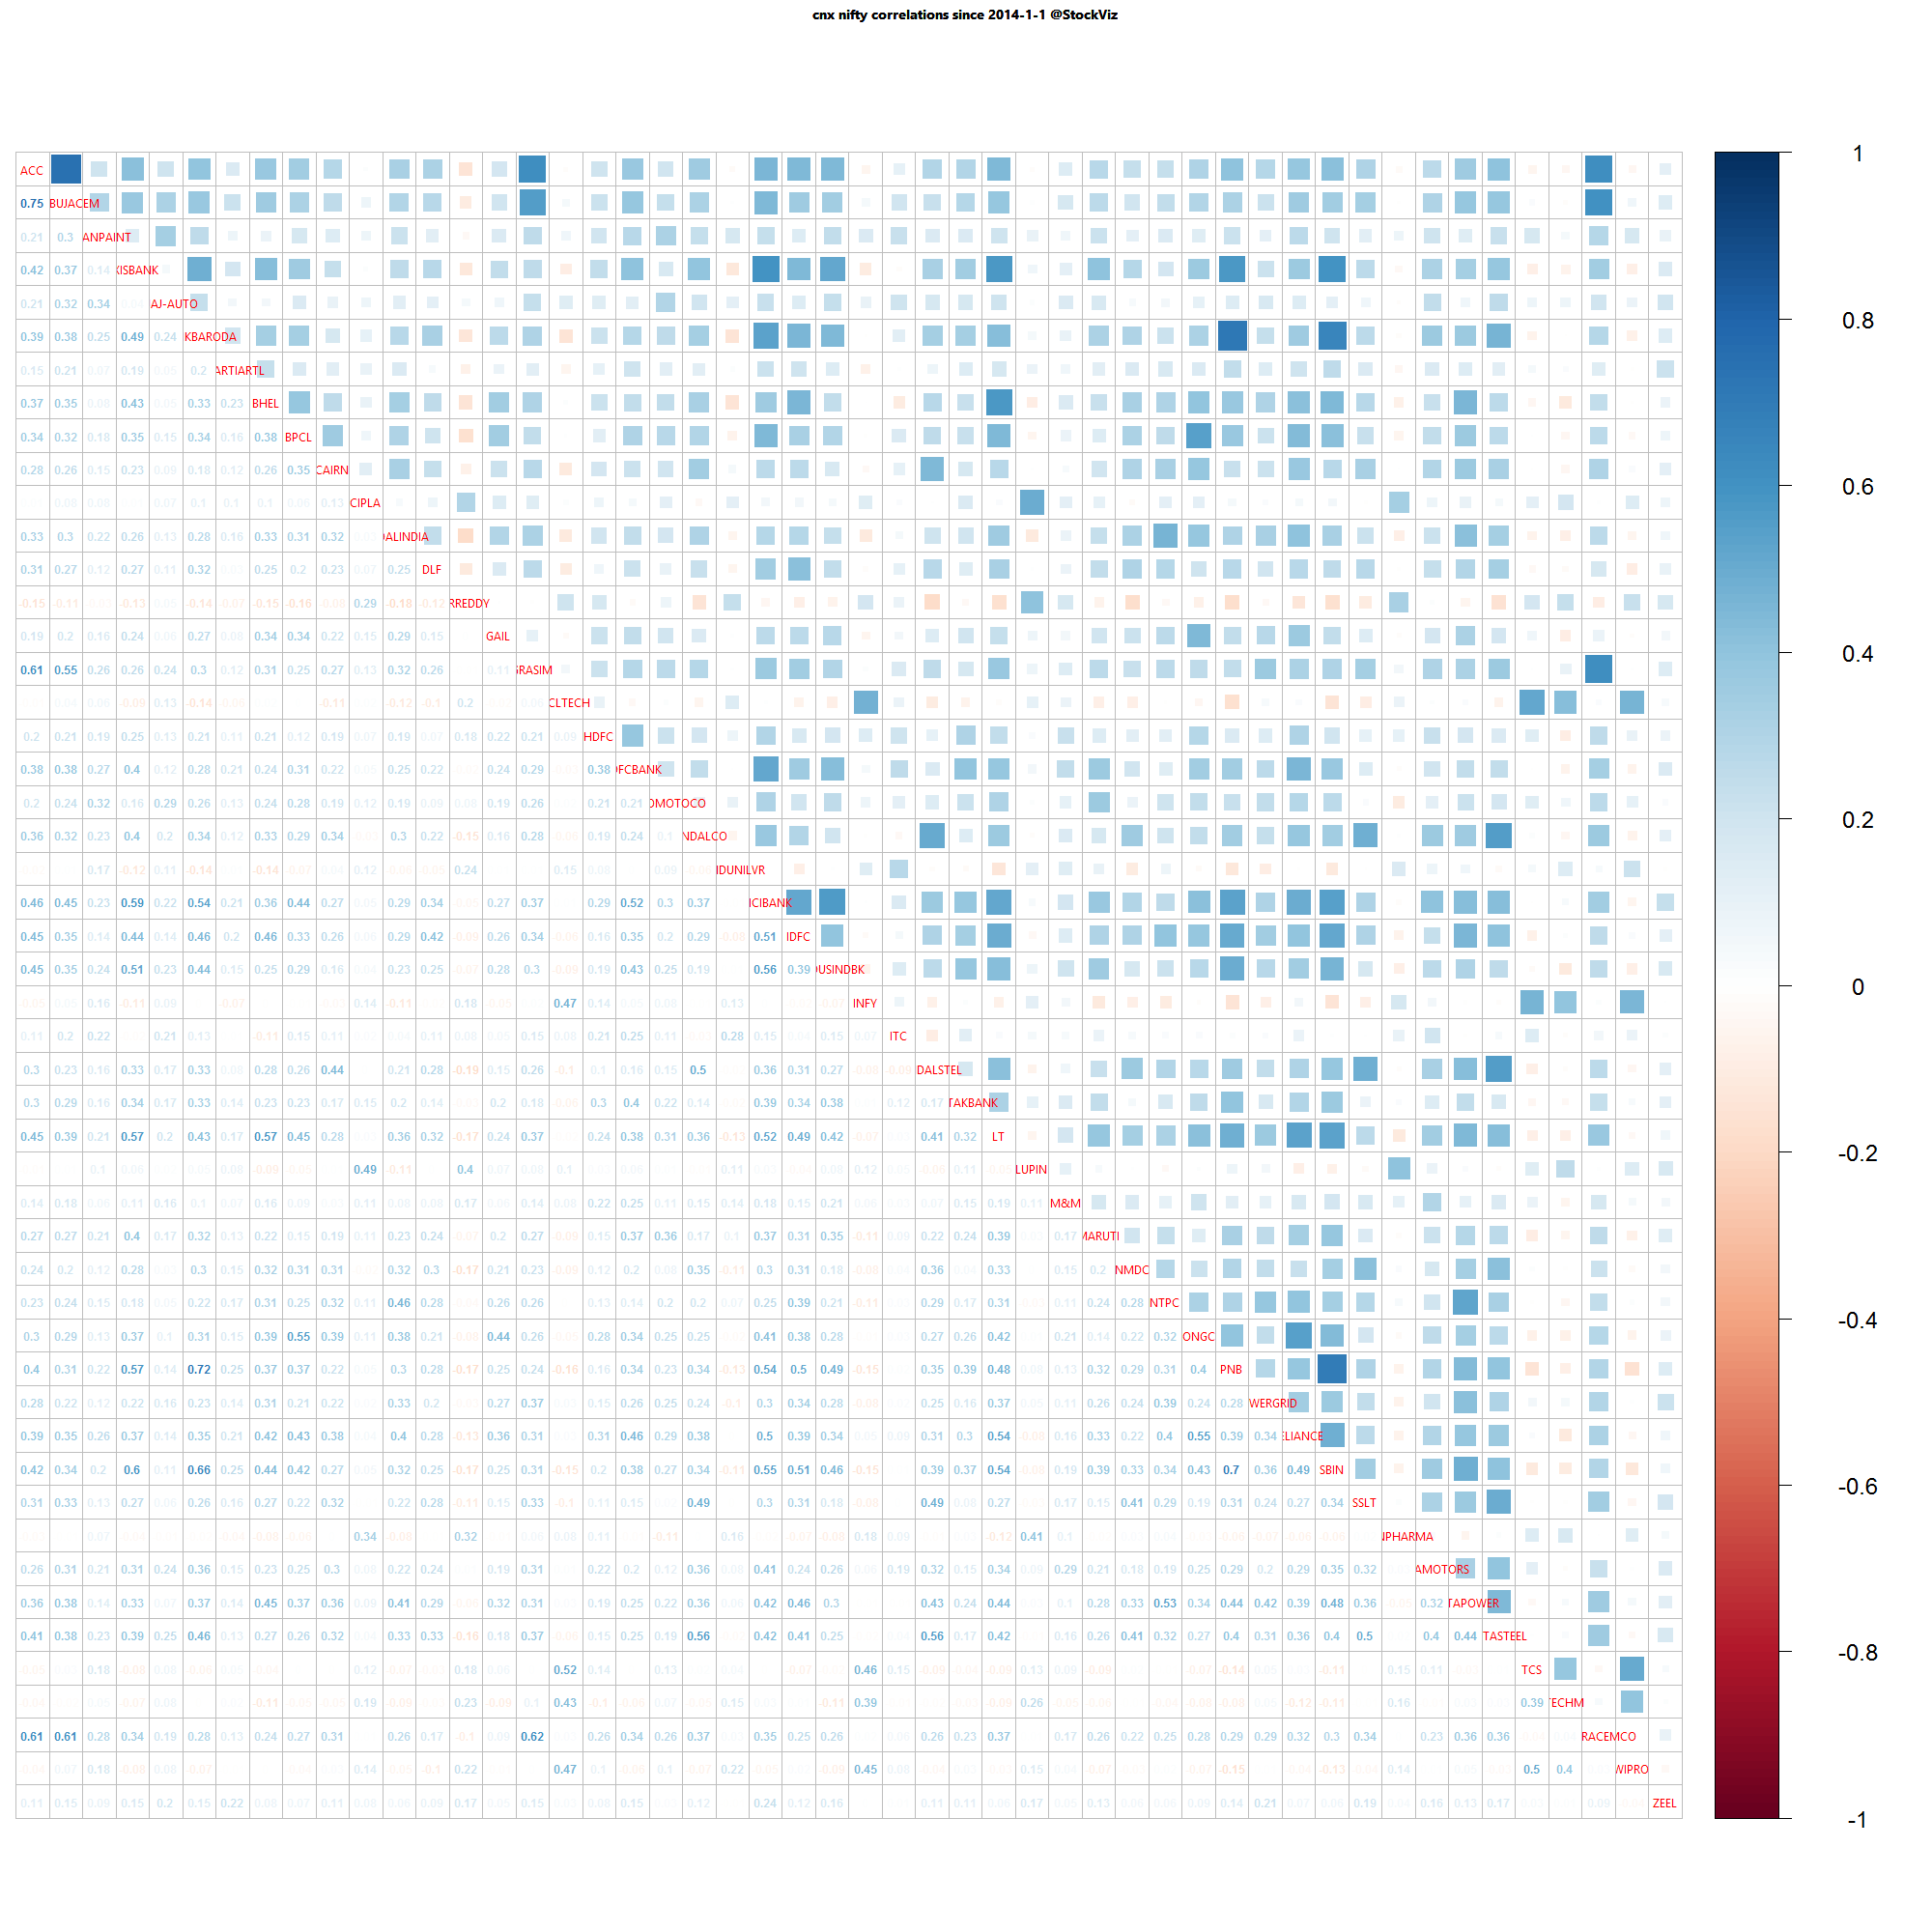
It is useful to visualize the correlations of returns between individual stocks in an index. If correlations are high, betting on the index as a whole could be more profitable compared to picking single stocks. Low correlations, on the other hand, is a stock-picker’s dream. Here’s how the NIFTY correlations stack up.
One year daily returns
One month daily returns
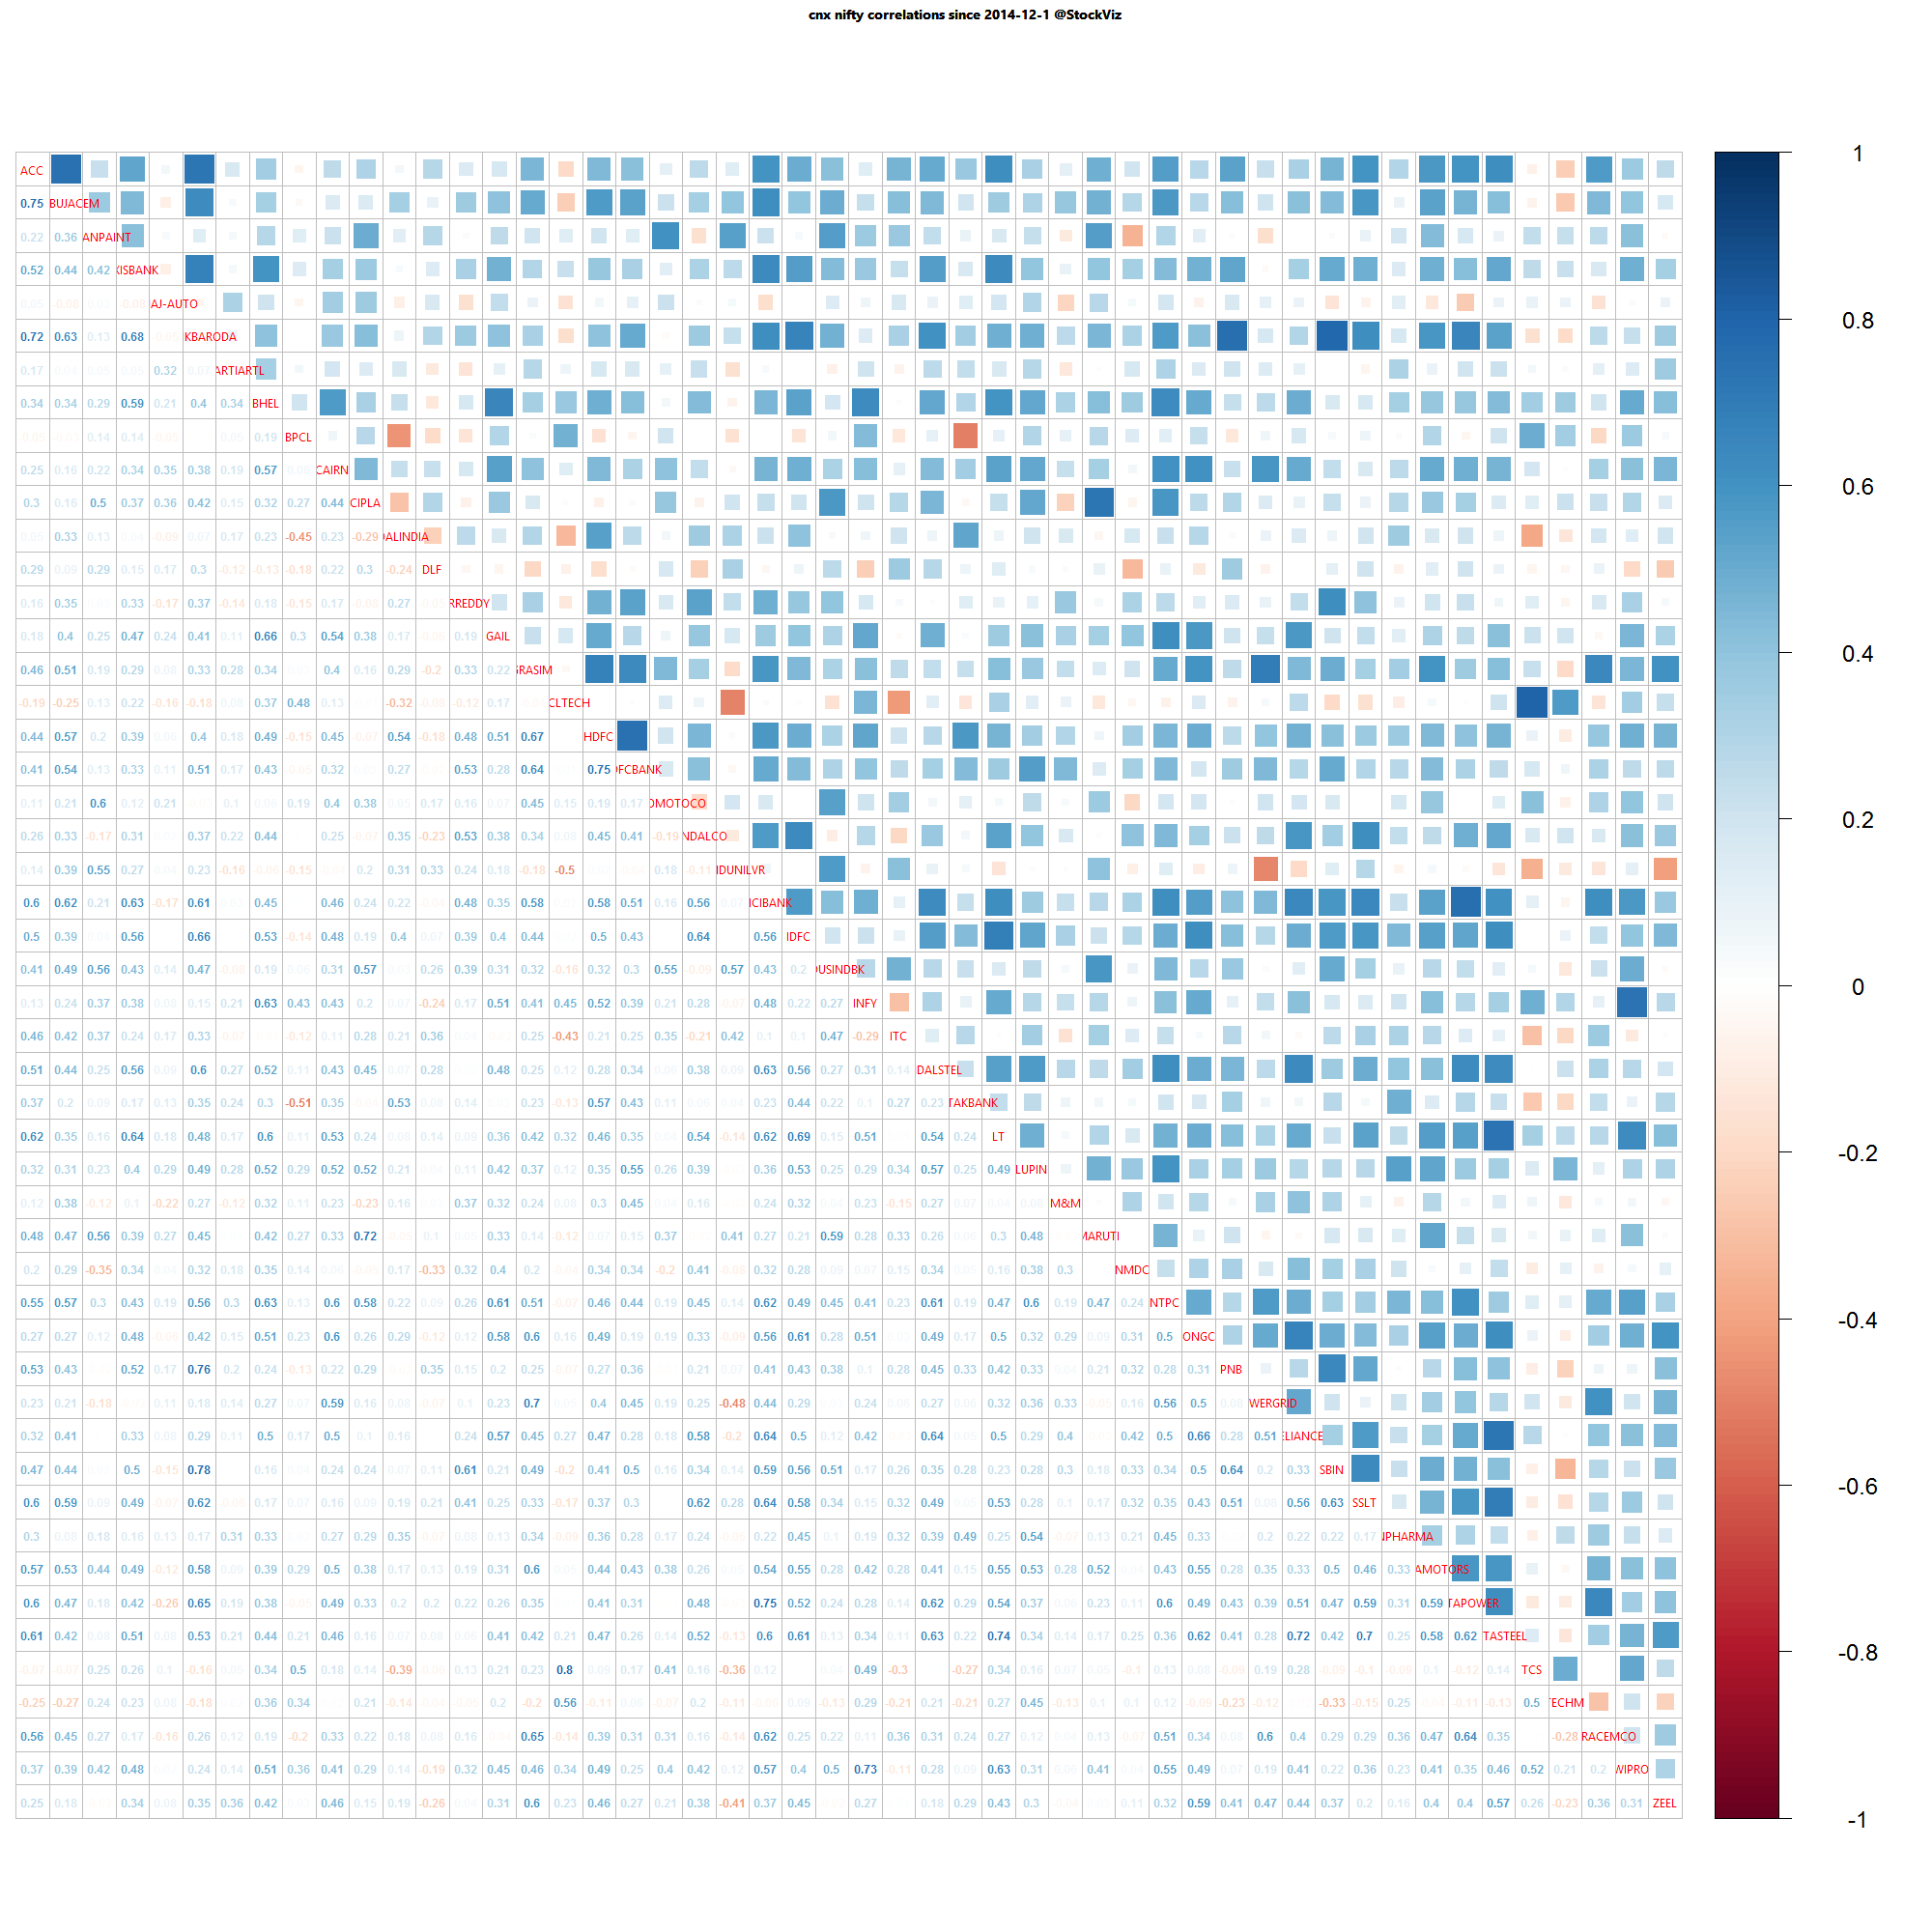
A lot of thick blue squares mean that positive correlations are high. Red squares mean negative correlations are high. Whites are the doldrums.
We plan to update these on a weekly basis.