Tag: investing

Mandates, or lack thereof

Individual investors’ greatest advantage is that they don’t have to fit into a “style box.”

If you can’t measure it, you can’t improve it. – Peter Drucker

The Industrial Revolution was fueled, in part, by the violent combination of applied statistics and physics. Rapidly improving methods of measurement lead to rapid innovation in both the underlying physics and the resulting machine. And in an era of rapid innovation, managers who could zero-in on the metrics that mattered the most and measure them with decent precision had a large competitive advantage over the innumerate. For instance, if a new type of cotton ginny was invented, you needed a quantitative method to figure out if it was worth replacing the existing ones.

Managers who measured well survived. And those who survived, preached.

Take education, for example. Before the Industrial Revolution, one would simply be an “Oxford graduate.” There were no grades. Once your advisor thought that you were “ready,” you graduated. It was the industrialists who demanded scoring and ranking as a way to fit graduates into roles. And educational institutions obliged.

And it was all downhill from there.

When a measure becomes a target, it ceases to be a good measure. – Goodhart’s Law

While measurement and metrics are helpful in the physical world, it tends to break apart in the social world.

Measuring Investments

The first modern mutual fund was launched in the U.S. in 1924.

CRSP completed the stock market database in 1964.

The CAPM was introduced between 1961 and 1966.

Morningstar Style Box for mutual funds was introduced in 1992.

SEBI finalizes the Categorization and Rationalization of Mutual Fund Schemes in 2017.

For more than 40 years, investors were happy knowing absolute returns – how much was invested, what it is worth now and how long it took. And they were plodding along just fine for more than 70 years without the Style Box. But now, there are a dozen different ways to measure investment returns across an equal number of investment styles. How did we get here?

The Agency Problem

The Agency Problem or the Principal-Agent Problem occurs when one person (the agent) is allowed to make decisions on behalf of another person (the principal).

Within asset management, compensation structures in large part drive managers’ interests, and if these contracts are not structured correctly, managers may have an incentive to act counter to the fiduciary duty they have to their investors. Furthermore, investors’ tendency to focus on short-term performance may indirectly provide managers with additional incentives that exacerbate this problem. The Principal–Agent Problem in Finance

In every bull market, there are a certain class of funds that focus on the meme stocks of that period. These “go-go” funds, focused on growth stocks and other high-risk securities, offer higher risks, but also higher potential returns. Typically, when the bull market eventually comes to an end, investors end up holding the bag while the asset manager would’ve earned enough in fees to retire.

Stakeholder Rights and Obligations

There are quite a few stakeholders in the asset management industry:

  1. The buyer/investor.

  2. The seller/manager.

  3. Independent/Sell-side/Buy-side analysts.

  4. Rating agencies.

  5. The broker/distributor.

  6. The advisor/allocator/consultant.

  7. The regulator.

  8. The tax-payer/government.

As the asset management industry grew, the number of people involved in creating, (re)packaging, advising and selling them grew as well. Often, the interests of each of these stakeholders are in conflict. Increasing popularity of metrics and measurement in the industry is essentially an attempt at keeping these stakeholders honest.

Mandates

A barometer measures pressure. A thermometer measures temperature. Pressure and temperature exist independently of barometers and thermometers. This is true about any physical environment. Social environments are different. Measuring something could very well alter the very thing being measured. This is true about asset management as well.

For example, how should a bond fund manager be incentivized? If it were only to beat an index, then he could just play Russian-roulette with risky high yield bonds – he gets paid for excess returns (every year) when they work and you hold the bag when it blows up (eventually, some time in the future.) So, you put some restrictions on what he can do: only AA or higher with durations less than 3 years; not more than 10% of the fund in the same issuer/promoter, etc.

These restrictions are called mandates.

Mandates drive everything in professional asset management. It sets down a common operating principle and a set of metrics that all stakeholders can agree on.

In fact, the failure of the Indian mutual fund industry to narrow down mandates led to SEBI fixing it themselves. Before SEBI’s edict, it was common for fund houses to have multiple funds in the same category and play the survivorship bias game.

The rational behind Morningstar’s Style Box was the same as well.

Metrics that sit on top of mandates allow stakeholders to rank how individual managers have performed.

Where there is a Match, there is Match-fixing

The problem with mandates is that if you make it too strict, then beating the benchmark becomes nearly impossible and if you make it too lax, then agency problems raise their ugly heads.

US bond fund managers were able to beat their benchmarks mostly by taking additional risks: term risk, corporate credit risk, emerging markets risk, and volatility risk. Traditional discretionary active bond strategies offer little in the way of true alpha. AQR, 2018.

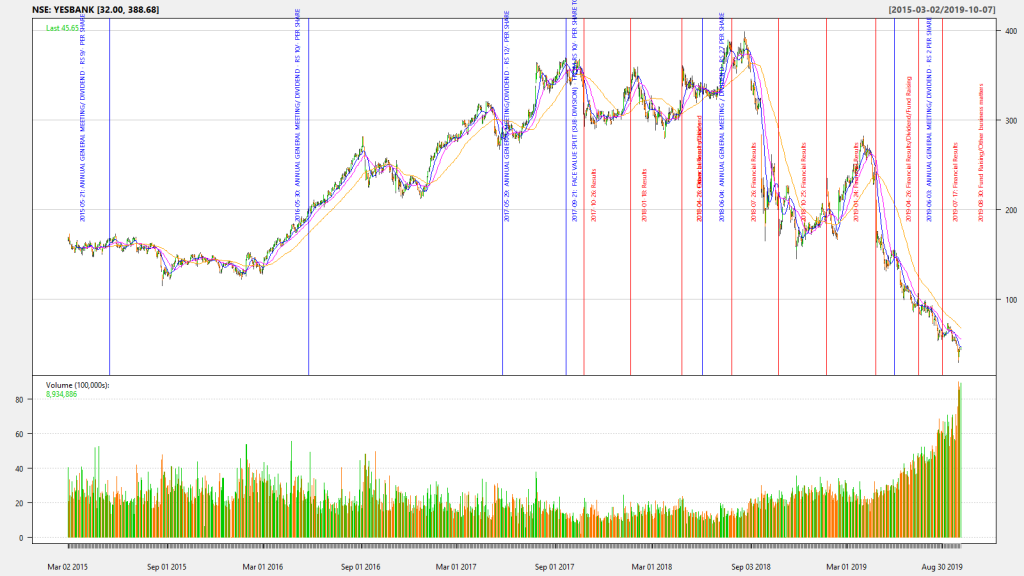
Given that investors care primarily about the most recent three-year performance, the pressure to front-load returns is huge. A case in point is the recent Franklin Templeton debt funds fiasco.

Despite the regulations being clear, some mutual fund schemes seem to have chosen to have high concentrations of high risk, unlisted, opaque, bespoke, structured debt securities with low credit ratings and seem to have chosen not to rebalance their portfolios even during the almost 12 months available to them so far. SEBI’s statement on Franklin Templeton dated May 7, 2020

Metrics are notoriously unstable

Finance doesn’t have immutable laws of nature. The “physics envy” that finance academics have is obvious in the body of research they have produced – precise equations modeling a complex-dynamic-adaptive system. But the desire to tame the beast that is the asset-management industry has lead to too many rigid frameworks and restrictions placed on all the stakeholders.

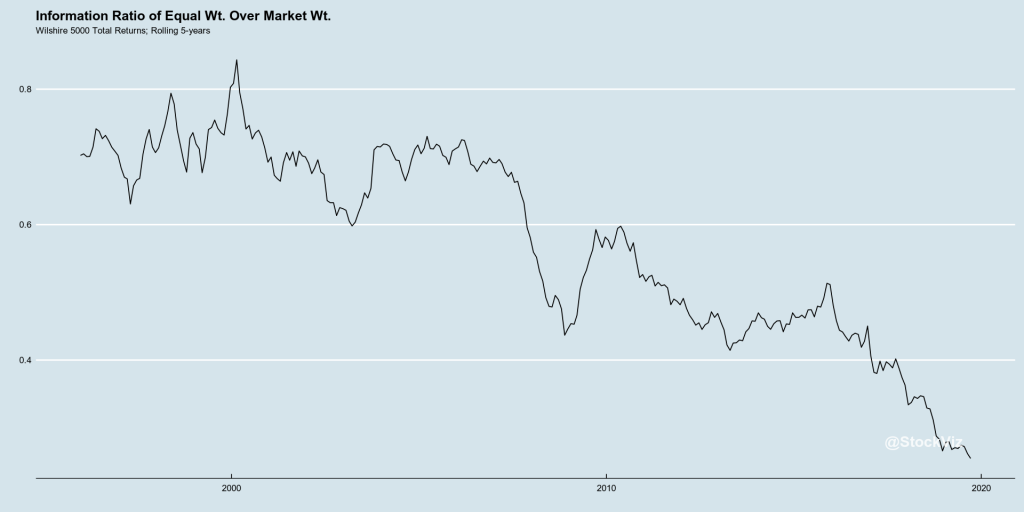
There is absolutely zero stability in metrics used to analyze mutual fund performance. Whether it is alpha, beta or information ratio, they all vary over time and across market environments. Using them to pick the next “winning” fund is pointless. They are, at best, a measure of what happened in the past. – A quick note on performance metrics

So you have tighter mandates and unstable metrics. But the bigger question is: as an investor, do you want relative performance or absolute returns?

Free your mind

The problem with bucketing yourself as a “value investor,” “contrarian,” “growth,” or “momentum guy” is that you lose the biggest advantage that you have: flexibility and the ability to adapt to the market.

Fund managers, at the end of the day, are only human. They too suffer from confirmation bias. And to make matters worse, once they reach a certain level of fame, all their holdings are closely tracked and their decisions questioned. Once publicly committed to a position, they find it very difficult to backtrack and admit mistakes. You, as an individual investor, have no such pressure.

To top it all, the fund management business is geared towards the accumulation of assets. They are paid a % of assets under management (AUM,) after all. However, size is the enemy of outperformance. With break-evens running at Rs. 100 crore per fund, the “no-go” zones for managers are pretty large. You, as an individual investor, have no such constraints.

There is an oft repeated cliché that you should invest within your “circle of competence.” Most people use this as an excuse to keep fishing in the same pond till the water is dry and the fish are dead. Instead, you should think of it as a call to action. If you are not constantly learning and increasing your circle of competence, then what exactly are you doing with your life?


Moats are for never

Be wary of #neversell

When Buffett-heads are asked about when they are likely to sell a stock, they often bring out this quote from the Master:

A common-sense parsing of the actual quote would over-weight the “outstanding businesses” bit over “forever.” However, the quote has been deliberately misinterpreted by asset-managers (who are paid as a percentage of AUM) to keep investors tied into their funds in spite of extended periods of underperformance.

Corporate history is replete with examples of companies that once had the widest of moats but withered nonetheless. The most recent posterchild is Intel.

Over the last decade, Intel (INTC) trailed the broader S&P 500 and Nasdaq indices with the final death-blow being dealt by Nvidia.

Twenty years ago, could you imagine a world without Intel? Now you can. Apple, Samsung, Amazon, Google and Microsoft are all in the process of developing or have already developed processors to run their operating systems and power their data centers. For a deeper dive, read this excellent piece by James Allworth.

And it is not just hardware. Twenty years ago, could you have imagined that Infosys would beat IBM and the S&P 500? Yet, it did.

Oh! But that is tech, you might say. What about the “real” economy stocks?

Remember GE? Their six-sigma blackbelts were supposed to be cream-of-the-crop problem-solvers who could be parachuted into any situation.

While you can argue that the above companies were cherry-picked, the base-rates are more shocking

A recent study by McKinsey found that the average life-span of companies listed in Standard & Poor’s 500 was 61 years in 1958. Today, it is less than 18 years. McKinsey believes that, in 2027, 75% of the companies currently quoted on the S&P 500 will have disappeared. (IMD)

table 1 companies exiting and entering_smaller454

Often, experienced managers are experts at solving problems for an old world order. The “best” managements often miss creative destruction happening in their own backyard, like Kodak. Incentives typically are setup to reward reaching local maximas. So, it is entirely possible to hit every single quarterly number while steadily marching toward bankruptcy.

The Coca-Cola Company is an example where initial high expectations were merely met (and not exceeded) to the dismay of common-stock holders.

And what is true about individual companies it true about the broader market as well. A visit to Japan will blow your mind. But as an investment?

In fact, a simulation of historical country-index returns show that only DENMARK, USA and SWITZERLAND had an extremely small chance of posting negative buy-and-hold returns. Out of the 43 Country specific MSCI indices we analyzed, half had more than a 10% chance of giving negative returns to buy-and-hold investors. India had a 6% chance (The Buy and Hold Bet.)

No company lasts forever. No market will always remain the best one to be in. No investment strategy will always deliver market-beating returns. No investor can consistently beat the market year-in/year-out.

No investment is forever.

Save. Don't Invest.

Focus on what is important in life.

Often, the highest selling product is the one with the best narrative, not the one that provides the best value for money. Similarly, what drives eye-balls in media are narratives around “alpha,” “out-performance,” “best mutual funds,” “1% a day option strategies,” etc. But what really matters to you are things like “fund my kids’ college education,” “retire at a reasonable age,” “take a foreign vacation,” etc.

While it can be sexy to consider oneself as an investor – fantasizing belonging to the same tribe as Warren Buffett or Peter Lynch – people looking to meet goals that actually make a difference to their lives, are better off considering themselves as savers.

One saves their income to meet expenses in the future. Thinking this way drives focus towards the two things that are entirely within one’s control: savings rate and duration.

Once you shift the internal narrative to saving over investing, how you measure success changes as well. The last thing you’d want to do is play snakes-and-ladders with your portfolio. You’ll want to reduce risk as you get closer to withdrawal. And finally, you’ll realize that market’s return doesn’t matter as long as your funding needs are met.

Accepting lower returns

While you are stuck in Silk-Board traffic the next time, ponder this:

The current holder of the Outright World Land Speed Record is ThrustSSC driven by Andy Green, a twin turbofan jet-powered car which achieved 763.035 mph – 1227.985 km/h – over one mile in October 1997.

How come you don’t drive a jet-powered car? Wouldn’t that be the “best” car?

The reason why you drive a mini-van and not a jet is because your life involves mundane things like grocery shopping, dropping your kids off to school, going to the mall, etc.

Similarly, your portfolio should reflect your life. Just like you make-do with a mini-van (not the fastest, not the sexiest, but practical,) you should construct a portfolio that gets the job done. And that often involves not being the “best” investor but focusing on risk.

Managing risk means accepting that you will never go as fast as Andy Green.

Market returns vs. Portfolio returns

A “lost-decade” for stocks probably happens every decade.

Here’s MSCI indices for US, Developed Markets ex-US and India. The only thing that can be said for certain is that stocks fluctuate and occasionally tank 30-40% and sometimes even 70%

If you only invested in stocks and you needed money to send your kinds to college in 2008, then, well, good luck!

A goal-oriented portfolio constructed with this in mind will necessarily under-perform an all-stock portfolio when stocks are screaming higher. It will also not go down in flames when stocks tank, as they very often do. So, market returns ≠ portfolio returns.

Take risks when you can, not when you have to

If you are saving for a goal 10 years away, it is safer to bet that markets will recover in 10 years than to bet that they will recover in one. So it maybe a good idea to load-up on risk at the beginning and slowly de-risk as time goes on. In fact, if you don’t take risk upfront, then you maybe doing it wrong.

Here’s the difference between starting at 60% NIFTY vs. 95% and slowly ramping down over 10 years:

Glide path and Target-dates

The strategy described above is an example of a 10-year target-date fund with a linear glide-path. You start with an allocation that you are comfortable with – can be anything from 60/40 through 95/5 split between equities and bonds – and then every month nudge it so that at the “target-date” the allocation becomes 5/95. It is a way of taking risks upfront and de-risking the portfolio as the withdrawal date gets closer.

For longer time-horizons, say 30 years, you can also look at an exponential glide-path. The basic concept remains the same: reduce risk as you get closer towards withdrawal.

While decidedly unsexy, this “mini-van” strategy will safely get you and your family where you need to go.

Equal-Weighted vs. Cap-Weighted

There are a number of ways in which you can allocate funds (weigh) the stocks in your portfolio. The simplest of them are equal-weight and market-cap weight.

In an equal-weight portfolio, all stocks get the same allocation. If you have 20 stocks, then each stock would have a 5% weight in the portfolio. So the WAVG capitalization of these portfolios end up skewing towards mid/small caps within the portfolio.

In a cap-weight portfolio, each stock gets an allocation based on its market-capitalization. So large-cap stocks get a large weight and smaller-cap stocks get a smaller weight.

The advantage of a cap-weight portfolio is that unless you want to change the constituents, you don’t have to do anything. The individual weights will be always tracking their corresponding market-caps. But in an equal-weight portfolio, you need to rebalance once a month/quarter to bring back all the constituents to their original weights. You will be selling your winners to add to your losers.

Needless to say, the all-in cost of maintaining an equal-weight portfolio will be more than that of a cap-weigh portfolio. Is it worth it?

The American Experience

For the US markets, lucky for us, Wilshire Indices has index data covering both the market-cap and equal-weight versions of the same portfolio starting from 1970. And the over-all out-performance of the equal-weight portfolio looks spectacular.

Cap-weight vs. Equal-weight

Whenever you see out-performance like this, you have to keep in mind that it is usually a combination of investor behavior and investment risk.

The reason why an investment strategy out-performs could be because it is prone to long draw-downs followed by large, but short-lived, upswings. Investors flood into the strategy during the upswing, only to exit during the soul-crushing drawdown. Happens in value and momentum investing a lot.

The second reason why something works is because of higher volatility. Stocks are more volatile than bonds so over a long enough period of time, they out-perform them.

To visualize if investor behavior is driving out-performance, you can look for the swings in annual returns and periods for which the strategy under-performs its benchmark.

Large swings imply difficulty of staying invested
Long periods of under-performance imply difficulty of staying invested

The equal-weighted index also has a larger standard-deviation (a measure of volatility) ~6% compared to ~4.4% of the market-cap index.

In short, equal-weighted portfolios are more volatile and there are significant periods where they under-perform their cap-weighted cousins in the short-term. This results in a larger probability of adverse investor behavior, partly explaining the out-performance over a longer period of time.

However, we don’t live in the 70’s anymore. The market structure has evolved. Costs have come down drastically and more investors are aware of the equal-weight strategy. If you think liquidity is thin in small-cap stocks today, it was impossible to trade them 20 years ago unless your uncle ran a brokerage firm. So some of the earlier-period excess returns are only theoretical – you could not implement this strategy even if you knew about it.

So, is it still a free-lunch? One way to visualize this is to plot the Information Ratio of the equal-weight returns over that of market-cap returns.

No longer a free lunch!

Equal-weight, as a strategy, has been losing its mojo and maybe, its best days are behind it. Excess returns could be entirely explained by higher risk.

The Indian Experience

It maybe too early for a large commitment to equal-weight portfolios in India.

First, India has a Securities Transaction Tax of 0.1% on the total notional amount traded. So, a market-cap weight portfolio that is rebalanced twice a year will have a far lower cost than an equal-weight portfolio that is rebalanced every month.

Second, there is no liquidity beyond the top 70-100 names by market-cap. So one cannot create an equal-weight version of the NIFTY 500 index. An equal-weighted NIFTY 50 is probably the only version that makes sense if you want to reduce impact costs. NIFTY 100 is the second-best option.

If you go with NIFTY 50, an equal weight portfolio of 50 stocks means than each stock has a 2% weight. Since you are constantly selling winners and buying losers, low dispersion in returns between their returns will have a big impact on the relative performance of the equal-weighted portfolio over its cap-weighted cousin.

For example, YESBANK, at its peak, had a 1.74% weightage in the NIFTY 50. And its recent troubles have brought it down to about 0.18%. In the equal-weighted NIFTY 50, this would have been a constant 2% through-out. Not exactly participating fully in the up-side but doubling down on the down-side.

Price chart of YESBANK since it was added to NIFTY 50 in March 2015

YESBANK wouldn’t have been a big problem if we were equal-weighting the NIFTY 500. But it is a problem with NIFTY 50.

NIFTY 50: cap-weight out-performs
NIFTY 100: cap-weight out-performs

As expected, the gap between NIFTY 50 equal/cap is huge compared to that between NIFTY 100 equal/cap.

Conclusion

  • Equal-weighting may not be “free lunch.” Excess returns are could mostly be explained by higher risk.
  • Makes sense only on large portfolios. Maybe 500 stocks is the magic number.
  • We wary of costs.

Reference

  • Portfolio selection: the power of equal weight (arvix)
  • notebook with R code for the plots.

Questions? Slack me!

Systematic Buy-the-Dip

Introduction

We often hear the term “buy-the-dip” whenever the markets are correcting. However, here are some questions that face an investor:

  1. What exactly is a “dip?”
  2. Where does the cash come from?
  3. How much should I buy?

The answers to these questions will determine how much alpha you will generate by employing this strategy.

What is a “dip?”

A dip is a percentage loss from a near-time peak (also called a drawdown.) For example, if the NIFTY posts a 50-day cumulative loss of 5%, then that is a 5% dip over where the NIFTY closed 50-days ago. To get a sense for how these 50-day dips/drawdowns are distributed, we do a density plot.

drawdown.density.NIFTY 50

drawdown.density.NIFTY MID100 FREE

As we can see, most of the NIFTY dips are at around 5%. A more than 10% dip is a “back the truck up” event where we deploy all our cash. For MIDCAPs, it is around 10% and 15%.

The back test

Every day, an investor has Rs. 1 that he needs needs to invest. He can either buy the NIFTY/MIDCAP or he can park it a short-term bond fund/savings account. Additionally, if it is a “back the truck up” dip, he can liquidate the bond fund and buy the NIFTY/MIDCAP. Let’s tag this as DIP.

In a DIP, the investor only buys NIFTY/MIDCAP if it is in a dip. Otherwise, he buys Rs. 1 worth of bonds.

The base case is that the investor buys Rs. 1 worth of NIFTY/MIDCAP every day. Let’s tag this as SIP.

Should you buy the dip?

Yes, buying the dip allows you to build a bigger corpus, if your transaction costs are zero. Here are the NIFTY and NIFTY MIDCAP buy the dip (DIP) vs. daily purchase (SIP) final corpus:

dip-sip

Given how small the alpha is, net of fees/commissions/slippage/taxes, this is a losing proposition. You are better off with a SIP.