Introduction
Momentum effects are one of the premier anomalies in the market and we have been running an equity long-only momentum strategy since 2013 with returns of +64.44% vs. Nifty’s +27.25% so far. Given the success of long-only equity momentum, we were curious as to how a long-short version of it would perform in India given our unique constraints. And also investigate if its success could be replicated using derivatives.
Typically, academic research that discuss momentum tide over the difficulty involved in shorting stocks. In India, you can only short stocks through SLBS in quantities that are multiples of the lot-size. And only those stocks that are allowed in the F&O segment can be borrowed for selling short. In order to overcome these constraints, we restricted our universe of stocks to only those that have been in the F&O segment since Jan 2004. There are grand total of 97 stocks that fit this criteria.
The biggest problem with choosing such a restricted universe is survivorship bias. One can argue that the stocks that survived from 2004 through 2015 and had enough liquidity to be listed in F&O would have stronger long-term momentum than those that do not. If this is true, then it doesn’t make sense going short. We will see if this hypothesis is confirmed in our back-test.
Long-only Momentum
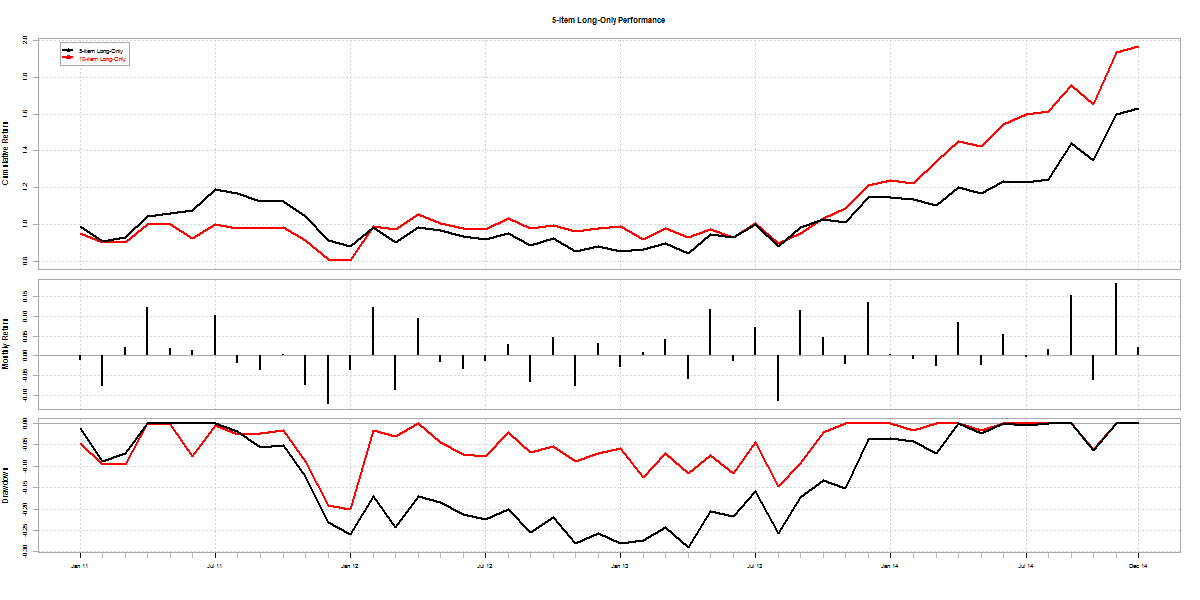
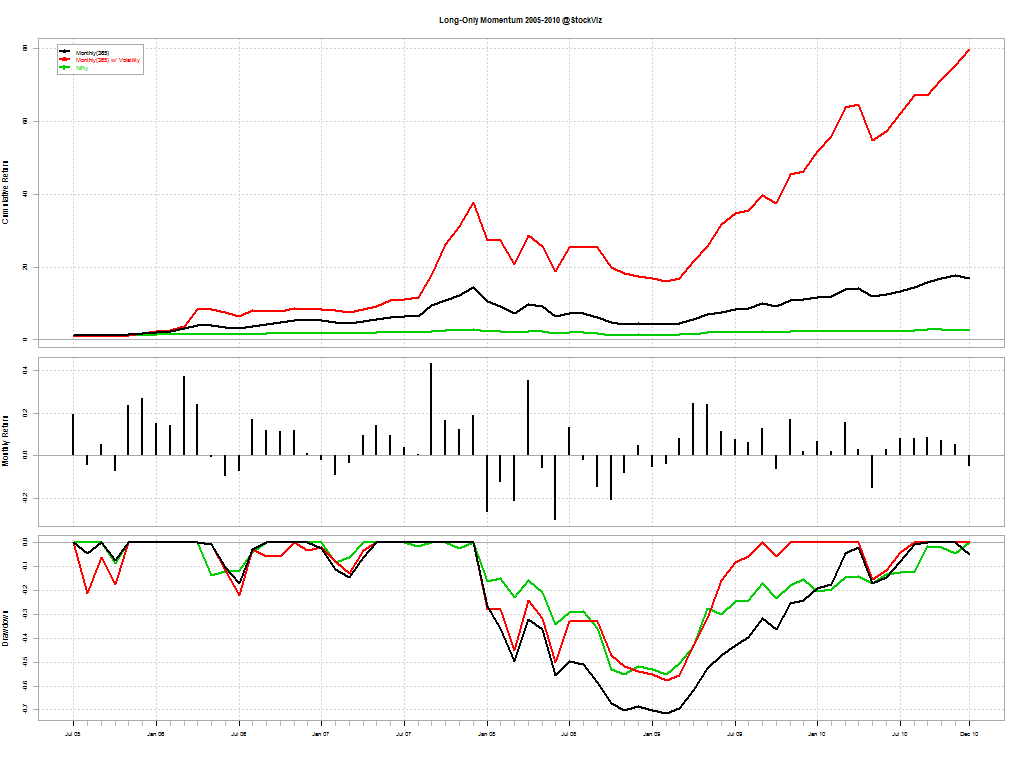
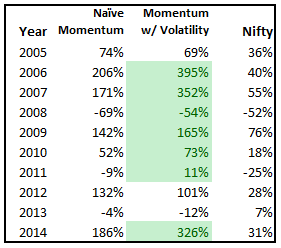
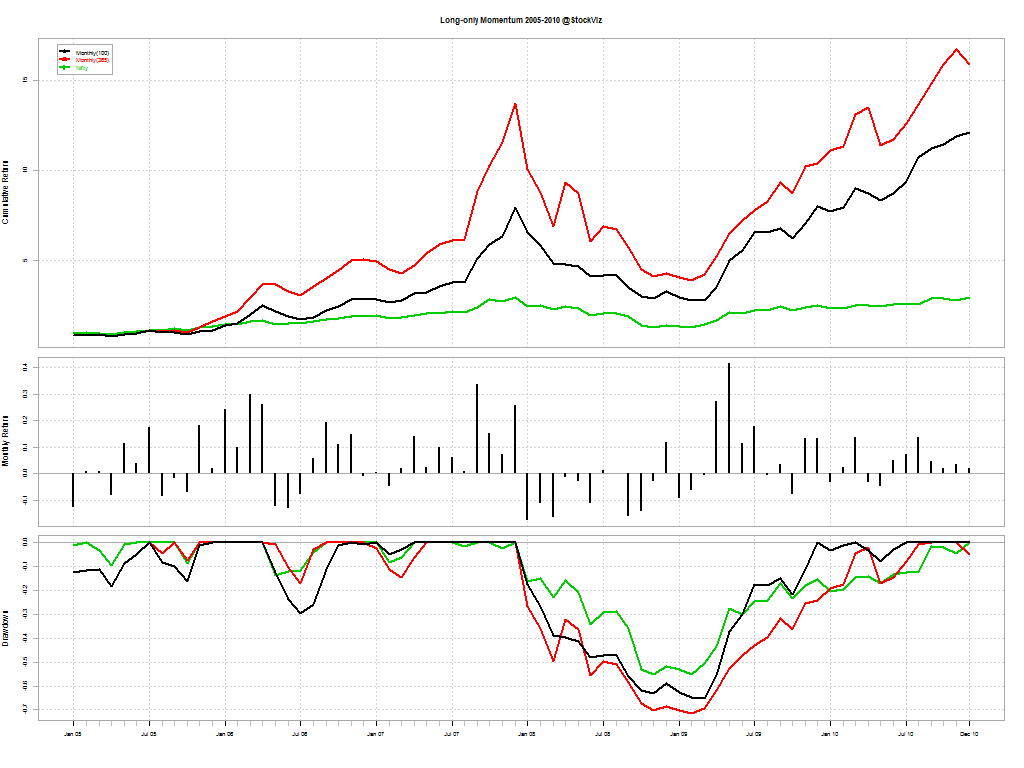
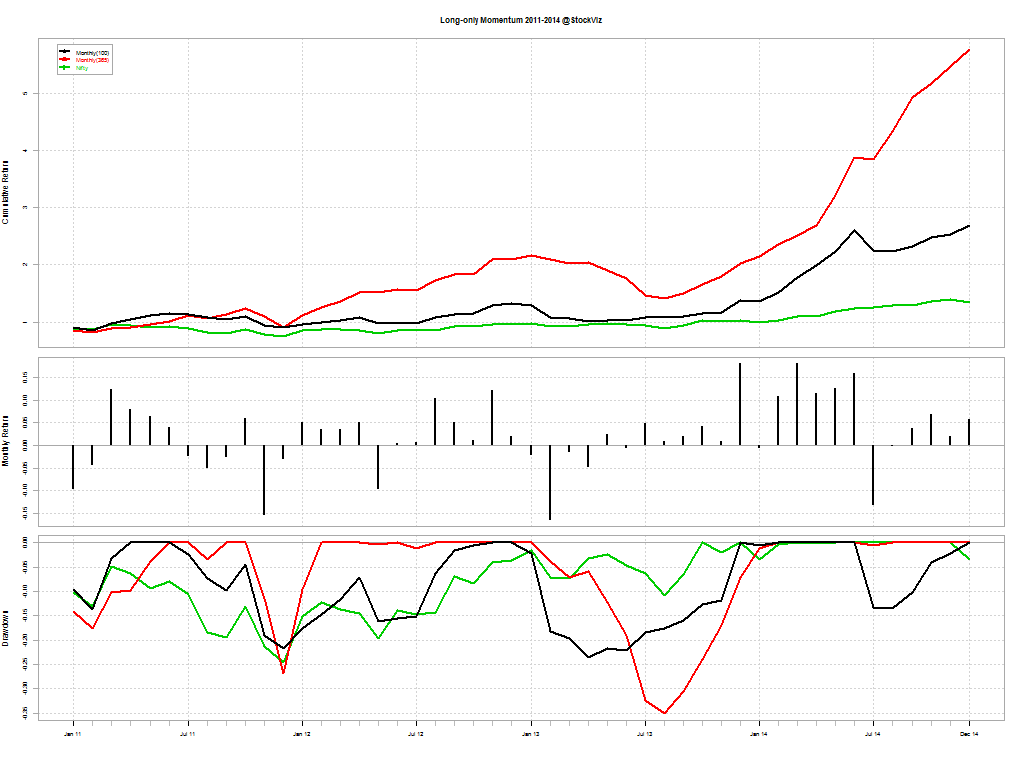
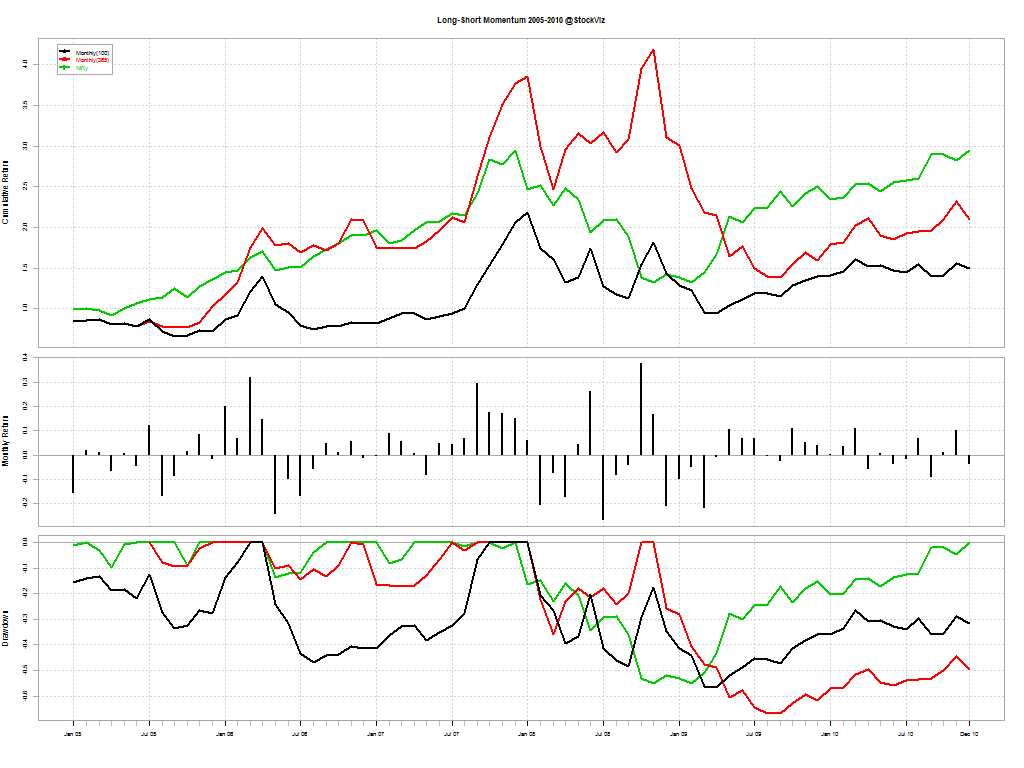
Typically, momentum strategies are run using a one-year look-back period. We wanted to check what kind of impact shorter look-back periods had on overall returns. The following results are for going long (equally weighted) the top 5 stocks in our universe at the beginning of every month and holding it for one month.
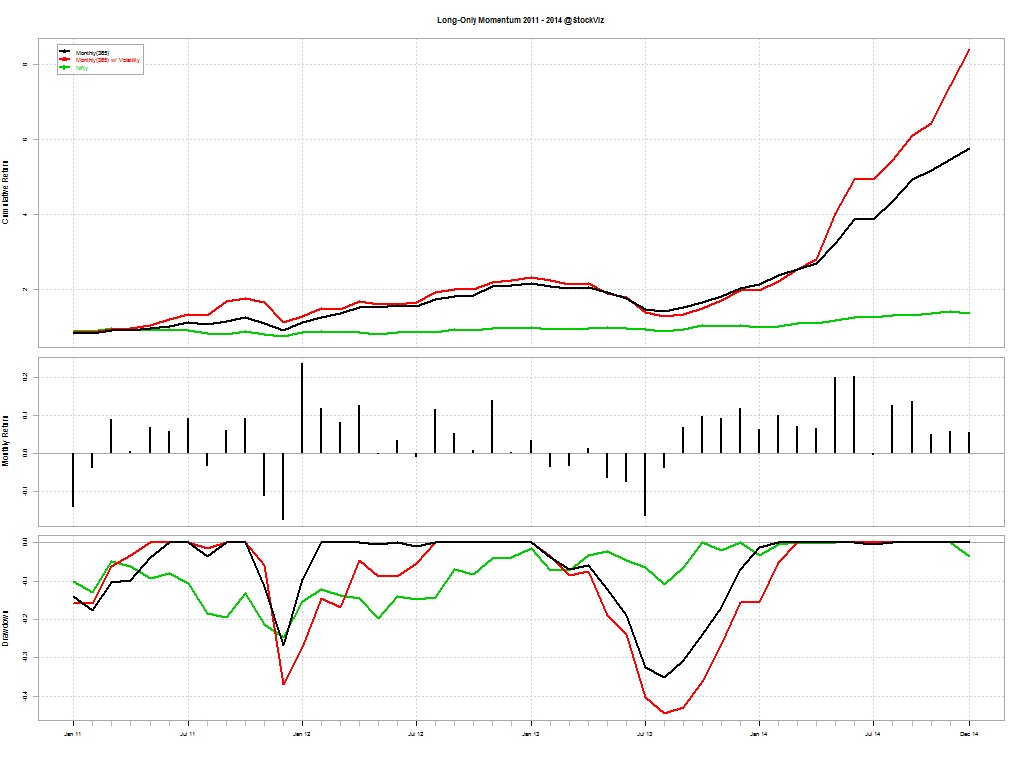
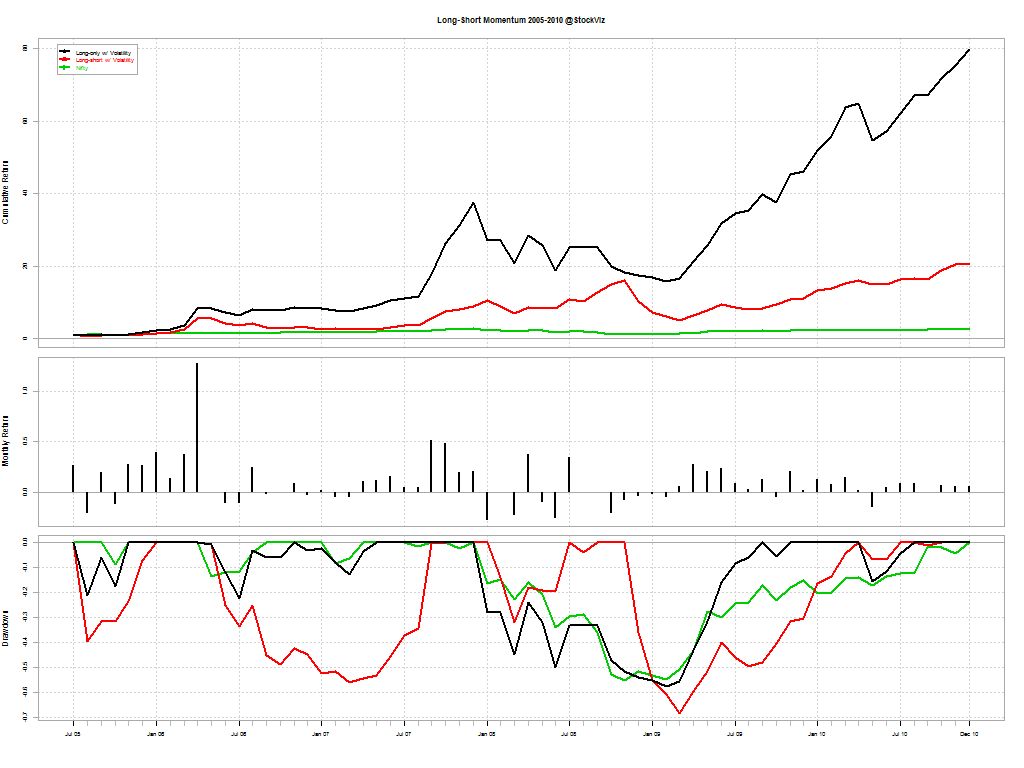
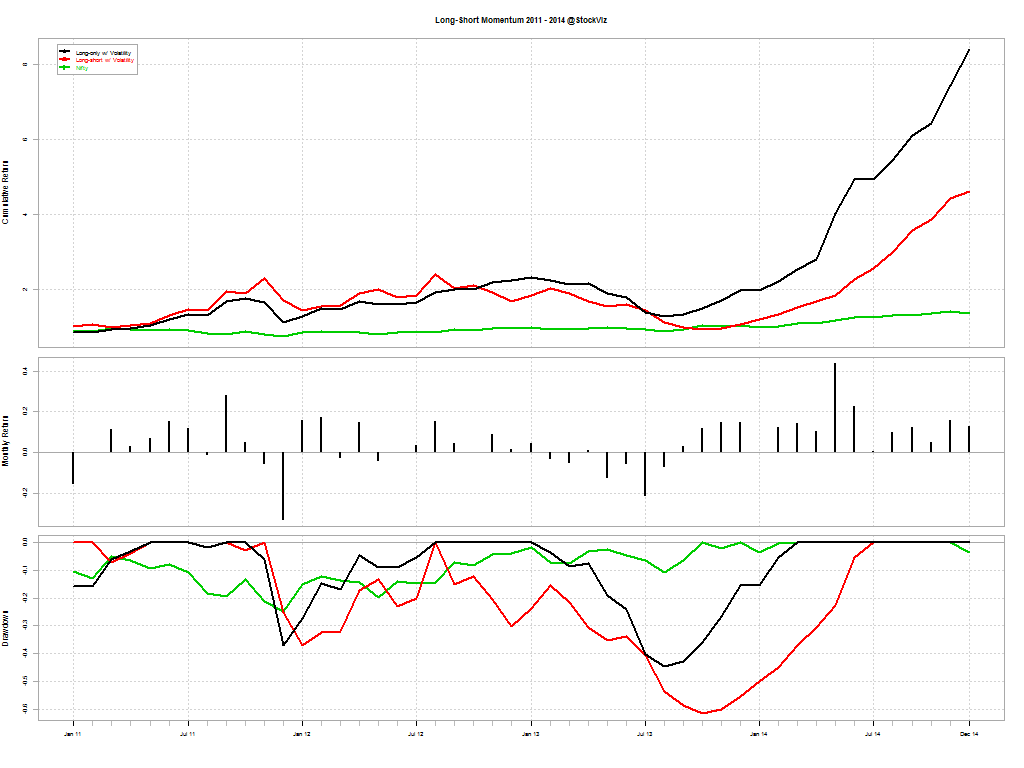
The red line is the one-year look-back momentum; black is 100-day look-back momentum; and green is buy & hold Nifty
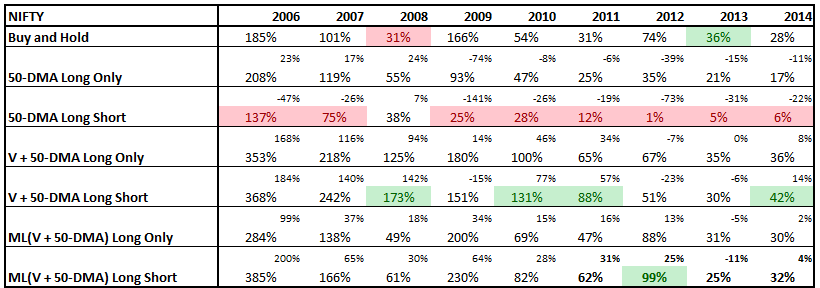
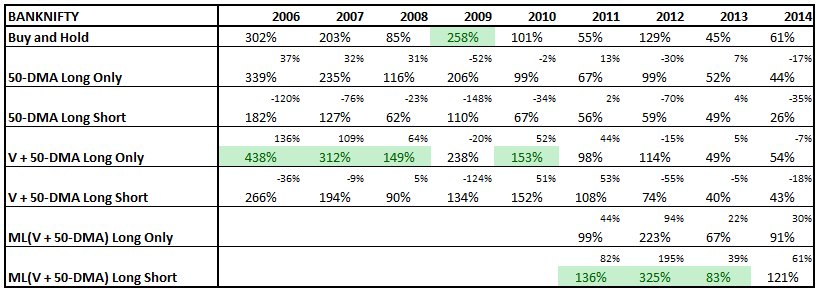
By year:
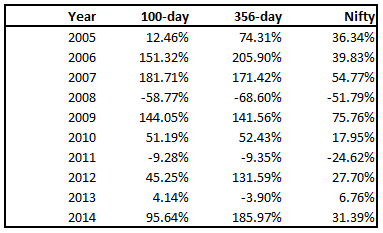
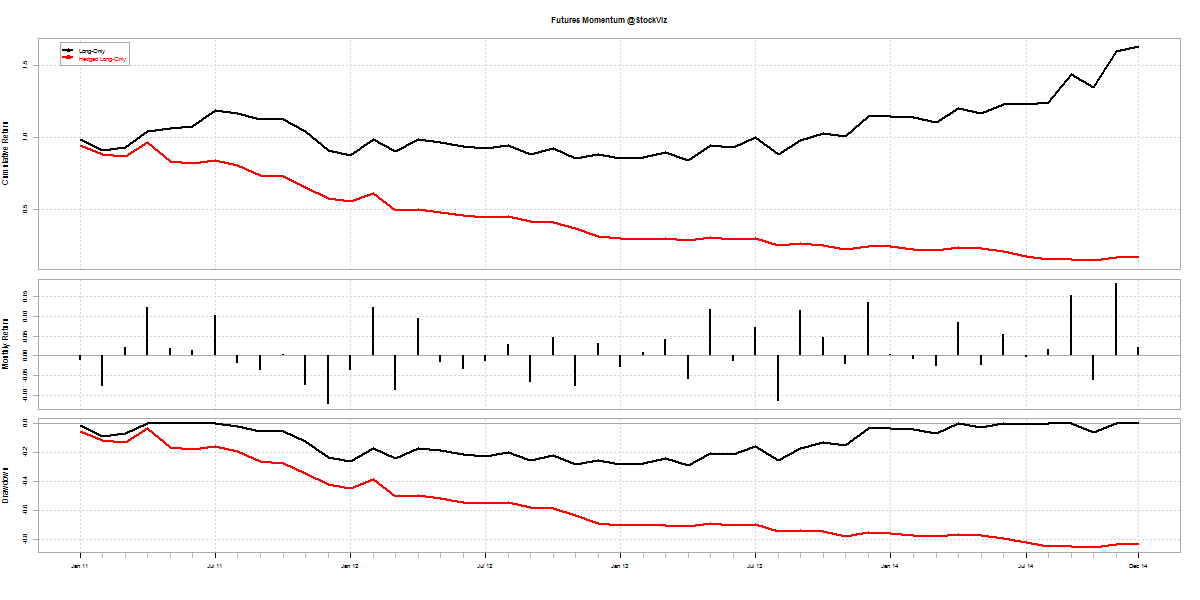
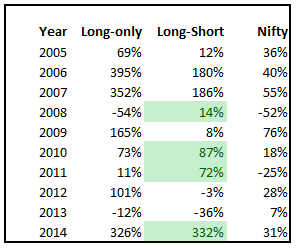
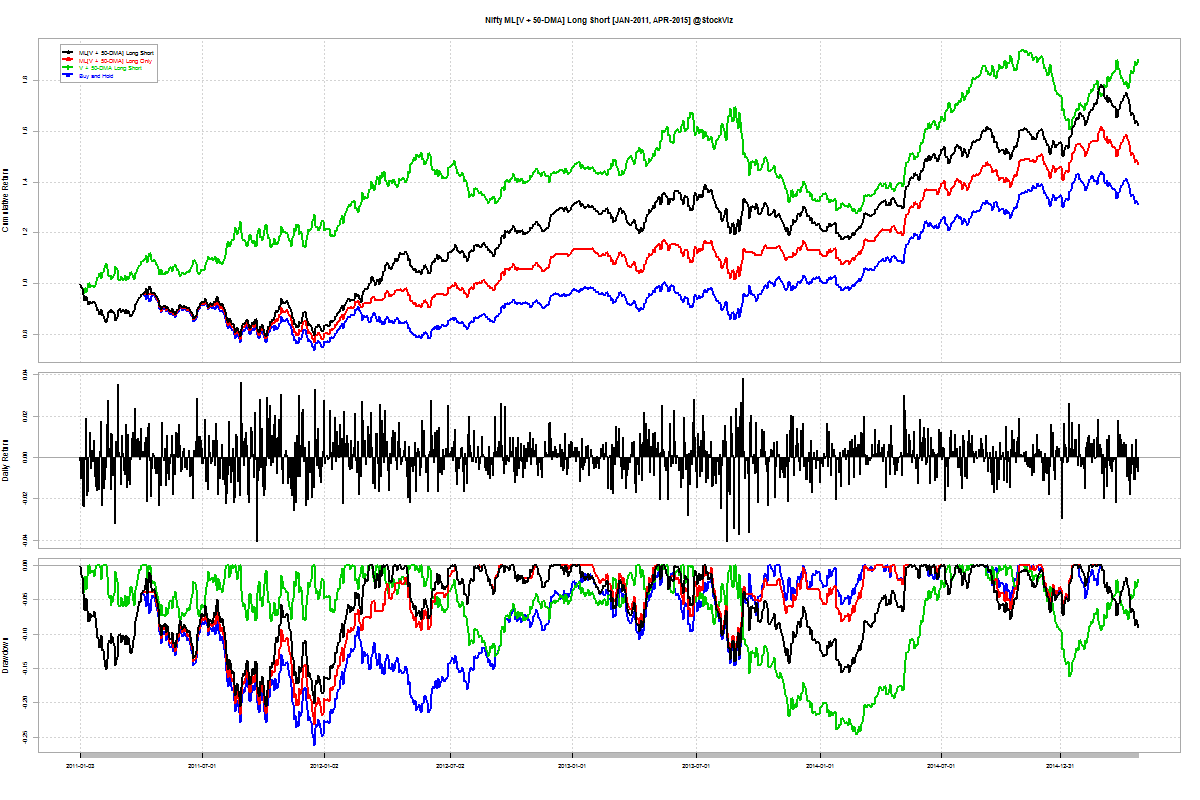
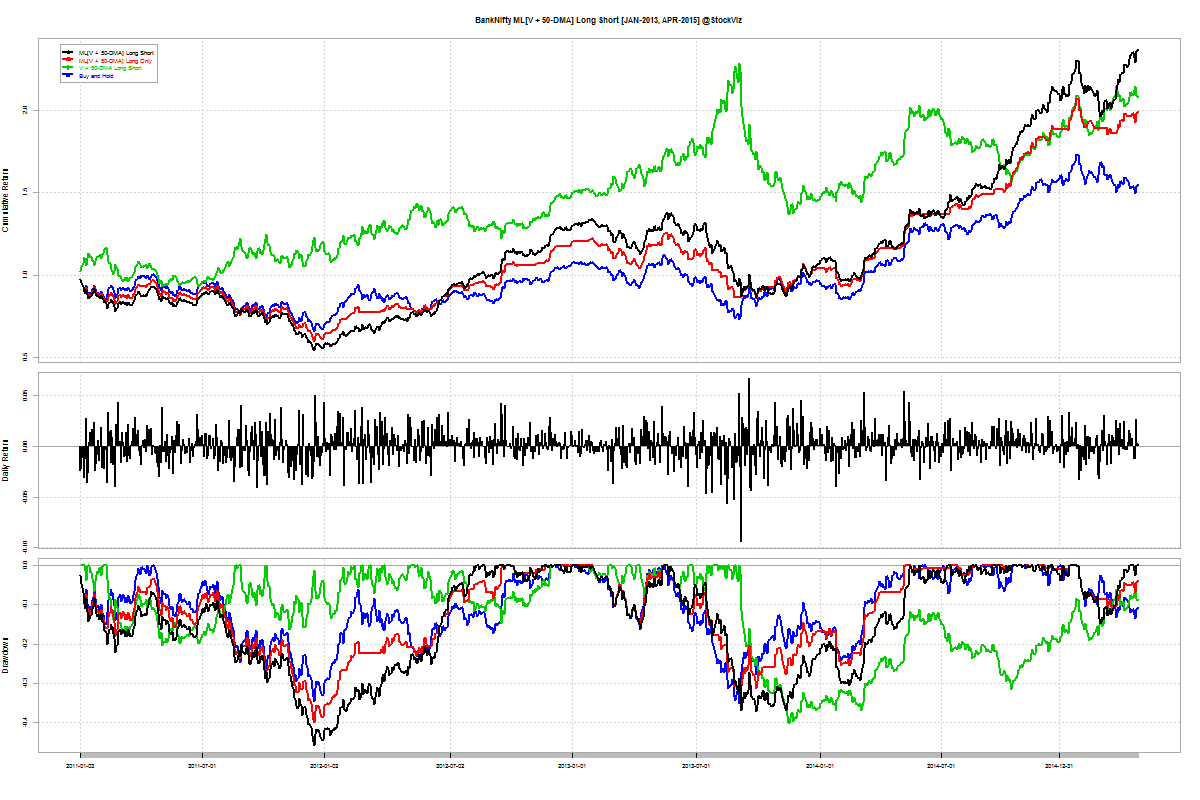
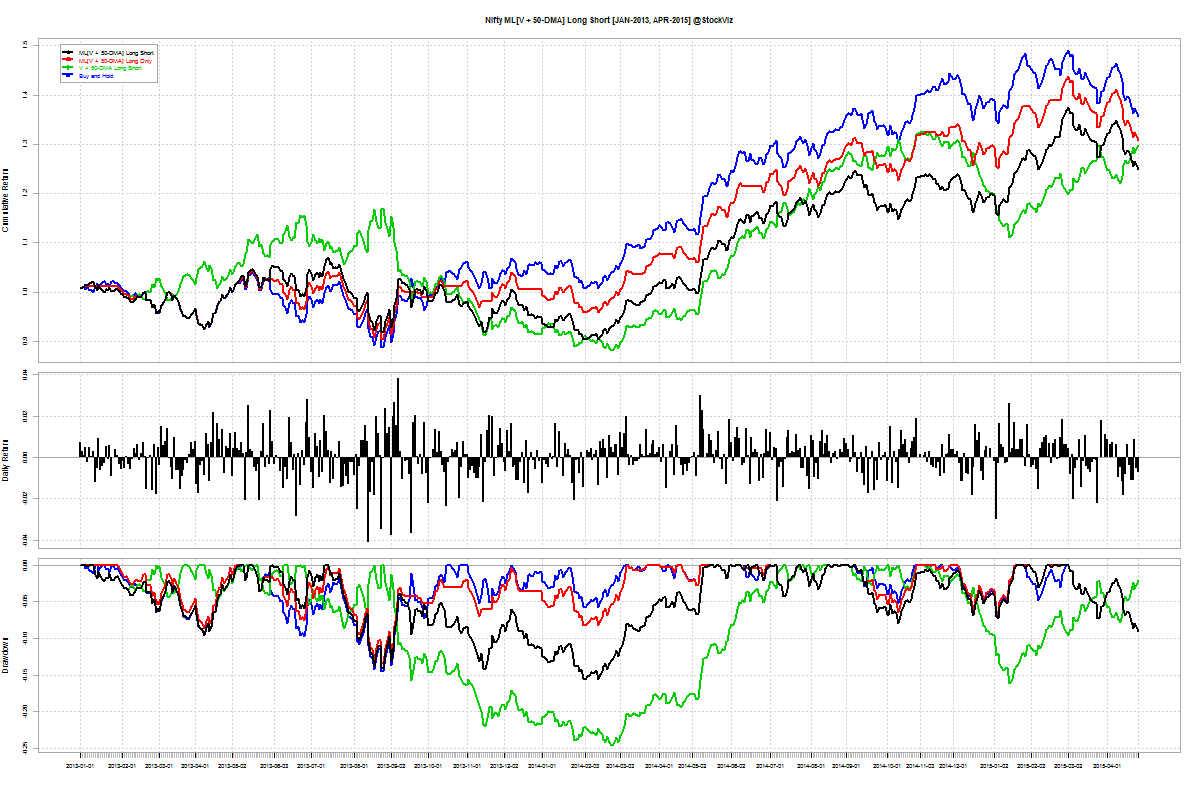
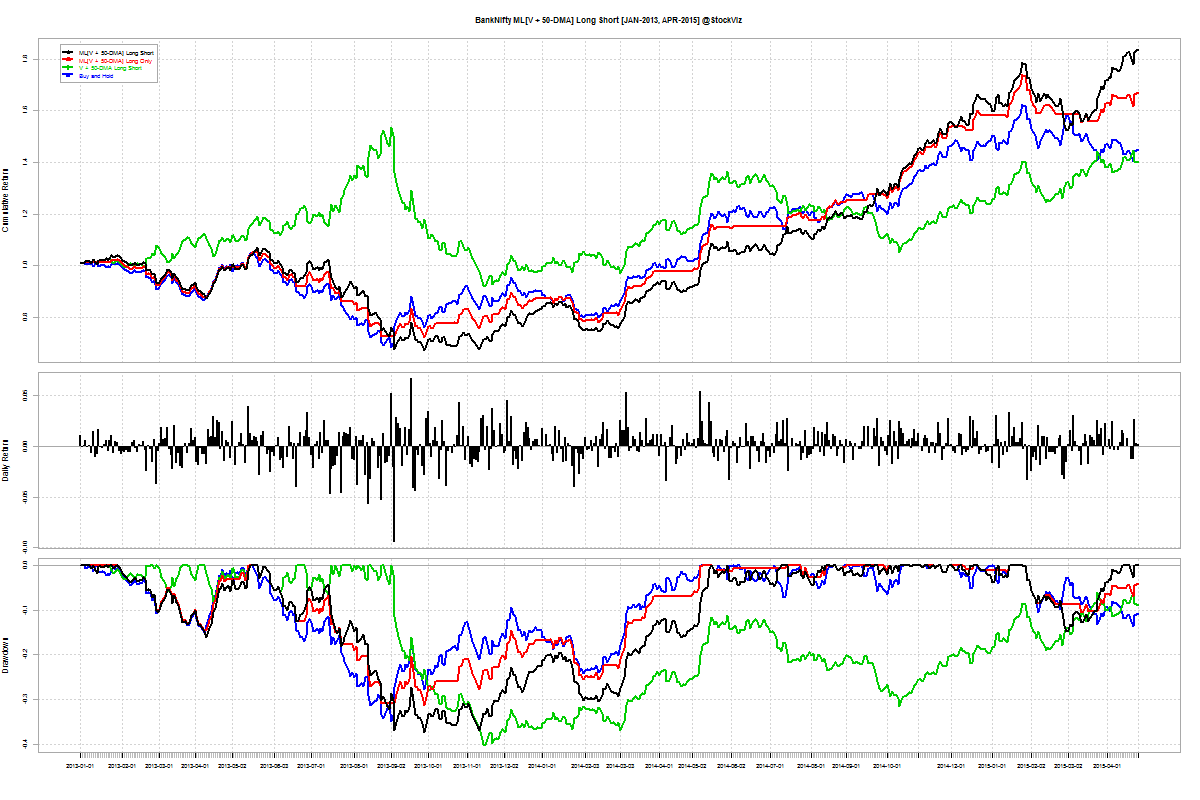
Long-short Momentum
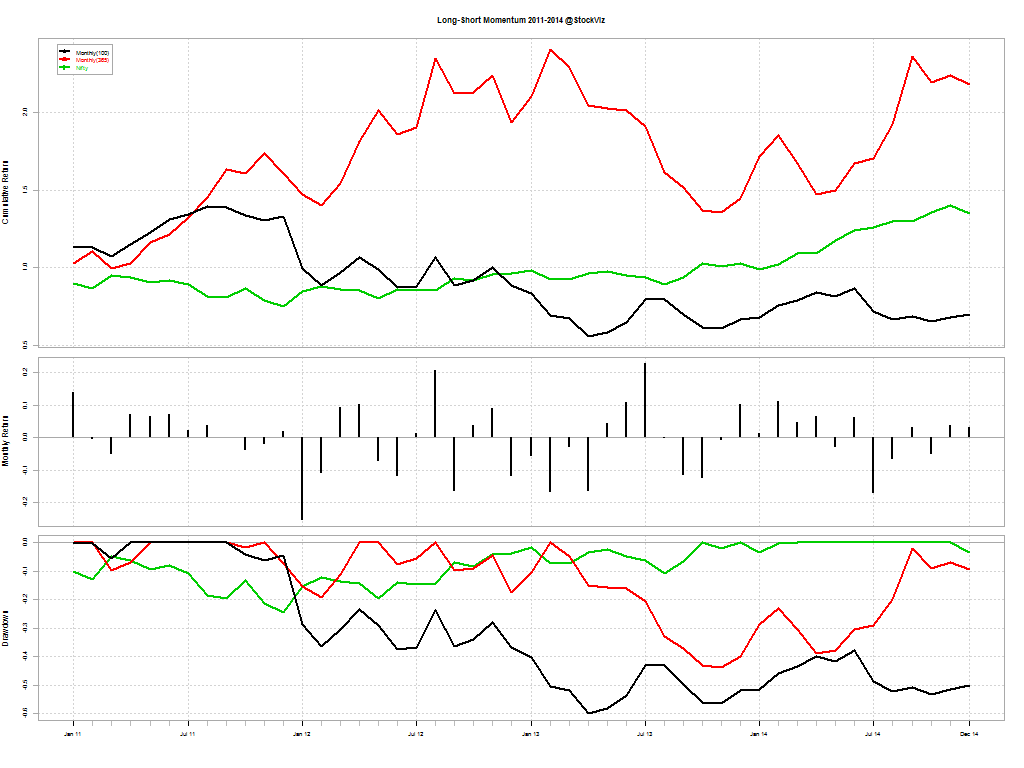
You would think that shorting “weak” stocks should give returns comparable to going long “strong” stocks. But that doesn’t seem to be the case. The short-portfolio was always a drag on performance and made returns more volatile.
Conclusion
A long-only momentum strategy with a one-year look-back beat the pants out of both the Nifty and the long-short strategy. This could be because the pool of stocks in F&O show strong survivorship bias. We will continue to investigate if the short portfolio can be made more efficient. Stay tuned!