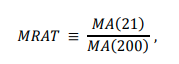
Our previous post introduced a paper that used a moving average crossover to create a portfolio of stocks. While the backtest using the parameters in the paper looks good, the presence of these “magic” lookback parameters gives us pause. Did the authors just try a bunch of different parameters and published what worked? What if we do an exhaustive search through all possible combinations?
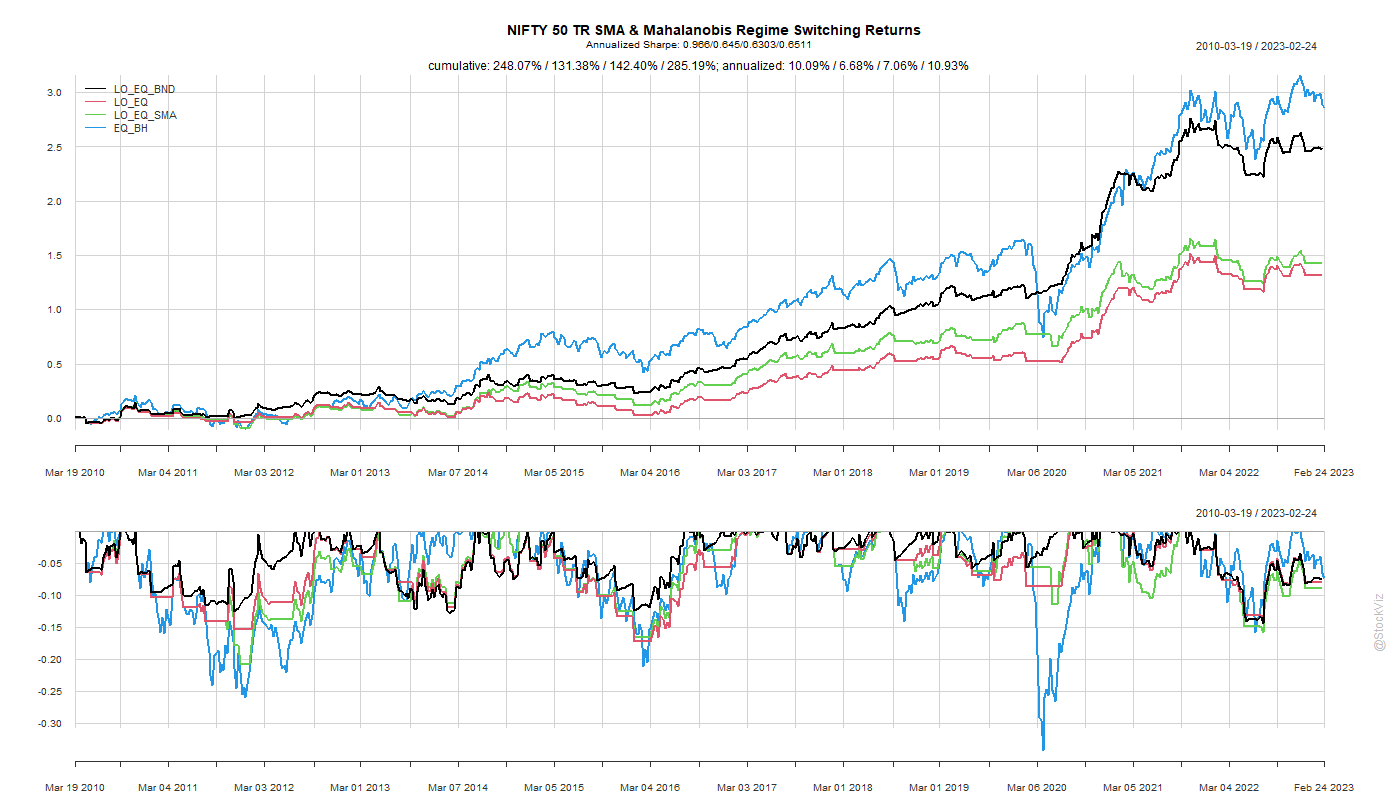
Here are the annualized returns and Sharpe ratios pre-COVID:
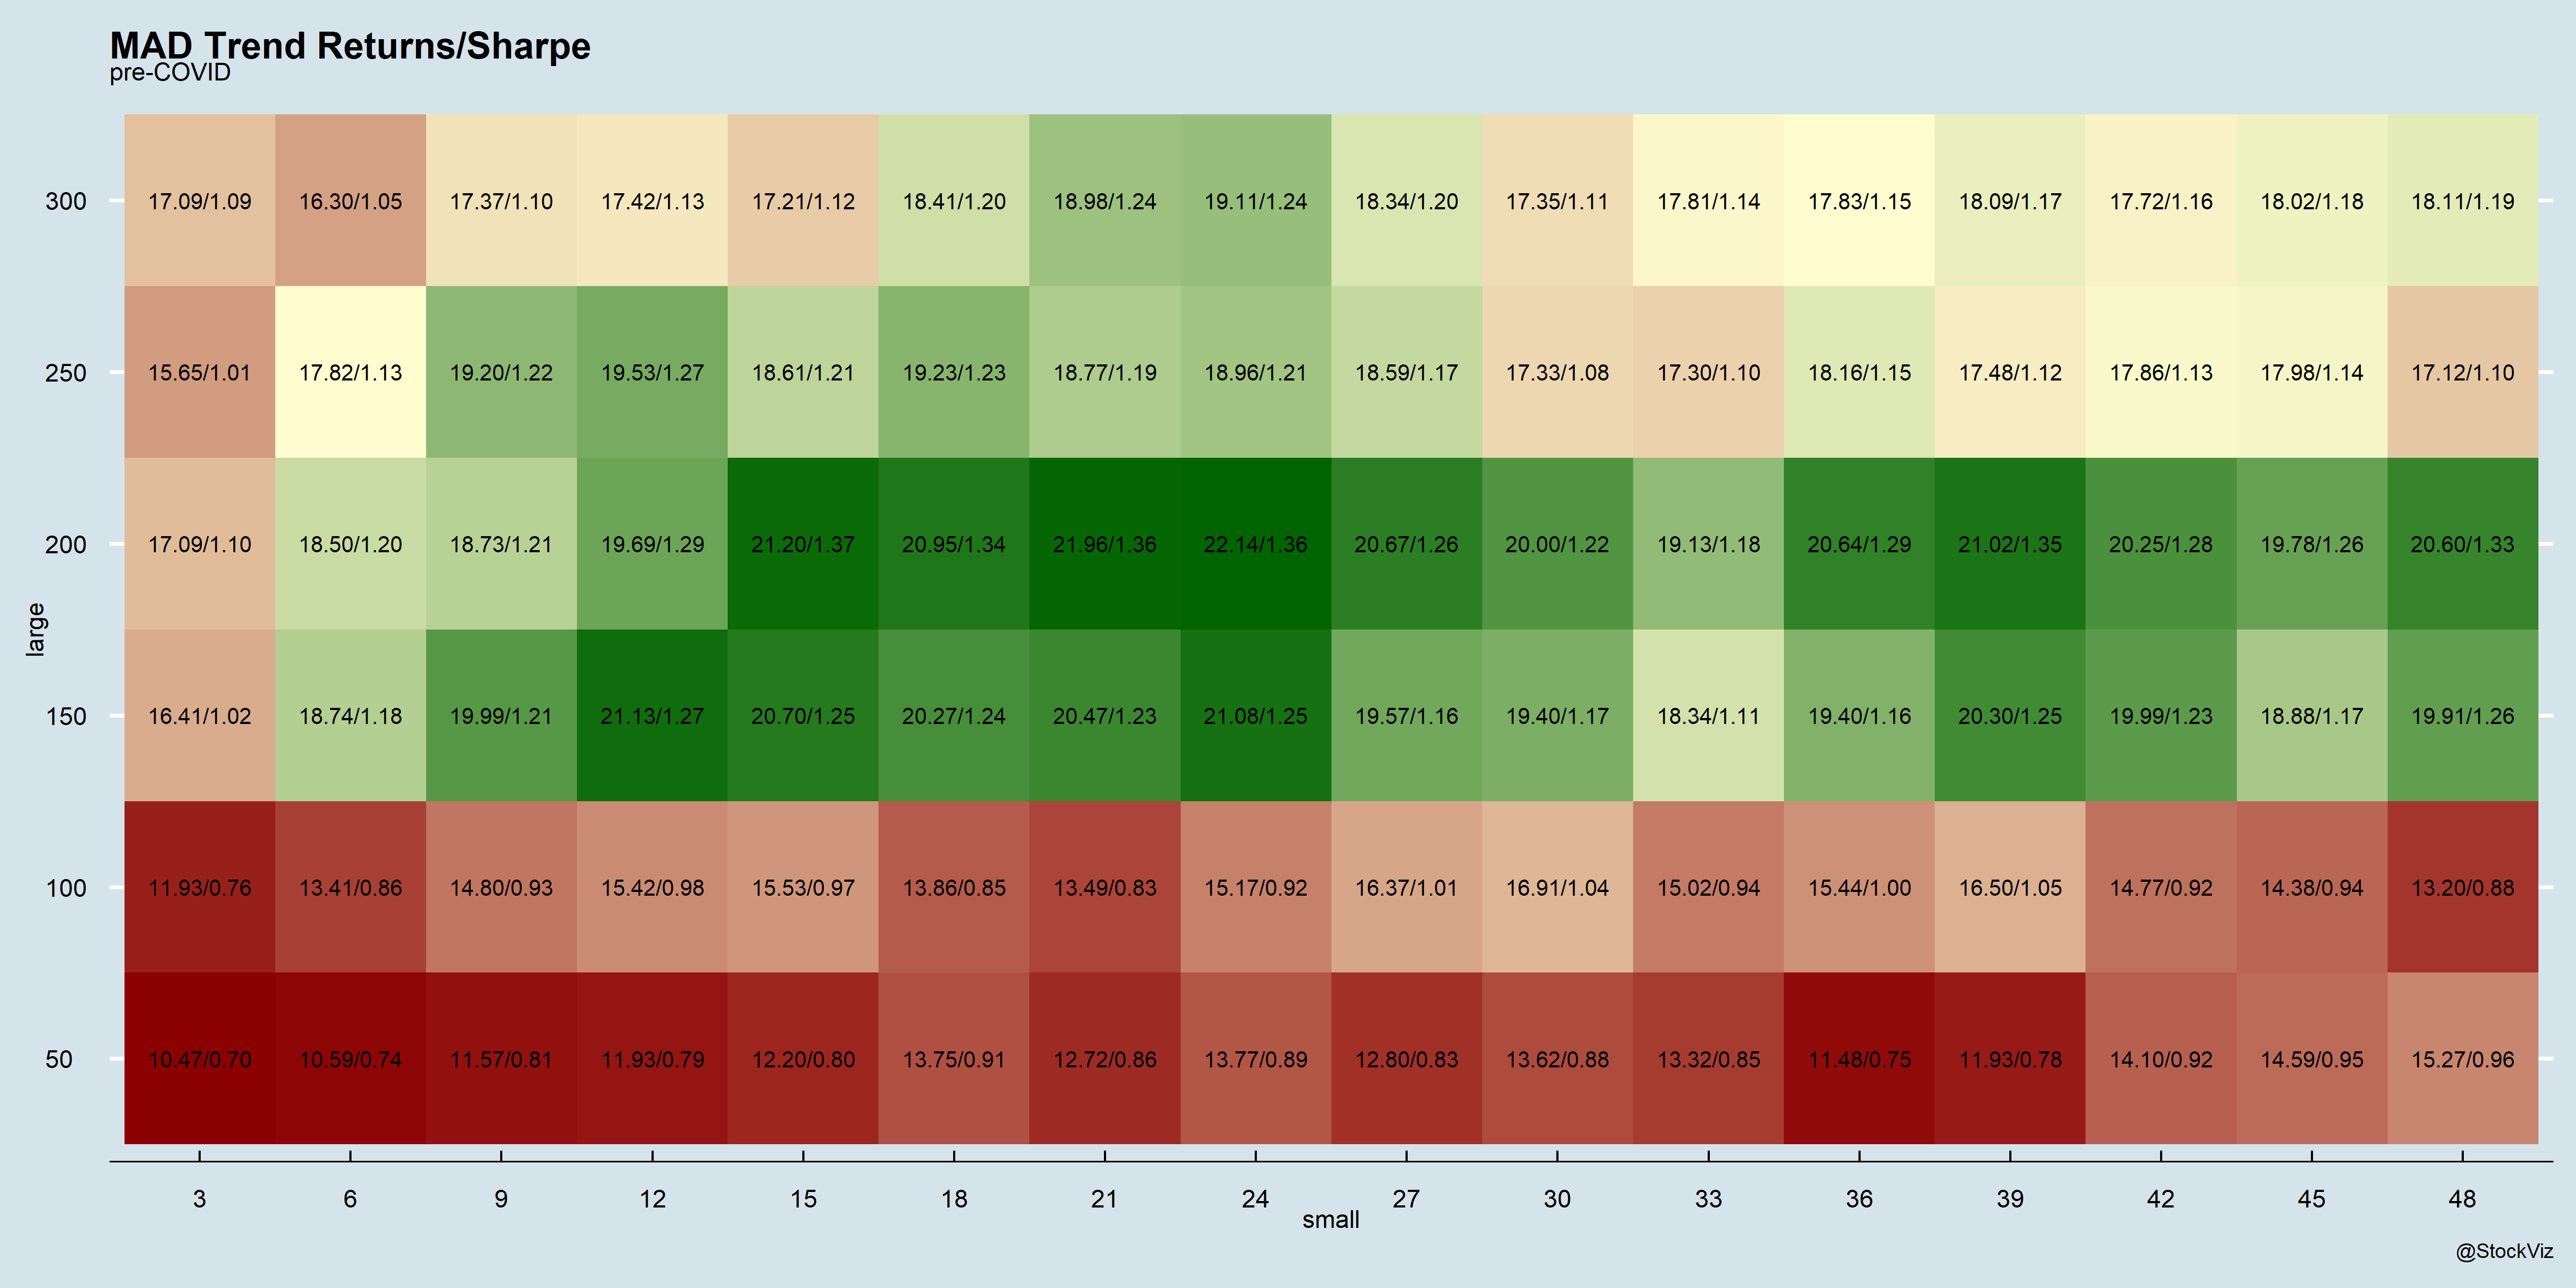

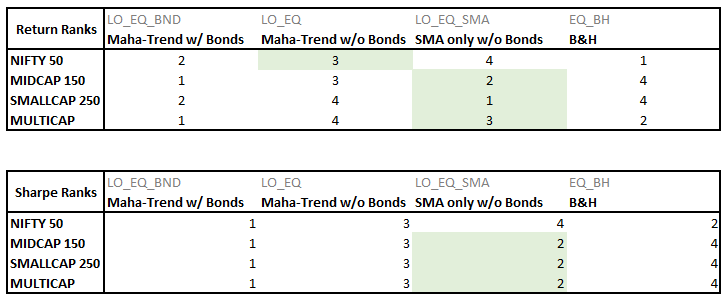
The magic 21/200 lookbacks look legit. However, the post-COVID picture looks different:


The magic parameters don’t quite figure in the top 5. However, even if you used the data-mined set, you would be ok?

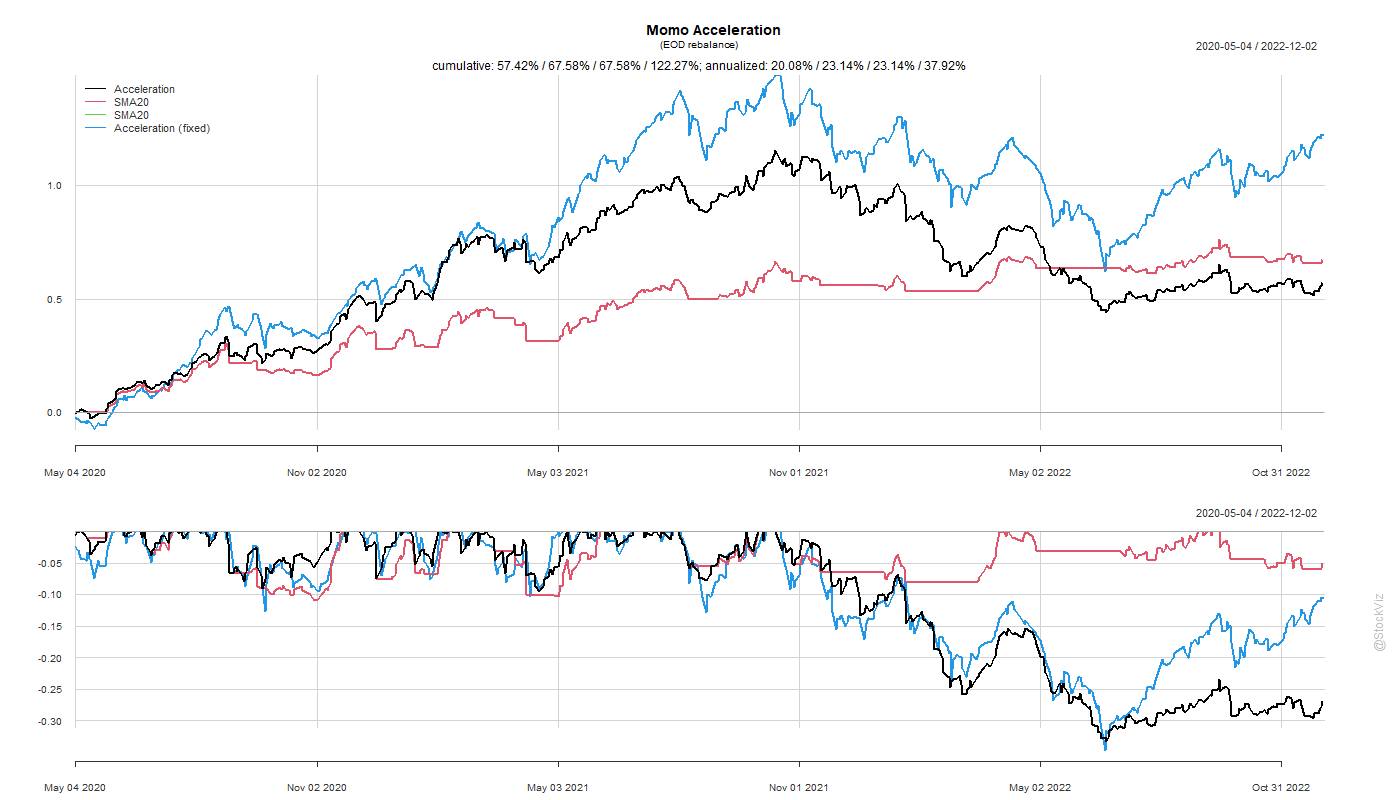
Also, the paper used a “sigma” parameter as a threshold to activate the crossover. Getting rid of it seemed to have lopped 10% off the post-COVID returns.
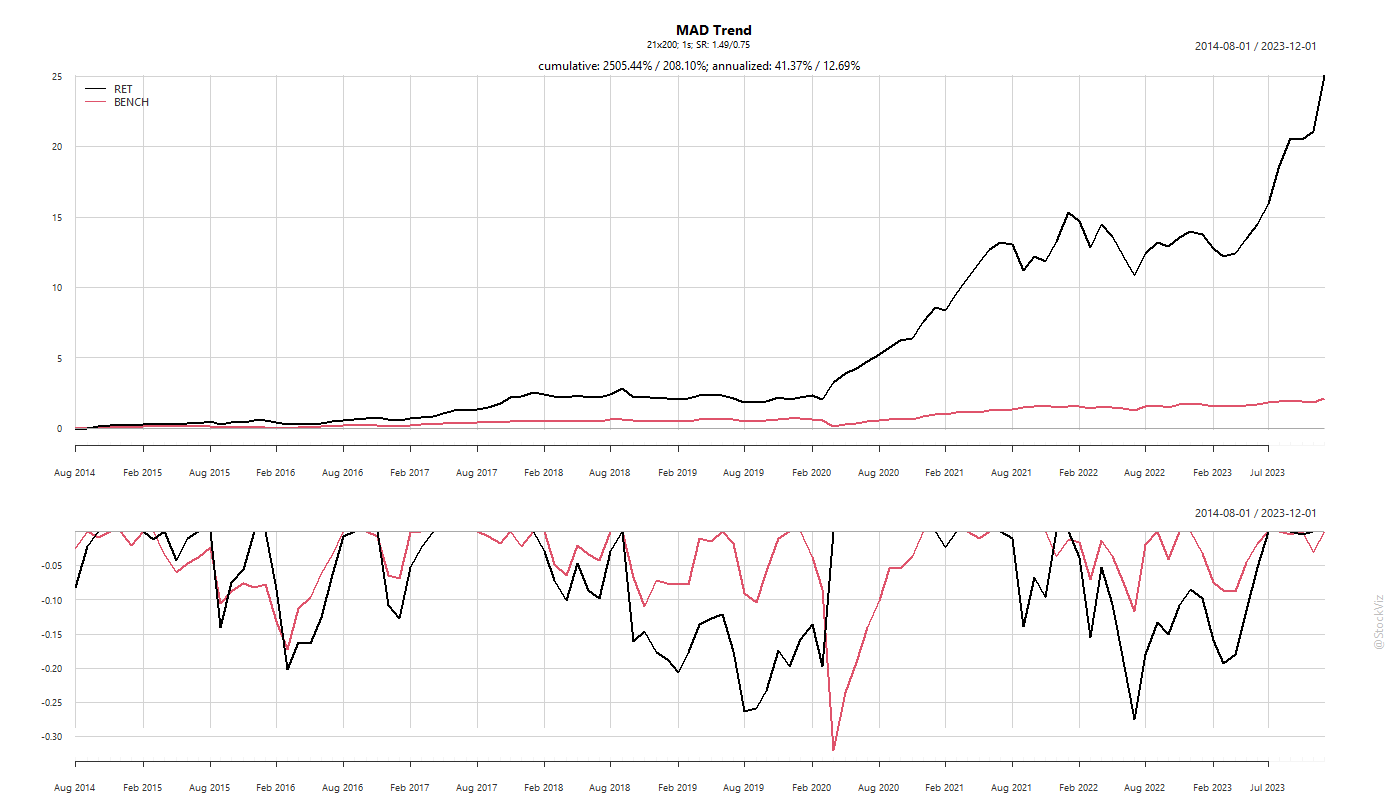
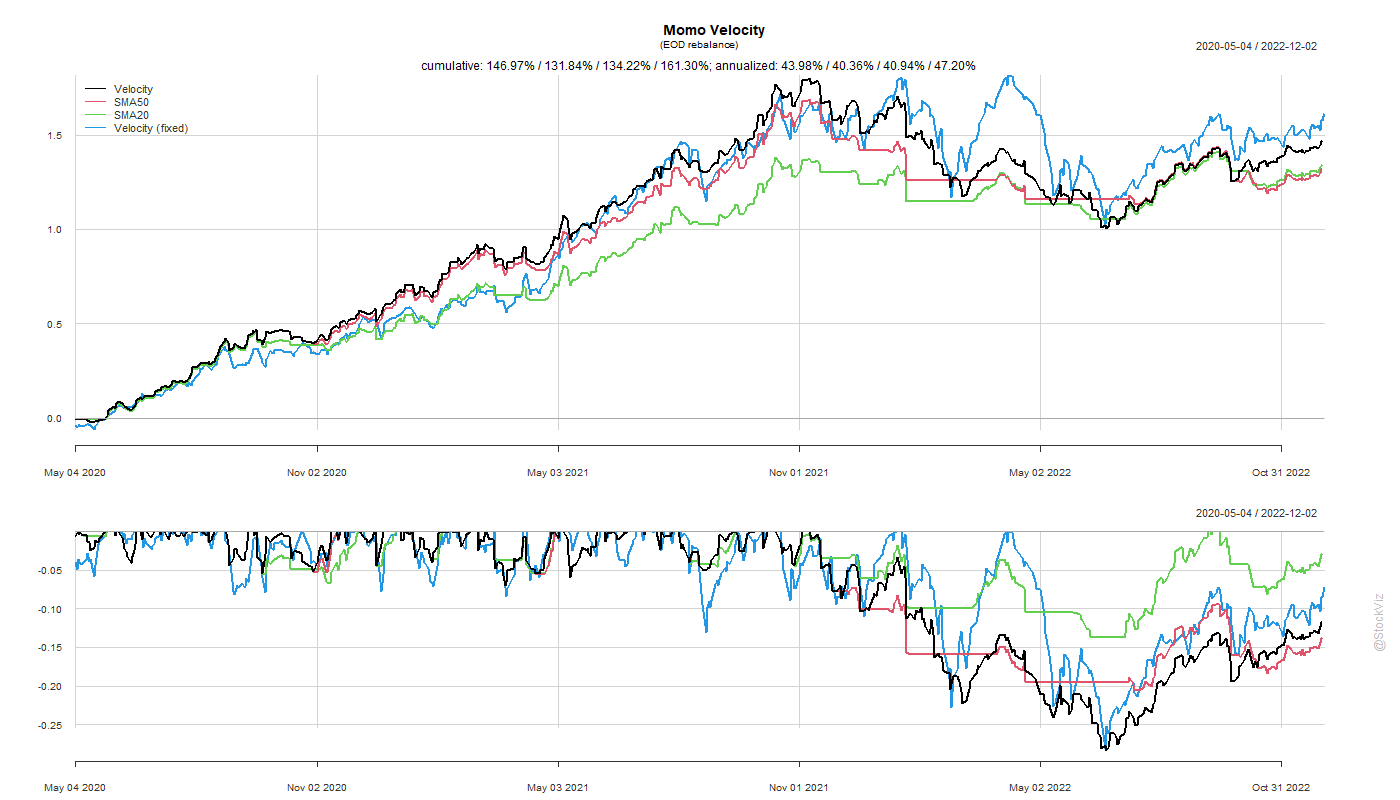
You can follow along the live version of the original strategy here: MAD 21/200
Code and charts on github.