Tag: quant

Replication

Sometimes, you many not be able to directly buy an index or access a strategy because of regulatory hurdles, mandates etc… In these situations, replicating it using a basket of accessible securities might make sense.

For example, you can replicate the S&P 500 index using Indian indices: NIFTY 50, MIDCAP SELECT and NIFTY BANK.

In fact, you can do for any reference timeseries (strategies/funds) and apply leverage as desired.

Also, the loadings give you and idea of the shifting relationship between the reference asset and the basket over time.

Code and images are on github.

Market-cap Deciles and Circuit Limits

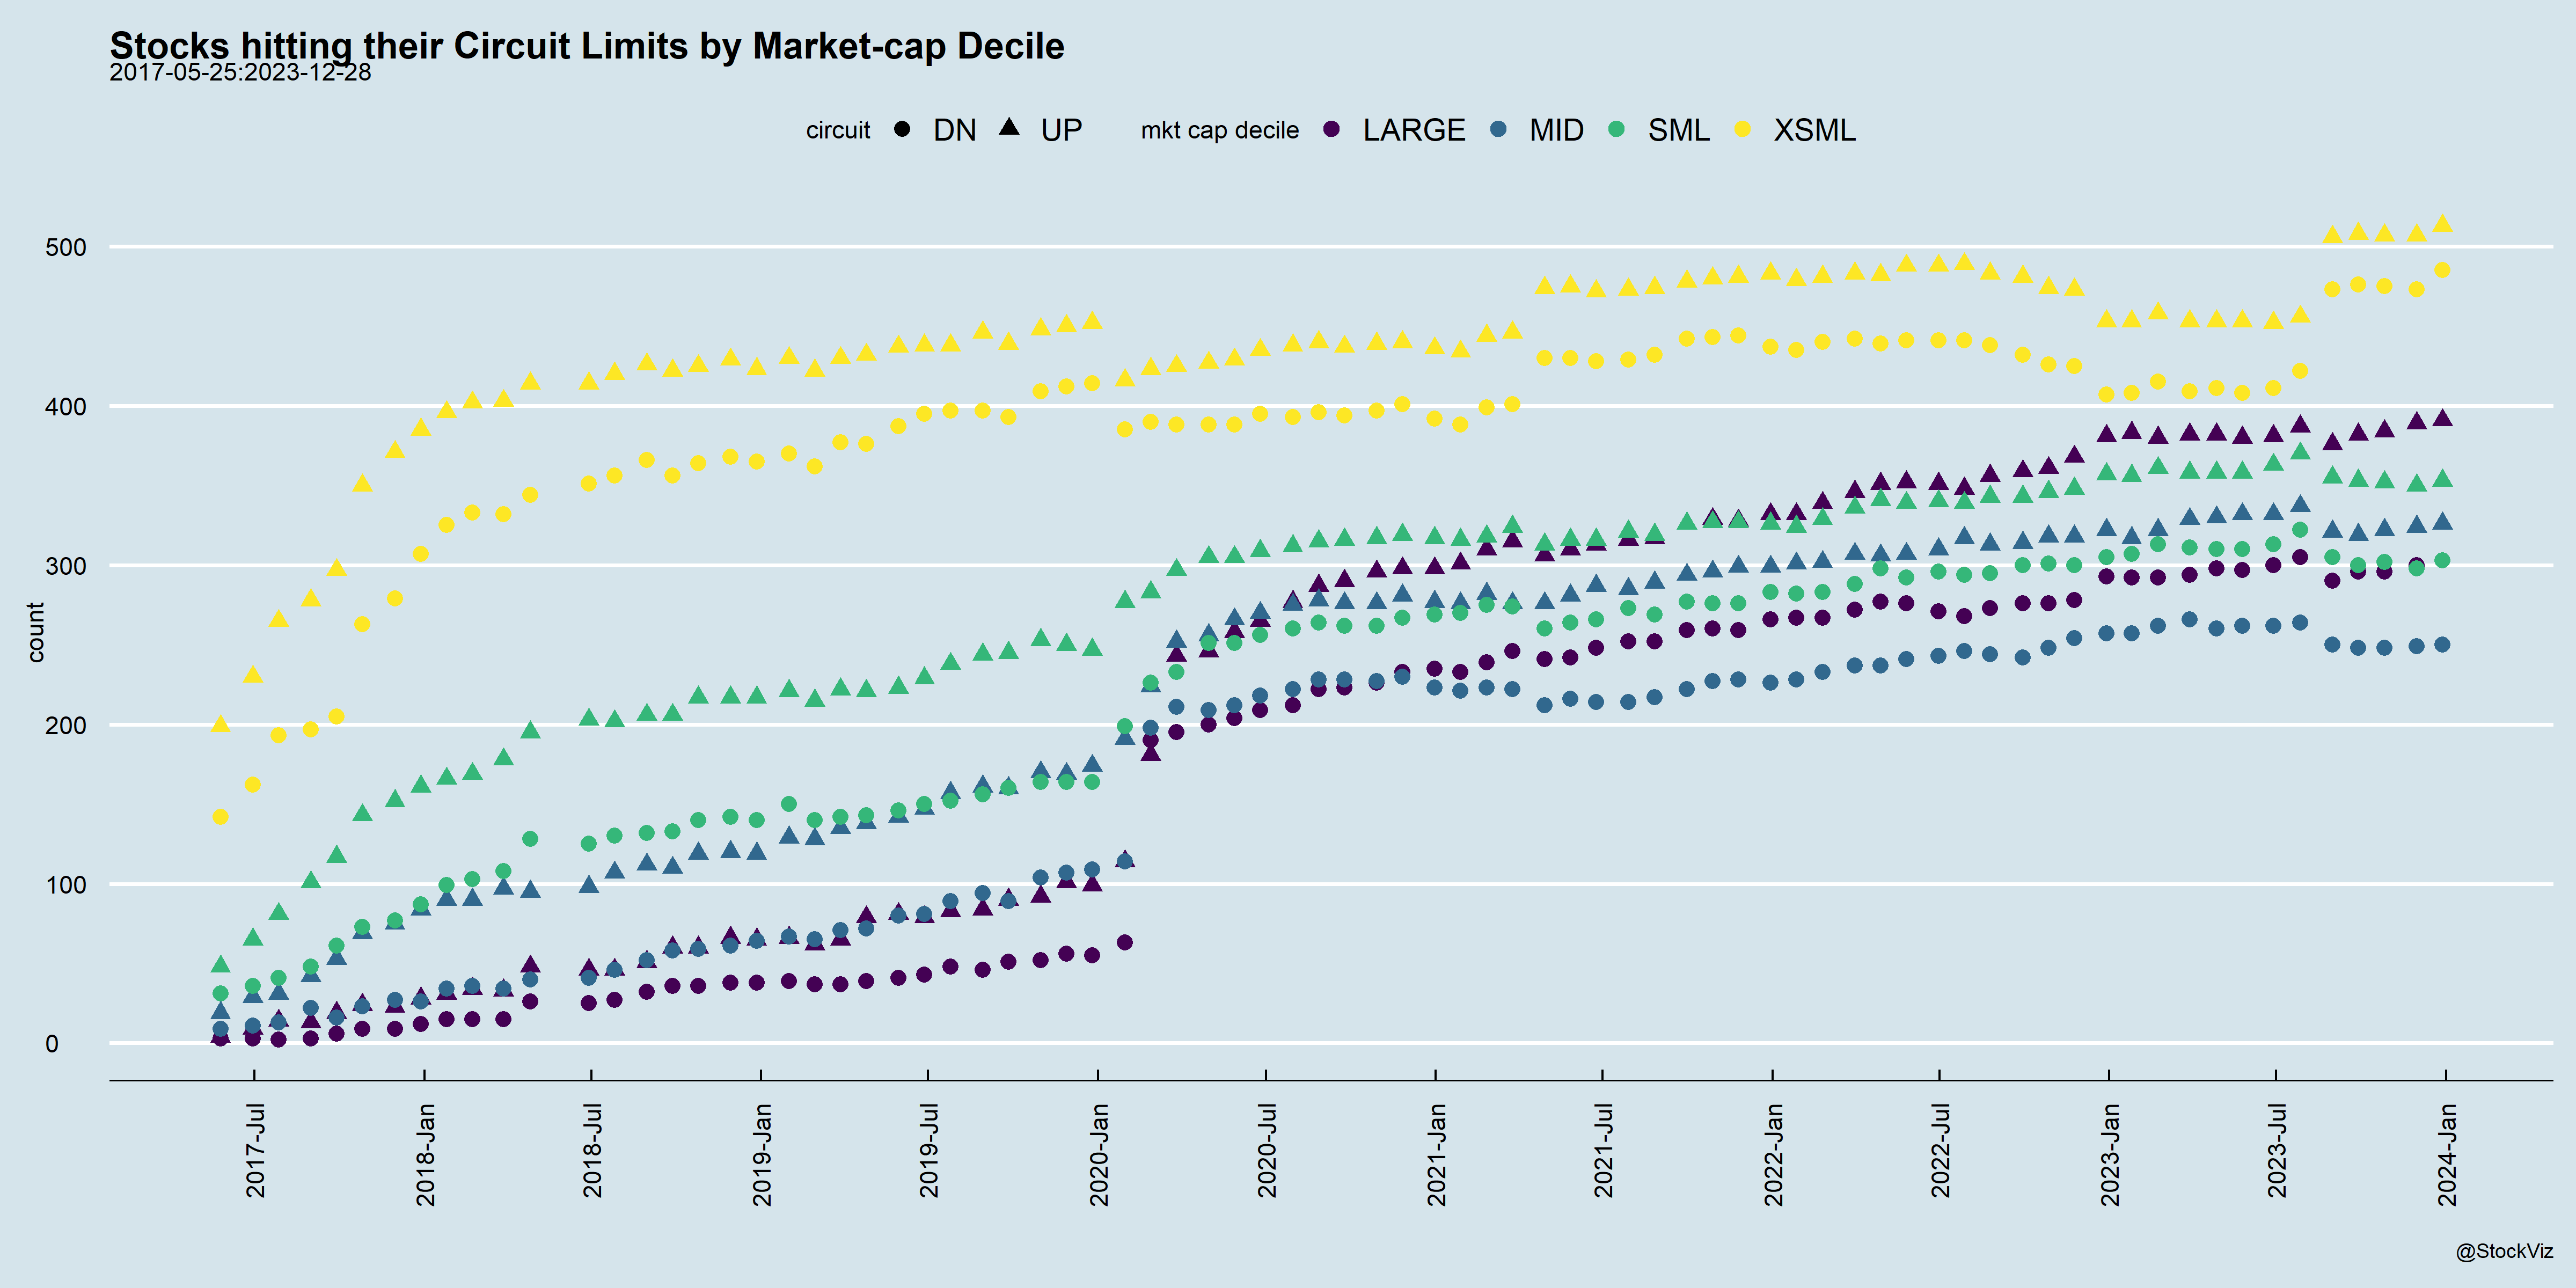
Our previous post discussed how liquidity drops exponentially as the market cap gets smaller. This illiquidity also means that a lot of micro-cap stocks spend their time out of the market.

This is a problem for direct equity investors in micro-caps if they actually try to bank the price appreciation they might have seen in the stocks that they own. And a bigger problem for momentum algorithms in the small-cap space.

Index funds in the micro-cap space have yet to go through a test of the liquidity mismatch between allowing redemptions at daily NAV vs. not being able to trade the underlying stocks for days on end.

Bull markets allow us the luxury of coming up with a plan for something that has plenty of historical precedent.

Market-cap Deciles and Illiquidity

Our previous post used AMFI’s classification of stocks by market-cap to analyze liquidity dynamics. What if we broke down the universe of stocks into their market-cap deciles and then applied the same illiquidity metric to them?

If you look at the full sample, median liquidity tracks market-cap.

Mid/small caps have an embedded illiquidity premium. While index/mutual funds are obligated to honor their NAVs on redemption, there is no guarantee that direct equity investors can exit without taking a direct hit. Liquidity flees during market stress.

During bull markets, the taps are open. December 2017 was the absolute zenith of the mid/small cap mania. Liquidity was ample.

A month later, the hangover began. Erstwhile small-cap momentum stocks would hit their lower-circuits within a few seconds of the open. The market-clearing price for some of them were a cool 40%-50% away from where they finished 2017. It was weeks of watching the portfolio slowly bleed away.

All this to say, understanding liquidity dynamics is as important as understanding the fundamental and technical aspects of the stocks you own.

Market-cap Classification and Illiquidity

Twice a year, AMFI is tasked with categorizing the universe of stocks into “large/mid/small” and funds with specific market-cap mandates are allowed to invest in only the corresponding set of stocks (amfiindia, sebi). We have a report that shows these changes over time (stockviz).

Given the massive flows involved, what is the prospective impact on liquidity as stocks get promoted and demoted between these classes?

We measure illiquidity using Amihud’s (Illiquidity and stock returns, 2002) illiquidity measure ILLIQ.

Between market-cap classes, the differences in liquidity is large enough to warrant a log-scale:

With this large disparity in mind, we can now look at the impact of migrations.

Large-cap Exits

Mid-cap Promotions

Mid-cap Demotions

Small-cap Promotions

It appears that stocks that get promoted from mid-caps to large-caps turn a bit illiquid. Otherwise, most migrations have negligible impact on their forward six-month illiquidity measure.

Code and charts on github.

Volatility Lookbacks

Volatility is calculated over a time period – the lookback. While developing a strategy, it is typical to try a range of lookbacks and pick one that looks reasonable for the strategy being built. However, is there an “ideal” lookback period?

This is where a volatility signature plot comes into the picture. It is typically used in high frequency trading but there is no reason not to use it on a lower frequency time series.

If you plot the distribution of volatility over different lookbacks, this is how it looks:

Ideally, you want the box to be small, the median in the middle and the wicks to be short. After all, if you are using volatility to drive a strategy, if the distribution of volatility itself is too wonky, then how do you trust the output?