Tag: live portfolio

Live Portfolio trades for Feb/19

When stocks behave oddly than they should have over a 5 days time, its better to get rid of them even though they are making loss. This strategy doesn’t hold good for long only investor, because they don’t have to actively manage their portfolio.

Hence, UCOBANK [stockquote]UCOBANK[/stockquote] that was stuck in the portfolio since long needed a push out. The stock in the holding period made a –5% return. Although, selling this stock provided us opportunity to hold another stock where the technicals are supporting a buy.

The RSI and CMO levels are confirming an up-move, which is being pushed further ahead by the bullish penetration of the signal line by the MACD line.

NTPC Technical analysis chart

Hopefully, the technicals will prove themselves again as they did for FKONCO, which is up 11% since I included in the portfolio this Friday.

The portfolio currently looks as follows.

Untitled

Cheers!

Live Portfolio: trades for Feb/7

When markets don’t help you, you need to help yourself. In the last three days, the technical trades were not able to do a very good job. And I also learned that having 3 stocks in portfolio, still is concentrated. Hence I tapped on the opportunity created today in the markets, to expand the portfolio into a couple of more stocks with bullish technicals.

I cut back my holdings on UCOBANK [stockquote]UCOBANK[/stockquote]to half, and CAIRN [stockquote]CAIRN[/stockquote] to three quarters to take new positions in SAIL [stockquote]SAIL[/stockquote] and PETRONET[stockquote]PETRONET[/stockquote]. Here is why..

It is clearly visible for SAIL that the oscillators are nearing the over-sold levels, and hence an opportunity is being created for the stock to start its up-move. The stagnating MACD lines are in confirmation as well.

SAIL technical Analysis Chart

Again, for PETRONET, the oscillators are much below their historical reversal levels, suggesting of an up move possibility.

PETRONET technical analysis chart

Although, partial closing of positions did take the poheatmaprtfolio a bit down, but I am sure that in the longer turn of events putting eggs in different baskets is going to help.

Here’s how the performance and portfolio looks like currently.

Portfoliotrades


Cheers!!

Live Portfolio – Initialized Feb/4

Making use of technical analysis has always been a adrenaline rush for me, and I have been doing it for a long time now. But, from now on I will be sharing the trades and the ideas behind them with all of you. This portfolio will be of select few stocks that are picked up just for the technical reasons, and for the risk management reasons, I will be making both Buy and Sell calls for them.

Stocks that I bought today are CAIRN [stockquote]CAIRN[/stockquote], UCOBANK [stockquote]UCOBANK[/stockquote] and, VOLTAS [stockquote]VOLTAS[/stockquote]. Below are the price charts of all the above with reason of the transaction.

Cairn India Technical Chart

Its quite visible, that the CAIRN’s stock is going to experience the golden cross of 50×200 bullish cross-over, and the combination with declining histogram levels of MACD are suggesting a short-term up move for the scrip. The convergence of RSI with price action is also giving a positive support for the thesis. Also, the stock is trading close to the lower Bollinger-band, suggesting an upcoming Bullish move.

For UCOBANK, the stock was in a flag formation for a while and has been trading close to the lower Bollinger-band. An opportunity is visible around the current levels, with the increasing RSI levels combined with increase in volumes. Although, for the stock it is suggested to have Trailing stop losses in place.

UCOBANK Technical Chart

The last stock is VOLTAS and it has broken out of a downward flag on Wednesday, confirmed by the large number of trades on Thursday and close above the upper line of Flag. The increase in RSI is also suggesting improved buys for the stock.

VOLTAS Technical Chart

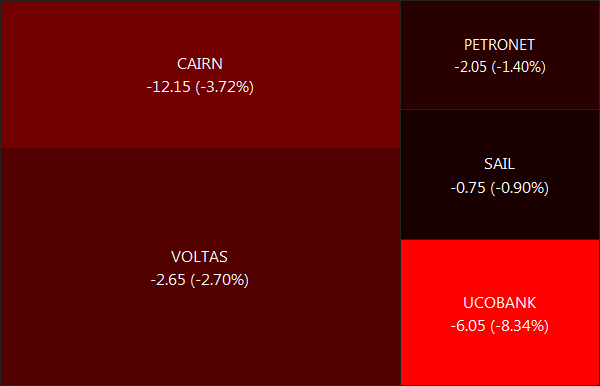
Here’s how I have allocated the trades:


Abhishek's portfolio

As you can see, its more or less an even split. And our demat account holders know the screen below very well:

StockViz Order Screen

Its tough trading when you have the spotlight focused on you. Fingers crossed!