Equities
| MINTs | |
|---|---|
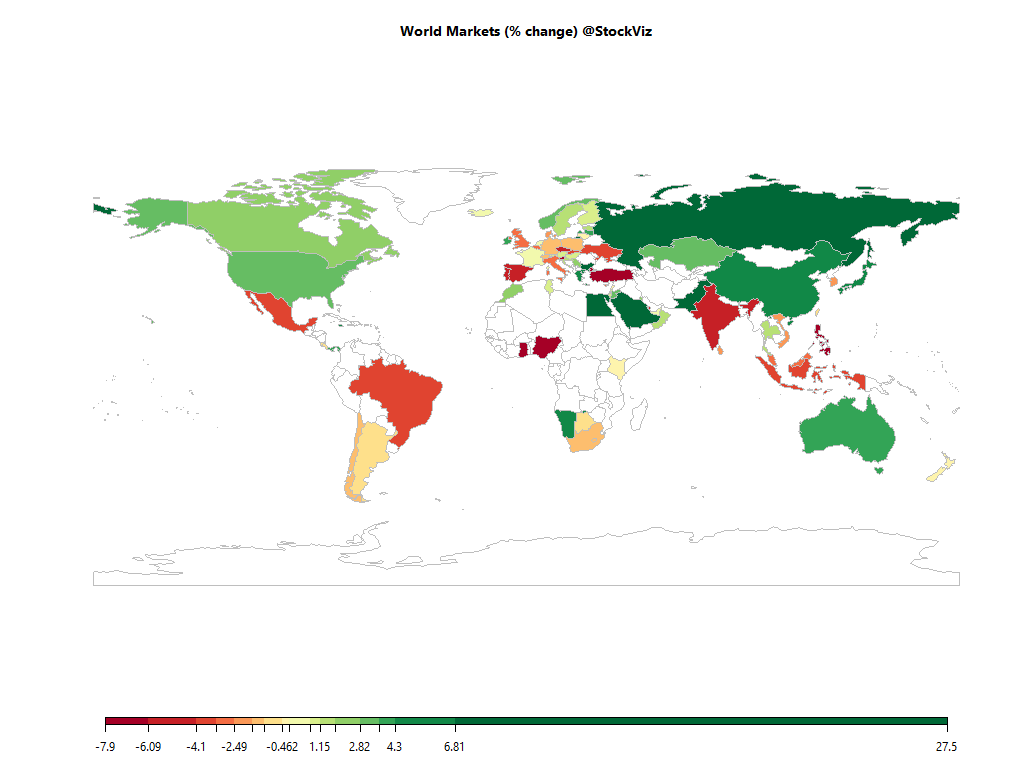
| JCI(IDN) | -3.98% |
| INMEX(MEX) | -3.71% |
| NGSEINDX(NGA) | -7.52% |
| XU030(TUR) | -6.87% |
| BRICS | |
|---|---|
| IBOV(BRA) | -3.29% |
| SHCOMP(CHN) | +5.45% |
| NIFTY(IND) | -4.84% |
| INDEXCF(RUS) | +6.85% |
| TOP40(ZAF) | -1.62% |
Commodities
| Energy | |
|---|---|
| Brent Crude Oil | +4.77% |
| Ethanol | +0.61% |
| Heating Oil | +2.42% |
| WTI Crude Oil | +1.81% |
| Natural Gas | +7.24% |
| RBOB Gasoline | +1.03% |
| Metals | |
|---|---|
| Gold 100oz | -8.32% |
| Palladium | +24.50% |
| Platinum | -7.73% |
| Silver 5000oz | -7.82% |
| Copper | +20.55% |
Currencies
| MINTs | |
|---|---|
| USDIDR(IDN) | +3.91% |
| USDMXN(MEX) | +8.08% |
| USDNGN(NGA) | -1.26% |
| USDTRY(TUR) | +10.80% |
| BRICS | |
|---|---|
| USDBRL(BRA) | +5.92% |
| USDCNY(CHN) | +1.71% |
| USDINR(IND) | +2.33% |
| USDRUB(RUS) | +1.38% |
| USDZAR(ZAF) | +0.91% |
| Agricultural | |
|---|---|
| Lean Hogs | +8.46% |
| Lumber | +9.68% |
| Coffee (Arabica) | -10.77% |
| Coffee (Robusta) | -7.49% |
| Corn | -4.93% |
| Cotton | +2.47% |
| Feeder Cattle | +5.36% |
| Orange Juice | -0.05% |
| Soybean Meal | -0.13% |
| Soybeans | +3.47% |
| Sugar #11 | -10.56% |
| Wheat | -7.27% |
| Cattle | +6.29% |
| Cocoa | -13.63% |
| White Sugar | -10.64% |
International ETFs (USD)

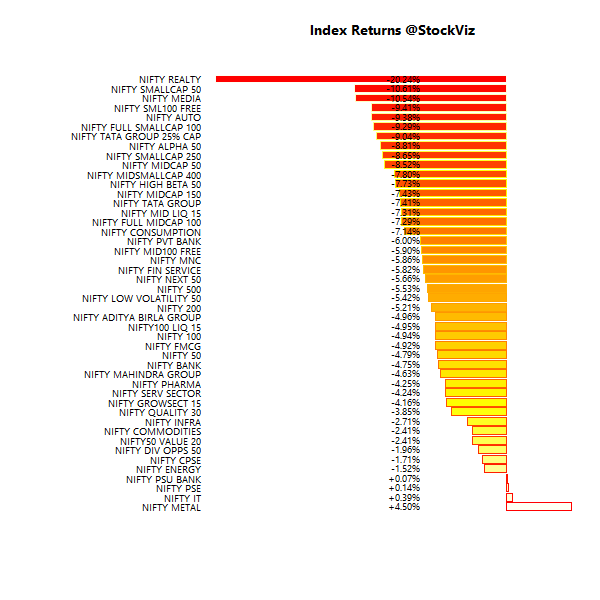
Nifty Heatmap

Index Returns

More: Sector Dashboard
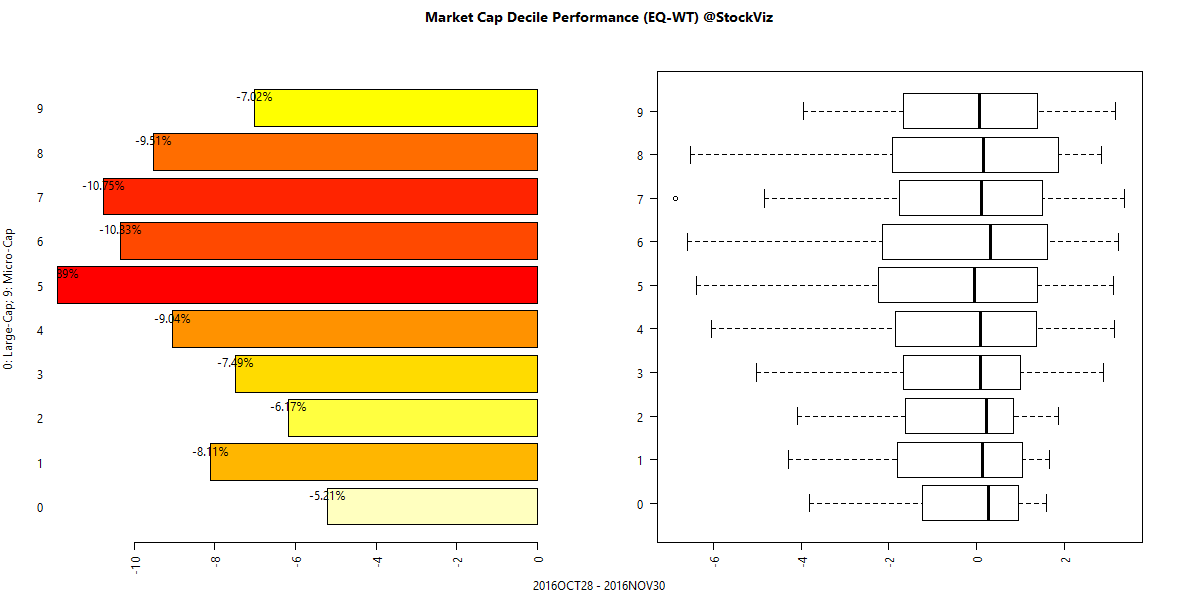
Market Cap Decile Performance

More: Equal-Weight Deciles, Cap-Weight Deciles
ETF Performance
| PSUBNKBEES | +1.05% |
| CPSEETF | -1.20% |
| INFRABEES | -2.19% |
| BANKBEES | -4.50% |
| NIFTYBEES | -4.83% |
| JUNIORBEES | -6.29% |
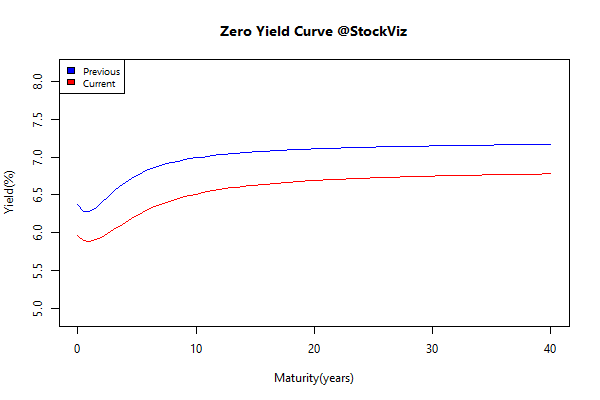
Yield Curve

Bond Indices
| Sub Index | Change in YTM | Total Return(%) |
|---|---|---|
| 0 5 | -0.49 | +2.02% |
| 5 10 | -0.55 | +3.55% |
| 10 15 | -0.51 | +4.53% |
| 15 20 | -0.42 | +4.68% |
| 20 30 | -0.43 | +5.57% |
Investment Theme Performance
| Momo (Velocity) v1.0 | -0.93% |
| Momo (Relative) v1.1 | -1.85% |
| HighIR Momentum | -2.12% |
| Momo (Acceleration) v1.0 | -2.46% |
| Balance Sheet Strength | -3.76% |
| Magic Formula | -6.08% |
| Enterprise Yield | -7.75% |
| Financial Strength Value | -8.09% |
| Acceleration | -9.66% |
| Quality to Price | -11.61% |
| Momentum | -14.04% |
| Velocity | -14.10% |
Equity Mutual Funds
Bond Mutual Funds
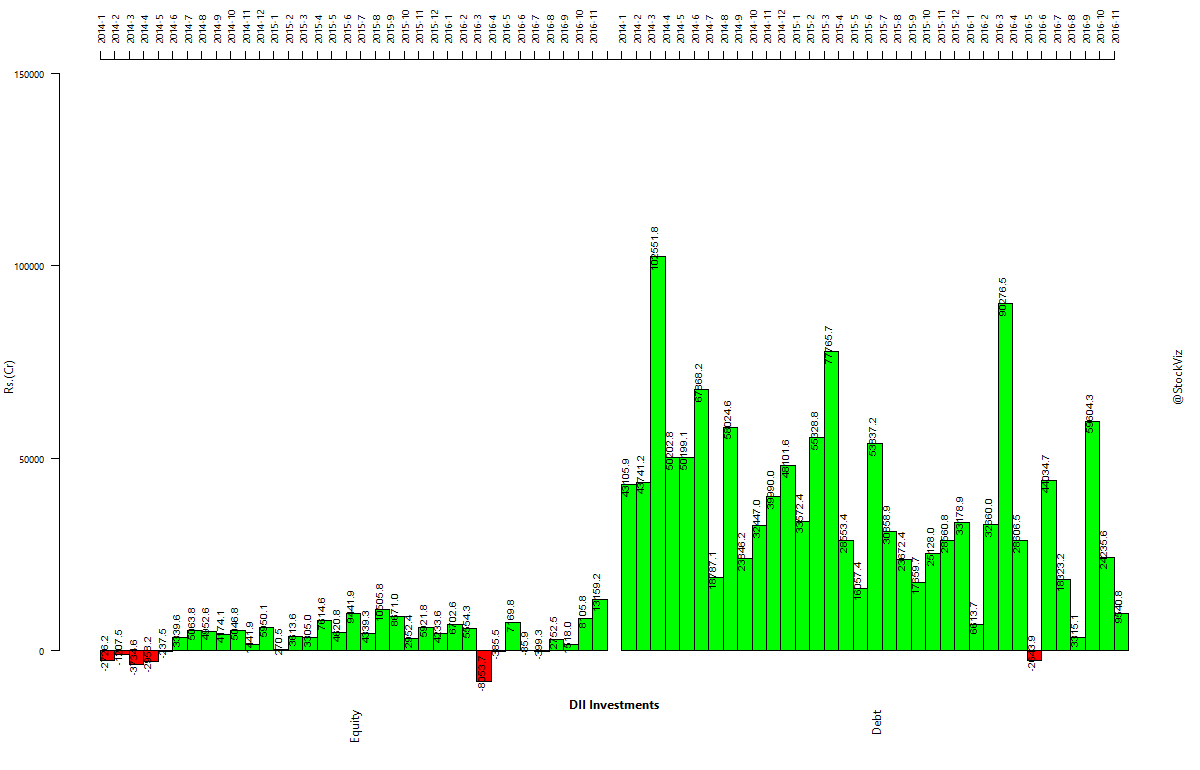
Institutional trends

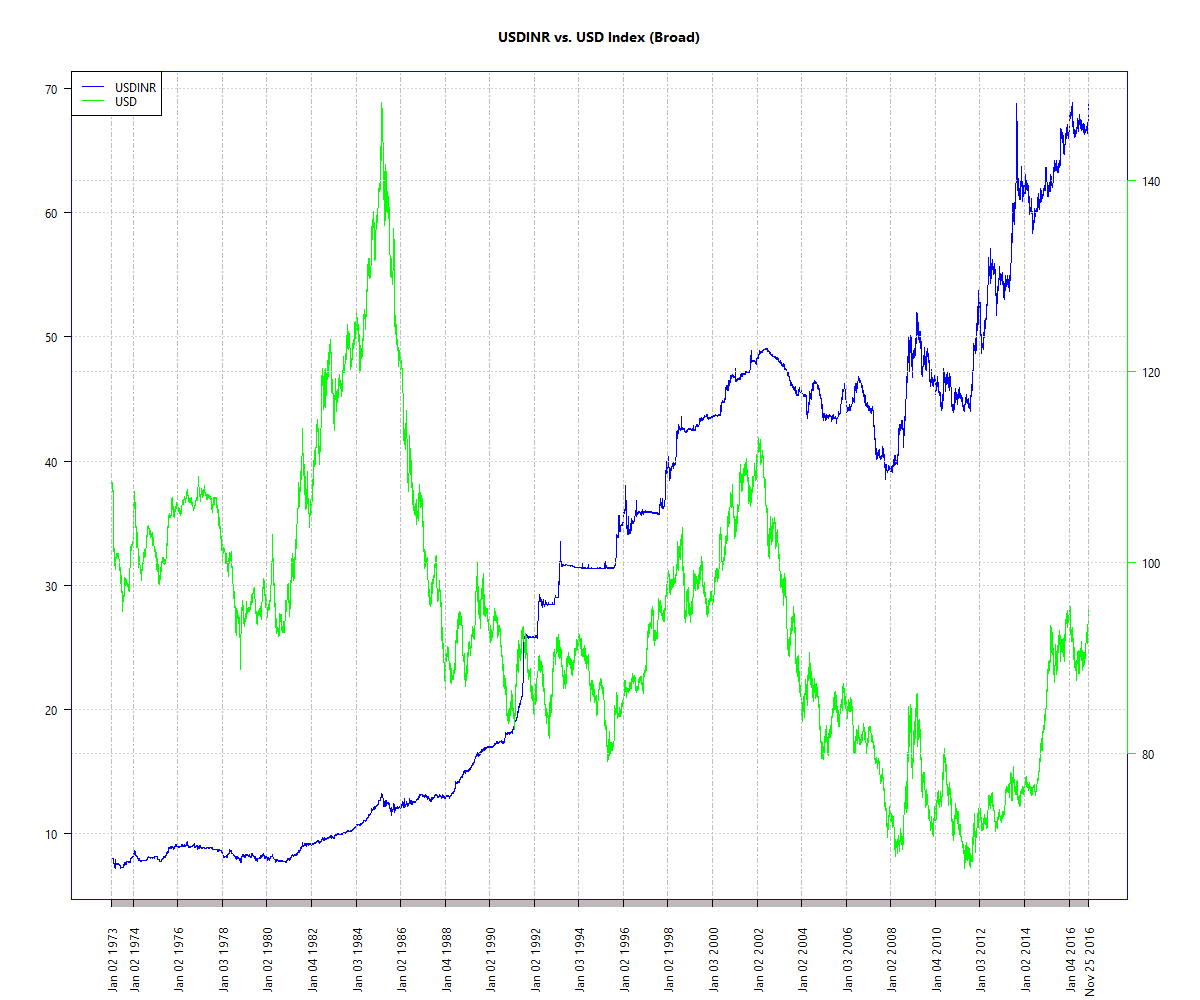
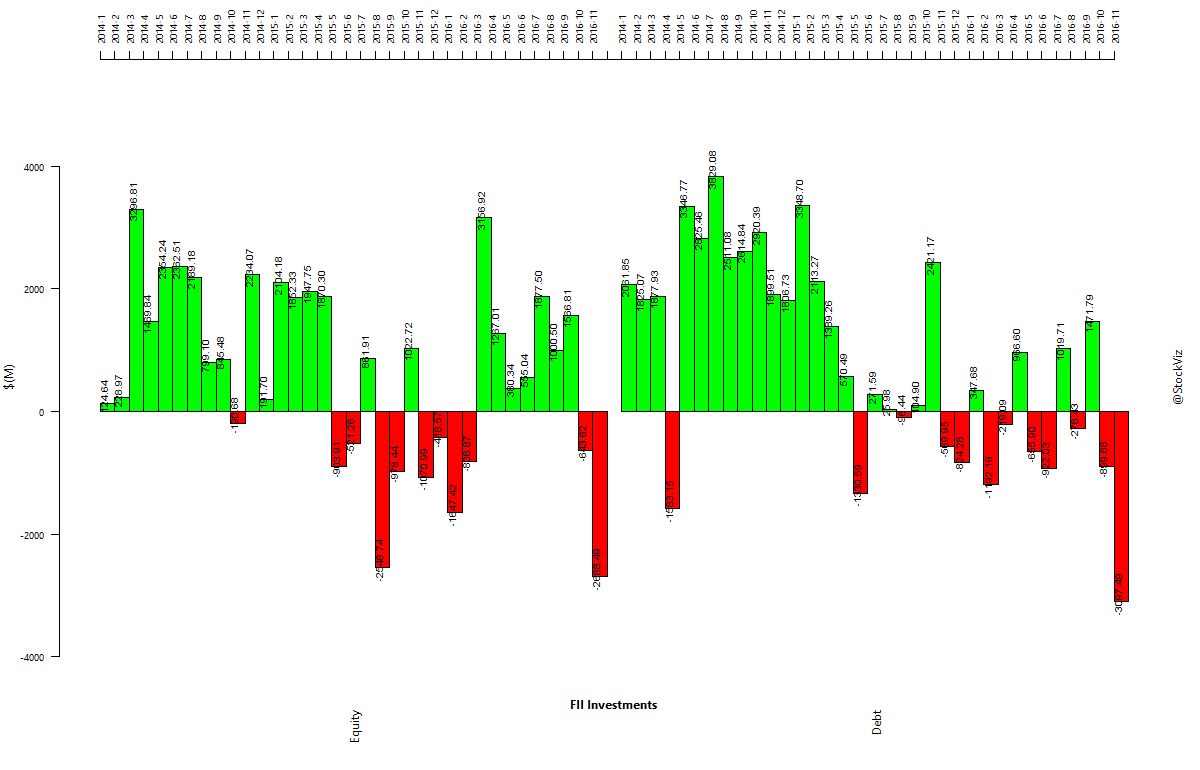
FIIs trampeded out of both bonds and equities in November. Tump’s win lead to a steep rally in the US dollar and a spike in US bond yields that sucked liquidity out of risk assets.

Books I read in November
The Clash of the Cultures: Investment vs. Speculation (Amazon, Notes)
John Bogle, the father of index funds lays out the case for passive indexing. His main argument is that as most of the assets are held by institutional managers who compete with other institutional managers and are more focused on asset gathering than being fiduciaries, investors should quit active management and buy-and-hold passive investments that just track a broad-based market-cap index at a low cost.
He makes this argument for the US markets, where institutional ownership of equities is over 70%. It is something that Indian investors should make a note of. As of right now, institutional ownership of equities is low. But as mutual funds, NPS and AIF ownership begin to cross over 50% of the market, it is time to shift from active to passive.
The Party: The Secret World of China’s Communist Rulers (Amazon, Notes)
tl;dr: The Chinese Communist Party owns everything in China.