Continuation of the review of the 4th chapter of John J. Murphy’s Technical Analysis of the Financial Markets (prev.)
The Fan Principle
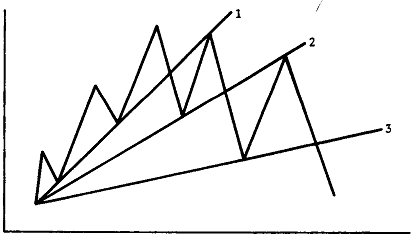 Sometimes, after an uptrend breaks down, prices will go down a bit before rallying up to the bottom of the old up trendline (now a resistance). A 2nd & 3rd trendine can now be drawn. If the 3rd trendline doesn’t hold, it shows that prices are headed much lower.
Most important up trendlines usually have a slope of about 45*. If the trendline is too steep, then it usually indicates that the prices are rising too rapidly and may not sustain; too flat, then it should not be trusted.
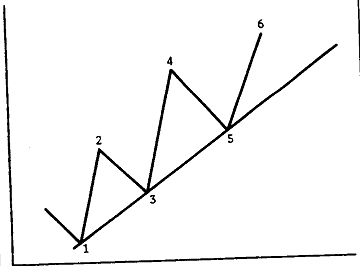
Sometimes, based on prices movements, trendlines need to be redrawn. Here’s an example of a steep uptrend becoming a flatter one:
Trendlines are drawn and redrawn based on both the market as well as the trader’s time horizon.

Here, you have the major trend (1), a bunch of medium-term trends (2, 3, 4) and a short term trend (5).
The important thing to note is that in all of these cases, there is always retracement. These countertrend moves typically happen in either 50%, 1/3rd and 2/3rd moves before it goes back to following the trend. If you are looking for a buying area under the market, you can compute a 33-50% zone under the chart and use it a reference for putting on longs.
Note that if the prior trend has to be maintained, the correction must stop at 2/3rd (66%). If the prices move beyond this point, then the chances of a trend reversal are higher.
Speedlines
Speedlines measure the rate of ascent or descent of a trend (its speed). These lines act as support during market corrections. To construct a speedline for an uptrend: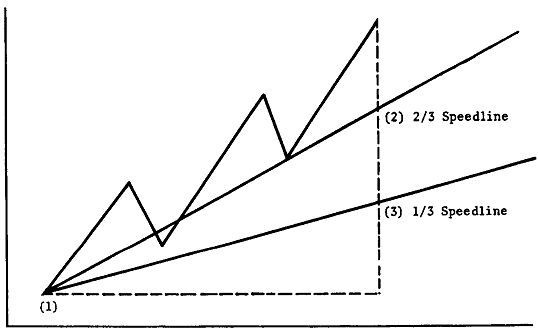
- Find the highest point in the uptrend
- From the highest point, drop a vertical line to the bottom of the chart from where the trend began
- Divide the vertical line into thirds and draw a line from the beginning of the trend through these points.
Speedlines need to be redrawn every time a new high (during an uptrend) or a new low (during a downtrend) is set. And these might go right through the price action.
Up Next: Reversals and Price Gaps