Always know if the juice is worth the squeeze
Unless you’ve been living under a rock the last month, you couldn’t have missed the GameStop (GME) short squeeze. A stock that was trading below $3 a few months ago suddenly shot up to $483 before collapsing to $63 yesterday. While the media narrative focused on how a bunch of YOLO traders in a subreddit took on Wall Street, what it really was, was a short-squeeze of epic proportions.
Why short a stock?
There are a lot of legitimate reasons to short a stock.
You think a company is committing fraud. You short the stock and publish a report hoping to convince other investors to short it along with you and draw regulators to investigate the company.
NEW FROM US: Clover Health: How the “King of SPACs” Lured Retail Investors Into a Broken Business Facing an Active, Undisclosed DOJ Investigation cc @chamath hindenburgresearch.com/clover/ $CLOV (1/x)

You think a company is headed towards bankruptcy where the stock is going to be worth zero. You short the stock and publish a report hoping to convince other investors to short it along with you1.

You run a relative value or merger-arbitrage strategy. You go long company A vs. short company B, pocketing the spread. For instance:
IBM’s bid for multinational software company Red Hat is a case in point, he says. ‘Red Hat had declined, its stock had gone down from a $170 peak in the summer to trade at $150 in Q4 and then it dropped to $120 before the IBM bid. So a $120 stock gets a $190 offer and, ironically, the market prices in a wider spread.
‘That’s a 60% premium but it wasn’t really much of a premium when you look at where Red Hat had been at its height.’
You are mostly long stocks or bonds and you want to limit your downside by shorting stocks.
You want to express a macro view. For example, if you think the entire housing market is going to collapse, then you can express that view by shorting housing stocks, housing-credit, etc.
Short-selling is an essential lubricant of the markets. It makes the market more efficient2.
When does it go wrong?
The problem with short-selling is that it has always seemed “wrong.” Elected representatives want to be seen encouraging entrepreneurship and short-sellers are the proverbial thorn in their sunny-skies-forever narrative. Over a period of time, this tilt against shorting has rigged the market to overwhelmingly favor longs.
To short-sell (i.e., sell a stock that you don’t own,) you need to first “borrow” it from someone. The lender demands that he be paid a fee for it. And if the stock price goes up, the borrower owes the difference to the lender. Also, in some cases, the lender has the right to recall the securities with little notice (“at call” 3.)
Usually, short-selling is as boring as long-buying. The practice is well understood and usually goes on without a hitch. But ever so often, things tend to go spectacularly wrong.
Asymmetric payoff
Suppose a stock is trading at Rs. 100 and you decide to short it. Your maximum profit is Rs. 100 whereas the person taking the long-side of it has no such limit to the upside. If the stock starts going up, you really have no way of telling what the eventual loss is likely to be. Beyond a certain limit, you’ll try and cover your short by buying the stock back in the market. But what if there are not enough stocks for you to buy?
Liquidity
There is a big difference between total market cap4, free float market cap5 and the number of shares that can be traded without making an impact6. Take Infosys (INFY,) for example.
Its total market cap is Rs. 5,42,24,574.74 lakhs and free float market cap is Rs. 4,71,41,375.59 lakhs. This means that more than 85% of the total number of stocks is available to trade. But on any “normal” day, only a small fraction of it trades. In INFY’s case, its 0.15%. And all this happens with an impact cost of 0.02%.
Now, contrast this to HATHWAY. Its free float is only 6% and about 1% of it trades in a day with an impact cost of ~1%
If you were equally bearish on these two stocks, which one is a better short?
The answer is INFY.
You are not the only shark in the tank
The biggest mistake that most investors make is assuming that they are the only player in the field. But the market is filled with sharks that will rush towards a drop of blood at the slightest hint.
In our example, when you short INFY, given the sheer amount of stocks available in the market, your actions are unlikely to raise eyebrows. However, if you shorted HATHWAY, then things are going to get interesting for you.
The dynamics of a short squeeze
Lets say that you are so bearish on HATHWAY that you decide to short about Rs. 100cr worth of the stock. Assuming that you were conservatively leveraged at 2x, all you had to do was put up Rs. 50cr in capital. But the total free float is Rs. 322cr and only about Rs. 1.7cr in value gets traded every day.
Either the news gets out that someone is short or the hero that you are, you send out a research report on why the company should be worth zero and everybody else should join you.
However, the sharks have their own take on this. It wouldn’t take much to move the price of a stock that trades only Rs. 1.7cr in value a day. Instead of shorting along with you, they decide to buy it. With its high impact cost, even a few small accounts buying 1-10 lakhs every day is enough to push the stock higher.
Now, you are on the clock. Every day, you have to post margin to maintain your short. You see the price go from Rs. 30 to 32, then to 35… 40. A 30% rise in price means that you have lost Rs. 30cr on a starting capital of Rs. 50cr. You decide to throw in the towel and buy some of the stock back. The sharks smell blood and move in for the kill.
There are no stocks to buy.
?? ???
Diamond hands to the moon.
You panic close your short and send the stock rocketing to the moon.
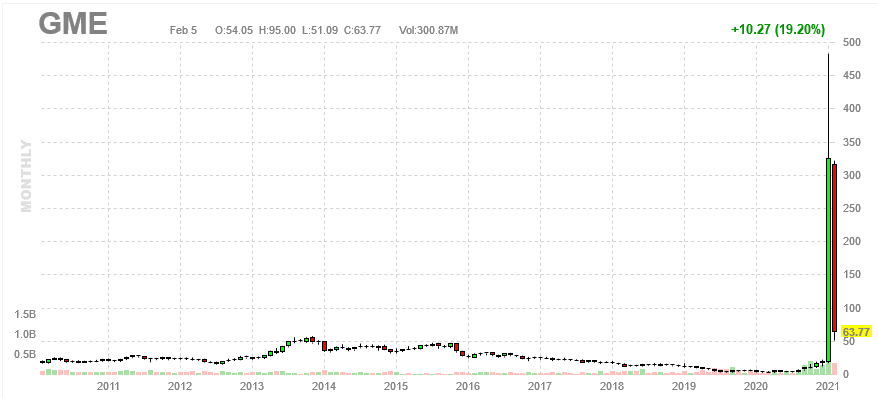
This is exactly what happened to GameStop last month.
Not the first time, and will not be the last
Short-squeezes have been around since the dawn of markets.
The earliest one in recorded history was Piggly Wiggly7, circa 1923. A short-squeeze sent the shares of the department store from $40 to $124. But in typical Wall Street style, when the going got tough, they just changed the rules8.
The shorts were cornered and only had until the next day (Wednesday) to deliver their shares. But then, the rules changed.
The Governing Committee of the Exchange announced a suspension in Piggly Wiggly trading and an extension to the short sellers delivery deadline. Saunders countered and offered a deal of $150 a share for delivery by end of day Thursday and $250 a share thereafter.
Unfortunately, very few short sellers came forward to pay Saunders what he wanted. Then, the Governing Committee delivered the death blow to Saunders. They restricted trading of Piggly Wiggly and gave the short sellers until the next Monday to deliver the shares.
The extension granted by the Committee gave the shorts enough time to find other shareholders across the country (i.e. widows and orphans) who they could buy shares from. Instead of getting paid in dollars, Saunders got the last thing he wanted—more Piggly Wiggly shares.
By the end of day Friday, most of the shorts had covered their positions and Saunders was left holding the bag while still $10 million in debt. He had lost. Wall Street had won.
One of the more memorable squeezes before GameStop was the Volkswagen Infinity Squeeze in 2008. Volkswagen was increasingly being viewed as a potential bankruptcy candidate. However, an orchestrated short squeeze on VW shares caused VW to briefly become the most valuable company in the world, worth more by market cap than Exxon Mobil.
On October 26th, 2008, rival automaker Porsche made a surprise announcement that it had increased its stake in VW to over 74%. It was a stealth move, made possible through the use of multiple purchases of cash-settled derivatives which had been accumulated separately through different European investment banks.
The short interest9 seemed not excessive, at just 12.8% of outstanding shares. But what the market failed to appreciate was that the true availability of tradeable shares to cover those short positions was actually far lower than what many understood.
Around 55% of VW shares were already unavailable in the market for any realistic purposes (mostly owned by index funds and sovereign wealth funds.) As a result, when Porsche increased its stake by an additional 44%, it meant that the true available float went down from 45% of outstanding shares to around just 1% of outstanding shares. Suddenly the seemingly “low” short interest of 12.8% turned in to a massive supply and demand imbalance. Millions of shares needed to be bought immediately even though there were simply no shares available to be sold.
Following the announcement by Porsche, the resulting panic caused a short squeeze in VW shares that saw the deeply troubled automaker briefly become the most valuable company in the world – despite being in the middle of the worst financial crisis since the great depression. VW’s share price briefly exceeded €1,000 intraday with a market cap of over €300 billion.
As a result of its skillful financial engineering, Porsche netted itself more than $10 billion in profits in a matter of just a few short weeks.
On the other side of the trade, the hedge funds who had sold VW short quickly saw their collective losses exceed $30 billion.
The odds are forever against you
Short-sellers have to navigate a lot of asymmetries to emerge successful in the long term.
Most of the world in long-only and that tilts politics against the short-sellers.
The P&L profile is that of unlimited downside vs. limited upside.
Crowded trades end in squeezes.
No company ever hands out bad news if they are not forced to.
The rules of the game can always be changed.
Does this mean that you should go squeeze hunting? Not necessarily:
Short-interest data can be misleading if most of the longs are #neversell or in funds that cannot lend out those stocks to short-sellers.
Most of the time, the shorts are legitimate and squeezing them requires a shift in the zeitgeist.
The reaction of the management when this battle is being fought is a wildcard that cannot be modelled.
In the end, is the juice worth the squeeze?
Outstanding number of shares of a company multiplied by its current market price.
The value of the company calculated by excluding shares held by the promoters.
Impact cost is the cost that a buyer or seller of stocks incurs while executing a transaction due to the prevailing liquidity condition. It varies by transaction size and depends on outstanding orders.

Short interest is the number of shares that have been sold short but have not yet been covered or closed out.