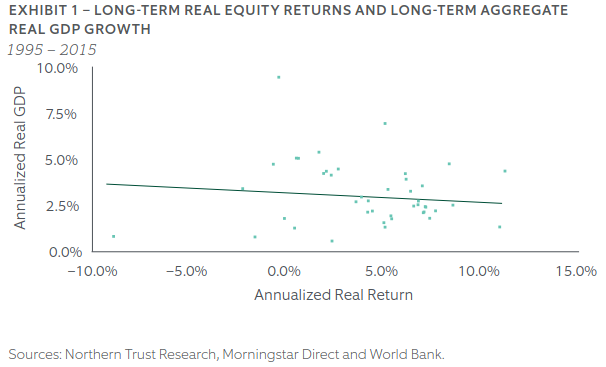
GDP is a trailing measure. However, does the relationship change if we use leading economic indicators?
To answer this question, we look to the OECD Composite Leading Indicator database. It is a monthly time series of CLIs of different regions. Here’s India’s and the G7’s charted from 1980:
If we scatter India’s CLI with next month’s NIFTY 50 returns, we get:
No correlation whatsoever.
However, we know that the market likes growth. So, what happens if we scatter the diff of the CLI over returns?
Noisy, but not hopeless!
Turns out, if you go long NIFTY 50 only when the CLI is improving, you get a 2% boost over the long run return.
The kicker here is that the drawdowns are a lot less severe.
The Roll’s serial covariance spread estimator is an econometric model designed to estimate the average bid/ask spread (or effective spread) of a security using only transaction prices, without needing quotation data. It is one of the best-known estimators based on price change serial covariances.
The idea is from the 90’s and we’ve come a long way since then. Now, we have streaming quotes from which the spread can be directly computed. What makes this approach interesting is the decomposition of volatility that was used to estimate the spread can be used to estimate fundamental volatility instead.
Total Volatility = Fundamental Volatility + Transitory Volatility
Fundamental volatility consists of seemingly random price changes that do not revert. These changes often have the properties of a random walk.
Transitory volatility consists of price changes that ultimately revert. This price reversal creates negative serial correlation in the series of price changes.
Using Roll’s model, Fundamental Volatility = Total Volatility – (Effective Spread)2/4
Came across an intriguing post by Markku Kurtti: Employing volatility of volatility in long-term volatility forecasts (outcastbeta). The gist of it is that the volatility of volatility and average volatility is more predictable. So, predict them separately and then put them together to get a volatility forecast.
Our previous attempts at forecasting VIX have led us the conclude that nothing beats locf. Just extending the last value of VIX forward has beaten all of the models we’ve looked at.
What if, we applied the process outlined in Mr. Kurtti’s blog for VIX?
Not looking so good if you forecast out for 20-days.
A good forecasting model should be able to estimate large spikes and reversion to mean from them. If not the former, then at least the latter. So, if a model is good at the mean-reverting bit, then you can combine both locf and the model to get better predictions.
For example, if you only consider the 1-day forecast, then obviously locf has the upper hand.
However, as you try to predict farther away, you expect the model to nail the mean-reversion bit.
Previously, we explored using Meta’s Prophet library to predict VIX. It turned out that simply extrapolating the last value of the index worked better (Prophet for VIX). In fact, locf (last one carried forward) works better than GARCH(1, 1) and most other approaches. Can the same be said about Conditional Gaussian Mixture Models?
We used the cgmm python library to forecast 20-day forward VIX and compared its root-mean-squared errors (rmse) to those of locf‘s.
locf is pretty hard to beat.
Especially so when the VIX index itself is volatile.
When you buy a stock, you buy a piece of business, not a quote from a broker. – Naved Abdali
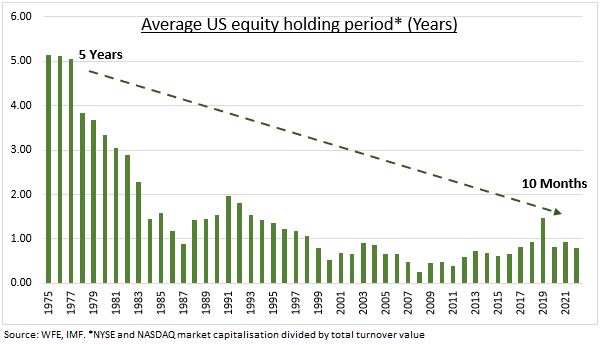
There was a time when people actually believed that buying a stock meant that you were buying a piece of the underlying business. However, we have strayed far, far away from that. The average holding period of equities keeps dropping and everything has become trading sardines.
If we are all traders anyway, why not trade with leverage? Or so goes the clarion call of brokers offering the Margin Trading Facility.
Here’s how it works:
Initial Margin: You pay a portion of the total trade value from your own funds. Broker Funding: Your broker provides the remaining amount to complete the purchase. Collateral: The stocks you buy are pledged as collateral to the broker. Interest: The broker charges daily interest on the borrowed funds.
Margin Trading Facility (MTF) has become a more significant revenue stream than traditional brokerage fees. And the market has been expanding.
Judicious application of leverage, especially on low-volatility portfolios, does make sense. However, the ground reality is different. As a percentage of free-float capitalization, its mid/small-cap momentum stocks that are being financed on margin.
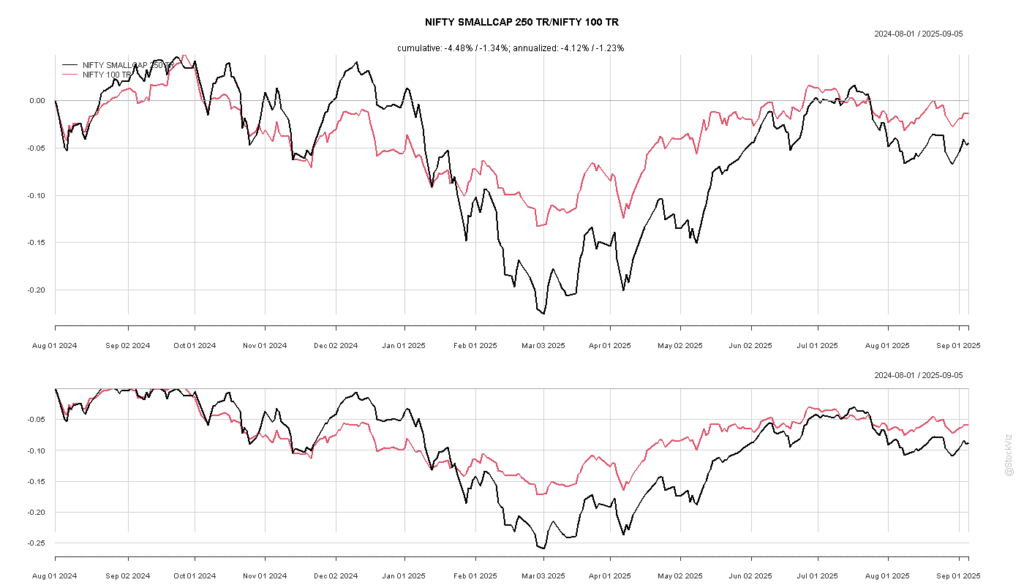
For example, back in August 2024, almost 75% of Motilal Oswal Nifty Smallcap 250 ETF’s free-float capitalization was financed by MTF. If a situation were to have arisen where most of the traders who had bought this on leverage couldn’t meet a margin call, the broker’s risk management team would’ve just dumped this in the market. Given the already abysmal liquidity situation of that ETF, it would have been enough to trigger a cascade of stop-losses, further dislocating the market.
As it turned out, the index would proceed to go down 25% by March 2025.
Currently, more than 15% of Nazara – a company who’s entire business model has been legislated out of existence – is financed under MTF. I hope traders know that MTF is a full recourse loan?
As much as leverage exposes you to risk, there’s another side to this equation. Keeping track of the most leveraged stocks can help you identify margin liquidations and profit from it. However, the pain of liquidations will be felt by many but the profit will go to the few.