Category: Your Money

Screening For Financial Statement Manipulation

Messod Beneish, a professor at Indiana University’s Kelley School of Business, outlined a quantitative approach to detecting financial statement manipulation in his 1999 paper The Detection of Earnings Manipulation. (pdf) He based his model on forensic accounting principles, calling it the “probability of manipulation,” or PROBM model.

The model correctly identified, ahead of time, 12 of the 17 highest-profile fraud cases in the period 1998 to 2002. The PROBM model also consistently predicted stock returns over 1993 to 2007. Students from Cornell University, using the PROBM, correctly identified Enron as an earnings manipulator, while experienced financial analysts failed to do so.

Looking through balance sheets from 2010-2013, the companies with the least probability of manipulation are:
LGBFORGE [stockquote]LGBFORGE[/stockquote]
DISHTV [stockquote]DISHTV[/stockquote]
EROSMEDIA [stockquote]EROSMEDIA[/stockquote]
TATACOMM [stockquote]TATACOMM[/stockquote]
HERITGFOOD [stockquote]HERITGFOOD[/stockquote]
SUPERSPIN [stockquote]SUPERSPIN[/stockquote]
ASAL [stockquote]ASAL[/stockquote]
VIMTALABS [stockquote]VIMTALABS[/stockquote]
PIRGLASS [stockquote]PIRGLASS[/stockquote]
RIIL [stockquote]RIIL[/stockquote]

Since the PROBM score is more of a gatekeeper, here’s a slightly longer list of stocks with high PROBM score:

ASHIANA [stockquote]ASHIANA[/stockquote]
IDFC [stockquote]IDFC[/stockquote]
TUBEINVEST [stockquote]TUBEINVEST[/stockquote]
BAJAJFINSV [stockquote]BAJAJFINSV[/stockquote]
PTC [stockquote]PTC[/stockquote]
SHRIRAMCIT [stockquote]SHRIRAMCIT[/stockquote]
MAGMA [stockquote]MAGMA[/stockquote]
GODREJPROP [stockquote]GODREJPROP[/stockquote]
BAJAJCORP [stockquote]BAJAJCORP[/stockquote]
SRTRANSFIN [stockquote]SRTRANSFIN[/stockquote]
SGJHL [stockquote]SGJHL[/stockquote]
THANGAMAYL [stockquote]THANGAMAYL[/stockquote]
MANAPPURAM [stockquote]MANAPPURAM[/stockquote]
SREINFRA [stockquote]SREINFRA[/stockquote]
CHOLAFIN [stockquote]CHOLAFIN[/stockquote]
M&MFIN [stockquote]M&MFIN[/stockquote]
LICHSGFIN [stockquote]LICHSGFIN[/stockquote]
BAJFINANCE [stockquote]BAJFINANCE[/stockquote]
L&TFH [stockquote]L&TFH[/stockquote]
PFS [stockquote]PFS[/stockquote]

Note: we ignored stocks that don’t had 5 years worth of statements.

The PROBM score, along with SNOA and STA, allows us to screen for stocks with strong balance sheets. We’ll put these three together in the next post…

SNOA – Scaled Net Operating Assets

The intuition behind SNOA as a filter is that firms with a high level of net operating assets, scaled to control for their size, indicates a lack of sustainability of recent earnings performance. An accumulation of accounting earnings without a commensurate accumulation of free cash flows raises doubts about future profitability. If investors have limited attention and fail to discount for the unsustainability of earnings growth, then firms with high net operating assets will be overvalued relative to those with low net operating assets. In the long run, such mispricing will on average be corrected. This implies that firms with high net operating assets will on average earn negative long-run abnormal returns, and those with low net operating assets will earn positive long-run abnormal returns. The whole paper is worth a read: Do Investors Overvalue Firms with Bloated Balance Sheets (pdf)

The idea is that you go long stocks with low SNOA and short stocks with high SNOA. Going past 5 years, here’s a list of stocks with a low SNOA:

NMDC [stockquote]NMDC[/stockquote]
ORISSAMINE [stockquote]ORISSAMINE[/stockquote]
MOIL [stockquote]MOIL[/stockquote]
ENGINERSIN [stockquote]ENGINERSIN[/stockquote]
INFY [stockquote]INFY[/stockquote]
INGERRAND [stockquote]INGERRAND[/stockquote]
OFSS [stockquote]OFSS[/stockquote]
OIL [stockquote]OIL[/stockquote]
NAUKRI [stockquote]NAUKRI[/stockquote]
COALINDIA [stockquote]COALINDIA[/stockquote]

And the ones with high SNOA:

HALONIX [stockquote]HALONIX[/stockquote]
ESL [stockquote]ESL[/stockquote]
VGUARD [stockquote]VGUARD[/stockquote]
HITECHPLAS [stockquote]HITECHPLAS[/stockquote]
TIRUMALCHM [stockquote]TIRUMALCHM[/stockquote]
TTML [stockquote]TTML[/stockquote]
BIRLAERIC [stockquote]BIRLAERIC[/stockquote]
BURNPUR [stockquote]BURNPUR[/stockquote]
SURANAVEL [stockquote]SURANAVEL[/stockquote]
DIGJAM [stockquote]DIGJAM[/stockquote]

Note: we ignored stocks that don’t had 5 years worth of statements.

When you combine STA (discussed earlier) and SNOA, you get to a place where you have filtered a vast majority of the universe. But there’s one more gatekeeper to discuss…

The Little Book of Behavioral Investing: The Empathy Gap

“Prepare, plan and pre-commit to a strategy”

However astute an investor believes himself to be, he is weakened by the “empathy gap,” a human being’s inherent inability to predict his own behavior in the heat of the moment. It’s easy to take logical decisions when everything’s going our way but under pressure, the best of us can crack, in terribly embarrassing ways at times.

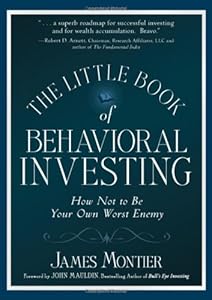
In the first chapter of The Little Book of Behavioral Investing: How not to be your worst enemy, James Montier elucidates on the human traits that condemn us to self-punishing propensities. First, we suffer from the empathy gap. And if that’s not enough, we also bear the brunt of procrastination – that frustrating but inevitable habit of pushing things to the last moment.

Cover of "The Little Book of Behavioral I...

Life, in general, is very forgiving of these foibles. However, the market is a heartless beast. Markets do not care about you, your family or your feelings. If you truly want to become a better investor there’s no way around it; you’ve got to deal with procrastination and empathy gap. Montier suggests a strategy: Prepare and pre-commit. Let’s see what this means.

Pay special attention to planning and preparation techniques while devising your investment strategy. For starters, conduct your research when the market is neither here nor there and the chances of your getting upset or excited are minimal. A cold, rational state of mind is ideal for unemotional observations, drawing logical conclusions and analyzing situations and markets. It’s the perfect time to chalk out an action plan that covers your best and worst “what-if” scenarios.

When you think about it, the worst place to look for research is CNBC and financial media in general. The ad-based business model of media companies motivates them towards the sensational. It’s better for them to focus on Who, What, Where, When, Why, and How rather than the boring and mundane process of actually reading a prospectus or balance-sheet.

Now, why should you prepare and pre-commit? To stop you from taking an original decision in the throes of a volatile market scenario. The trading floor is not the place to follow your instinct. Instead, follow the pre-decided action plan and blindly follow instructions. That’s how you prevent transient emotion or group behavior from influencing your buy or sell decisions.

Now, like a lot of things we read, this may sound easy. But it’s anything but, believe me.

A bad investment choice is like falling for a guy everyone warns you about because your heart thinks your brain is a pessimist. When you’re blindly in love, you can’t imagine it otherwise. And when you’re deep in the dumps, it’s hard to imagine being happy again. Pre-committing to an investment plan may trigger similar reactions. Your C and X systems may lock in constant battle while nightmares of horrific “what-if” situations may mess with your blood pressure. But stick to it. Training your C system will take time and perseverance.

If you need motivation, history is replete with examples of bad investment choices. The dot-com bubble brought umpteen businesses and investors to the point of bankruptcy and pushed many into oblivion. Greed, shortsightedness, and hurried decisions cost investors heavily.

And then there are people like Sir John Templeton, legendary investor and mutual fund pioneer. He made his buy decisions well in advance of sell off periods, giving standing instructions for his brokers to execute under pre-imagined situations. He kept himself out of the buying/selling process.

If a man as seasoned as Sir John didn’t trust himself to take the right decision under stress, I’m sure we can’t afford the confidence. So set your emotions aside and pre-commit to a thoroughly planned investment strategy.

One way StockViz helps you pre-commit to a strategy is through Investment Themes. Each Theme follows a specific model for portfolio construction and can be mapped to your portfolio so that changes in the Theme get reflected on your account. Call us to find out how it works: +91 80 2665 0232 or email us at info@stockviz.biz

Monica Samuel is doing a chapter-wise review of the book: The Little Book of Behavioral Investing: How not to be your worst enemy by James Montier. You can follow the series by following this tag: tlbbinvesting or by subscribing to this rss feed: tlbbifeed

Monthly Recap: An Exchange Goes Down

monthly nifty heat map

The Nifty went down -4.71% (INR) / -12.52% (USD) in August. IT and Metals were the few bright spots.

Index Performance

The worst performer of the month award goes to Indian banks thanks to the deadly triumvirate of the falling rupee, rising rates and an asinine government.

index performance

Top Winners and Losers

TATASTEEL +27.03%
RANBAXY +42.36%
SESAGOA +47.63%
FEDERALBNK -26.74%
IDFC -26.48%
CANBK -25.96%
How long will the metals rise? It seems completely counter-intuitive given the worsening credit and growth outlook.

ETFs

GOLDBEES +8.89%
INFRABEES +5.26%
NIFTYBEES -5.24%
JUNIORBEES -7.26%
PSUBNKBEES -10.58%
BANKBEES -13.93%
Gold was the only place to hide from the sinking rupee. But then, the government doesn’t want you to buy gold. Good luck with that…

Advancers and Decliners

advance decline

Yield Curve

Long-term rates continue to rise but the curve remains inverted.
yield curve

MIBOR

Overnight MIBOR (inter-bank) rates seem to have stabilized at higher levels after gyrating wildly in July.

MIBOR overnight

MIBOR 3 months

Sector Performance

sector performance

The National Spot Exchange: Rs. 8000 crore scam?

NSEL’s role was to bring farmers and buyers together by eliminating middlemen but it forged/manipulated documents regarding stocks and liquidity and allowed some of the companies to pledge the same stock with more than one financial institutions.

Source: Live Mint Coverage
[stockquote]NEULANDLAB[/stockquote]

Scaled Total Accruals

Usually, analysts fixate on the “net income” part of the income statement. However, operating cash flow is the lifeblood of a company and is a better metric of a company’s financial health for two main reasons. First, cash flow is harder to manipulate and second, a company that does not generate cash over the long term is on its deathbed.

One of the measures of balance sheet bloat is scaled total accruals (STA). STA = (net income minus cashflow from operations) divided by total assets. By ranking STA smallest first, and filtering only for situations where both net income and cashflow are positive, you end up with a list of profitable companies ordered by balance-sheet efficiency.

We aggregated income statements from the past 5 years and ranked companies based on STA. The 10 best:

BHARTIARTL [stockquote]BHARTIARTL[/stockquote]
EROSMEDIA [stockquote]EROSMEDIA[/stockquote]
USHAMART [stockquote]USHAMART[/stockquote]
ABAN [stockquote]ABAN[/stockquote]
INFRATEL [stockquote]INFRATEL[/stockquote]
WHEELS [stockquote]WHEELS[/stockquote]
ALKYLAMINE [stockquote]ALKYLAMINE[/stockquote]
SUVEN [stockquote]SUVEN[/stockquote]
SUBROS [stockquote]SUBROS[/stockquote]

and the 10 worst:

VINATIORGA [stockquote]VINATIORGA[/stockquote]
ICRA [stockquote]ICRA[/stockquote]
NAVNETPUBL [stockquote]NAVNETPUBL[/stockquote]
AIAENG [stockquote]AIAENG[/stockquote]
ECLERX [stockquote]ECLERX[/stockquote]
HERCULES [stockquote]HERCULES[/stockquote]
IMPAL [stockquote]IMPAL[/stockquote]
MOIL [stockquote]MOIL[/stockquote]
WABCOINDIA [stockquote]WABCOINDIA[/stockquote]
BLISSGVS [stockquote]BLISSGVS[/stockquote]

Note: we ignored stocks that don’t had 5 years worth of statements.

The problem with a stand-alone STA measure that it doesn’t track changes in balance-sheet health. More on that later…