Author: shyam

The MNC Fund Gravy Train, Part II

We had discussed how MNCs listed in India have outperformed pretty much every benchmark (here, here.) However, there are are a few dark-spots in an otherwise solid long-term investment thesis that are worth discussing.

The benchmark

The NIFTY MNC benchmark index had two drawbacks:

  1. It is based on free-float market cap and the float keeps shrinking because of buy-backs.
  2. It does not include dividends which are a huge component of returns in this asset class.

For example, Unilever bought back more than $5 billion of HUL’s float [stockquote]HINDUNILVR[/stockquote] in 2013; OFSS [stockquote]OFSS[/stockquote] payed out Rs. 485 per share as dividend on September 2014. The stock was trading around Rs. 3960 at that time – a yield of ~12.25% that is not captured by the index.

If you compare just the NIFTY MNC index to other NIFTY indices, it doesn’t look so good:

MNC.returns

Annual returns:
mnc returns

As you can see, all though the MIDCAP index is volatile, it offers returns an order of magnitude greater than the MNC index.

However, this is the index that we are talking about.

MNC Funds vs. Midcap Funds

For a true apples-to-apples comparison between MNCs and Midcaps, we should look at the funds that reference them. This takes care of the dividend reinvestment and vanishing float problems of MNCs. But creates another problem of having to adjust for alpha, but we will ignore that for now.

Let’s compare the BSL MNC fund vs. BSL Midcap Fund:

MNC.vs.MIDCAP.fund.returns

On a cumulative basis, the MNC fund as beaten their Midcap fund… with shallower drawdowns to boot:

MNC.vs.MIDCAP.fund.drawdown.p2p

Given the past performance of the MNC asset class, we had recommended BSL’s and UTI’s MNC funds to investors. However, we had not considered a googly being bowled by the parent companies.

Key Risk

The biggest risk with MNCs is not quantitative but qualitative. Their parent companies do not want the hassle of going through listed India subsidiaries. It is easier to invest in new projects and expatriate profits if they did so through a wholly owned subsidiary rather than a listed one. Key examples:

  1. Suzuki directly set up a factory in Gujarat and Maruti will “buy” cars from the new plant (IiAS.) [stockquote]MARUTI[/stockquote]
  2. Cummins “rationalized” their manufacturing facilities (IiAS.) [stockquote]CUMMINSIND[/stockquote]
  3. In FY15, 32 MNCs paid out an aggregate Rs. 63 bn, which was almost 21% of their pre-royalty pre-tax profits (IiAS.)

It looks like minority shareholders are getting shafted by the parent. The listed companies are being ‘hollowed out’ and turned into mere marketing outfits that command a significantly lower valuation in the markets.

If you are an investor in MNCs as a distinct asset class, it is time to work these risks into your future return expectations.

The R source code for this analysis and charts can be found on GitHub.

Pain is proportional to Frequency of Observations

Midcaps, proxied by the NIFTY MID100 FREE index, have given an annualized return of over 18% from 2001 through August-2016. That is a 12x return over 15 years. Sounds good when you say it that way, doesn’t it? Take a look at how Rs. 1 has grown over the years:

cumulative.returns.NIFTY MID100 FREE

Now, zoom into the bottom-most chart – the drawdown chart:

drawdown.p2p.NIFTY MID100 FREE

The point-to-point drawdown chart is horrific enough. Investors saw a 70% loss during the Global Financial Crisis (GFC) in 2008/09. 30% drawdowns occur with regular frequency. Investors make it worse by looking at their investments too often.

For example, if an investor saw the returns of his portfolio once every 1000 days (4-5 years,) he would not have seen more than 35 drawdowns during the period. Move the observation to every 200 days (about a year,) and the number ticks up to 138. The more you check your portfolio, more the number of losses that you see:

drawdowns.NIFTY MID100 FREE

New investors have rightfully taken the SIP route to saving in equities. However, they would be doing themselves a disservice if they expect a fixed-deposit like consistency in equity returns.

For the quant inclined, code for this analysis can be found on Github.

Related: Definition: Drawdown

Monthly Recap: The August Rust

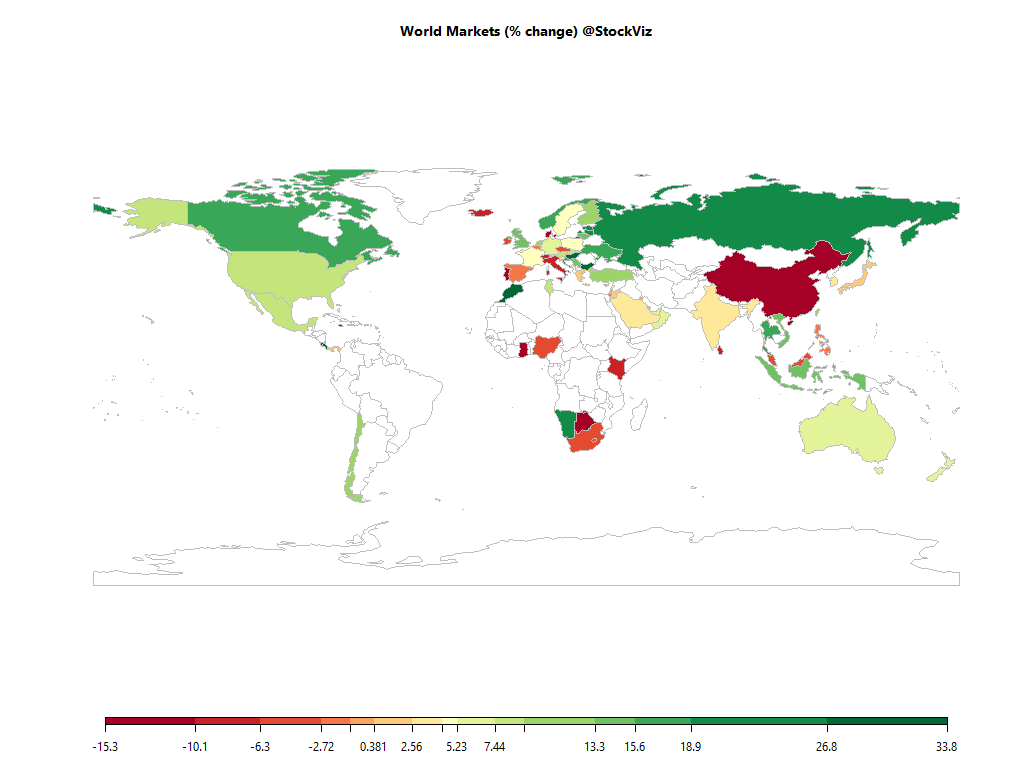
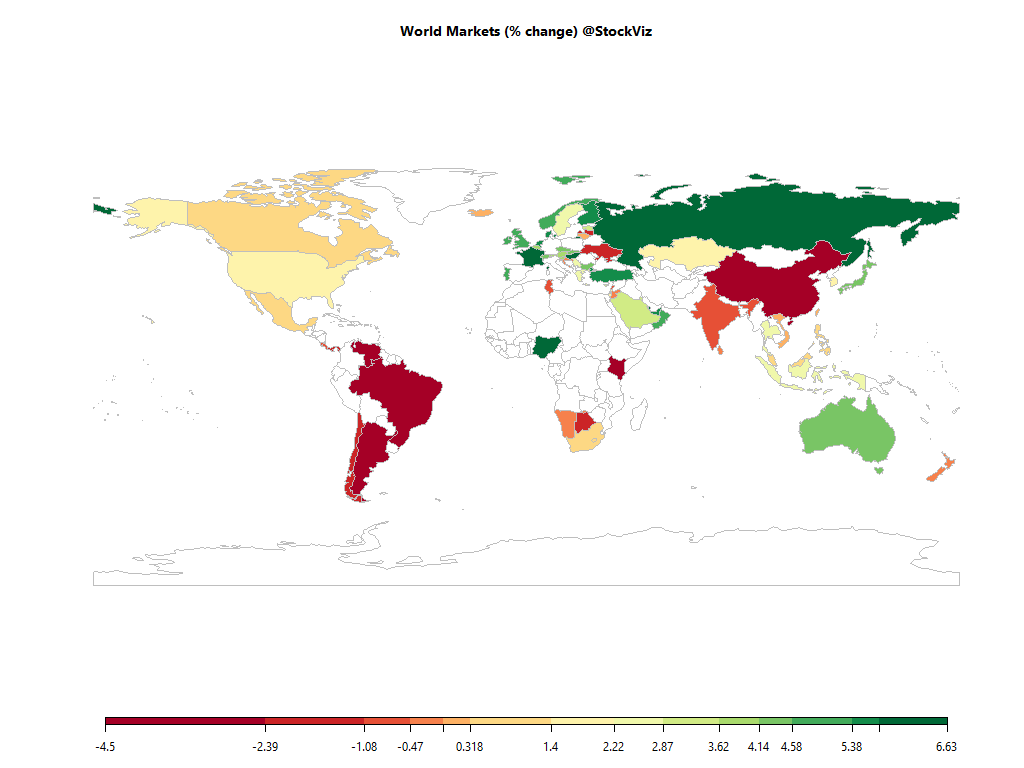
world.2016-07-29.2016-08-31

Equities

Major
DAX(DEU) +2.88%
CAC(FRA) +0.91%
UKX(GBR) +0.78%
NKY(JPN) +2.16%
SPX(USA) -0.17%
MINTs
JCI(IDN) +2.27%
INMEX(MEX) +2.75%
NGSEINDX(NGA) -1.30%
XU030(TUR) +1.00%
BRICS
IBOV(BRA) +0.94%
SHCOMP(CHN) +2.82%
NIFTY(IND) +1.58%
INDEXCF(RUS) +1.42%
TOP40(ZAF) +0.85%

Commodities

Energy
Natural Gas -0.69%
RBOB Gasoline -0.19%
Heating Oil +11.14%
Brent Crude Oil +10.07%
Ethanol -0.84%
WTI Crude Oil +7.29%
Metals
Copper -6.31%
Palladium -5.11%
Platinum -8.49%
Silver 5000oz -7.46%
Gold 100oz -3.40%

Currencies

USDEUR:+0.17% USDJPY:+1.57%

MINTs
USDIDR(IDN) +1.20%
USDMXN(MEX) +0.18%
USDNGN(NGA) -1.33%
USDTRY(TUR) -1.05%
BRICS
USDBRL(BRA) -0.46%
USDCNY(CHN) +0.68%
USDINR(IND) -0.01%
USDRUB(RUS) -1.05%
USDZAR(ZAF) +5.87%
Agricultural
Cocoa +2.62%
Coffee (Robusta) +0.66%
Lean Hogs -9.28%
Lumber -1.94%
Soybean Meal -9.74%
Soybeans -6.59%
Sugar #11 +6.33%
Wheat -10.45%
Coffee (Arabica) +0.38%
Cattle -5.85%
Corn -8.47%
Cotton -11.20%
Feeder Cattle +0.24%
Orange Juice +3.55%
White Sugar +1.48%

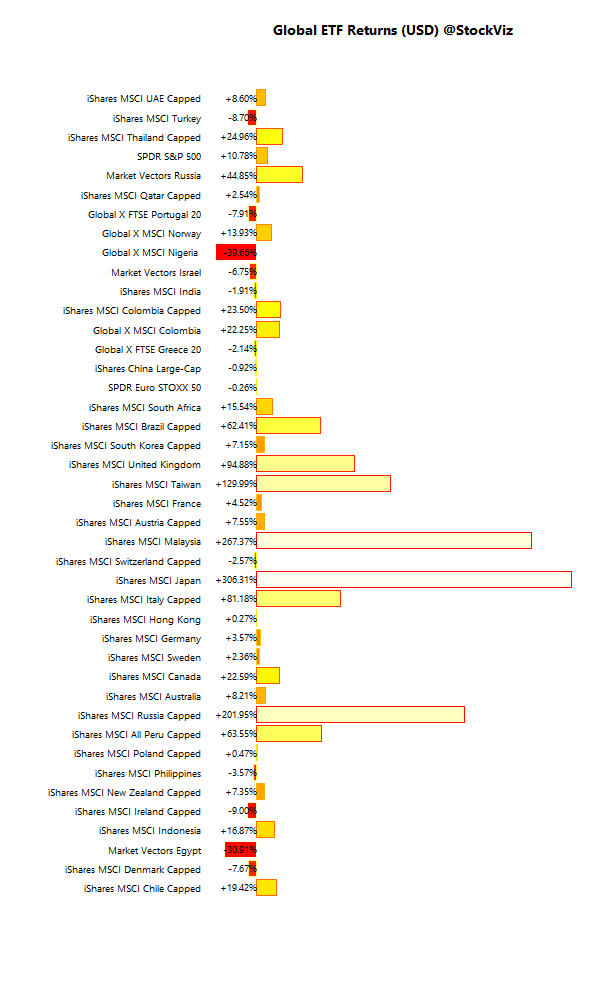
International ETFs (USD)

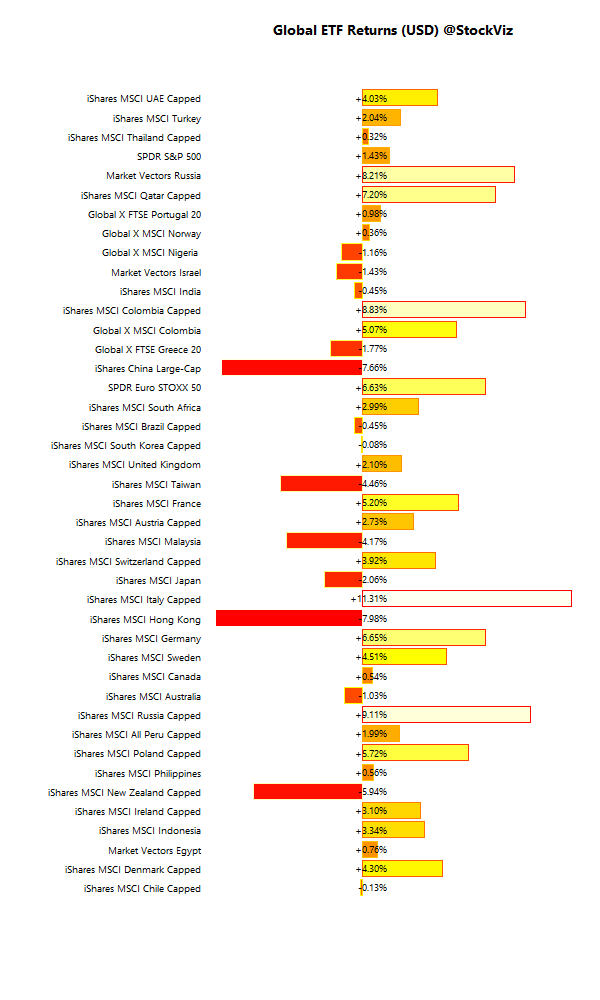
global.etf.performance.2016-07-29.2016-08-31

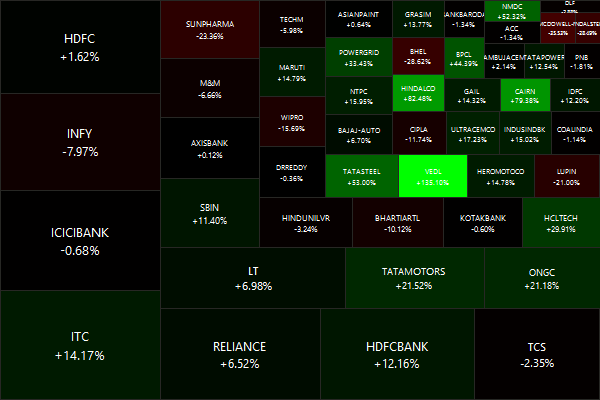
Nifty Heatmap

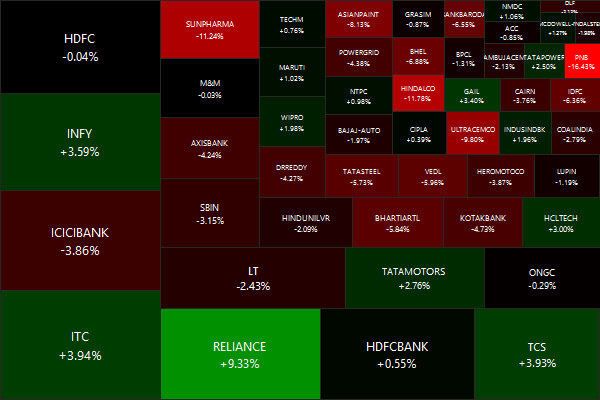
NIFTY 50.2016-07-29.2016-08-31

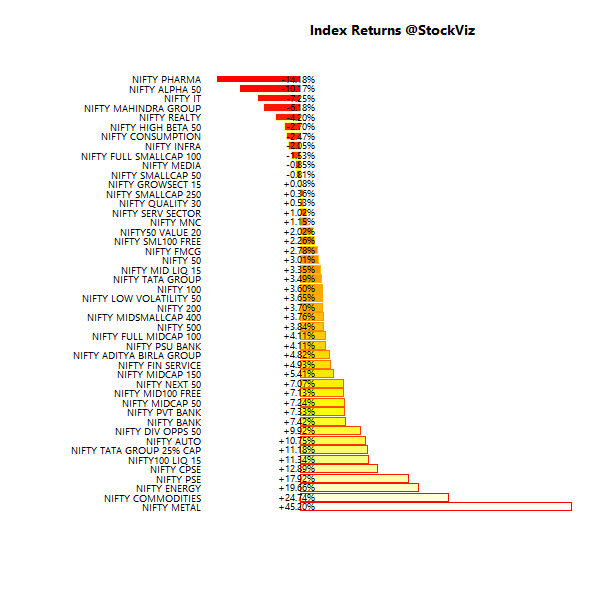
Index Returns

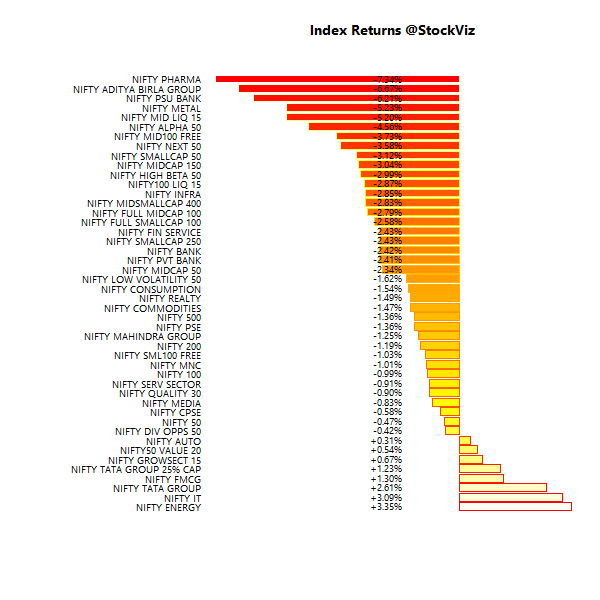
index.performance.2016-07-29.2016-08-31
More: Sector Dashboard

Market Cap Decile Performance

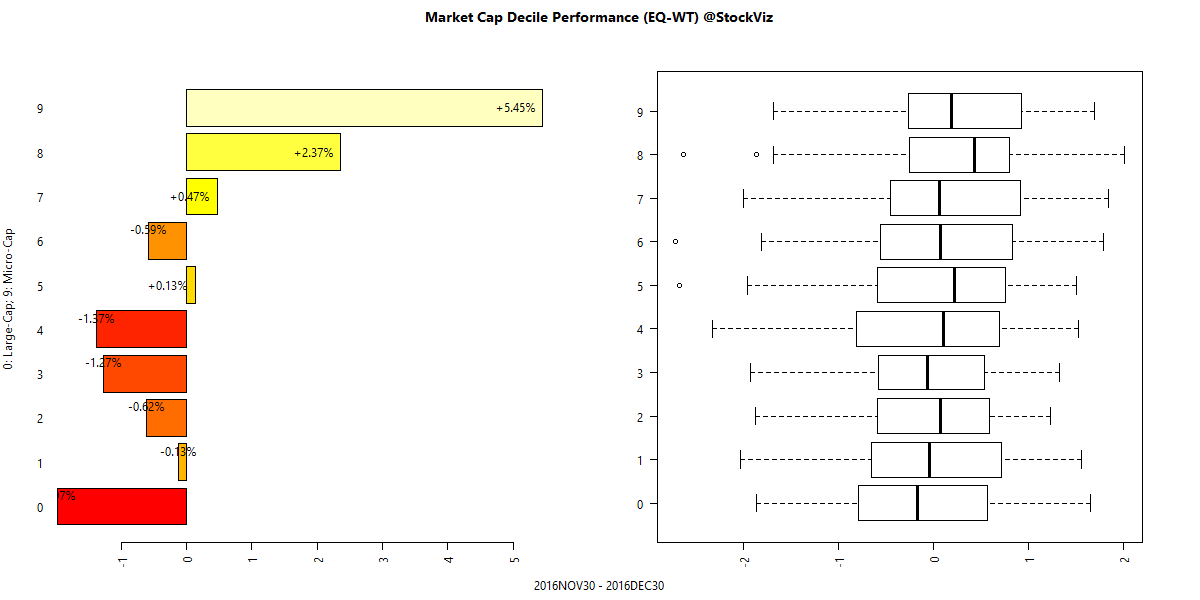
deciles.perf.2016-08-31
More: Equal-Weight Deciles, Cap-Weight Deciles

ETF Performance

PSUBNKBEES +8.23%
CPSEETF +4.57%
BANKBEES +4.07%
JUNIORBEES +2.43%
NIFTYBEES +1.71%
GOLDBEES +0.56%
INFRABEES +0.27%
PSU banks – because it is a new beginning!

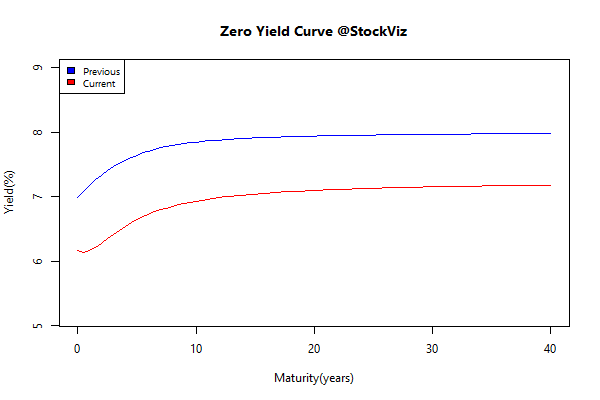
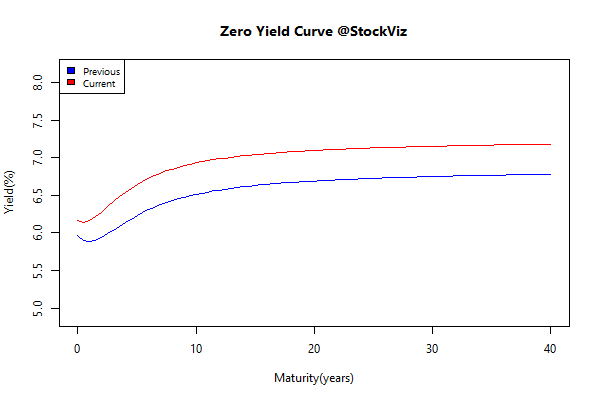
Yield Curve

yieldCurve.2016-07-29.2016-08-31

Bond Indices

Sub Index Change in YTM Total Return(%)
0 5 -0.03 +0.67%
5 10 -0.10 +1.23%
10 15 -0.18 +1.99%
15 20 -0.16 +2.11%
20 30 -0.16 +2.45%
Long bond FTW!!!

Investment Theme Performance

Magic Formula got its mojo back…

Equity Mutual Funds

Bond Mutual Funds

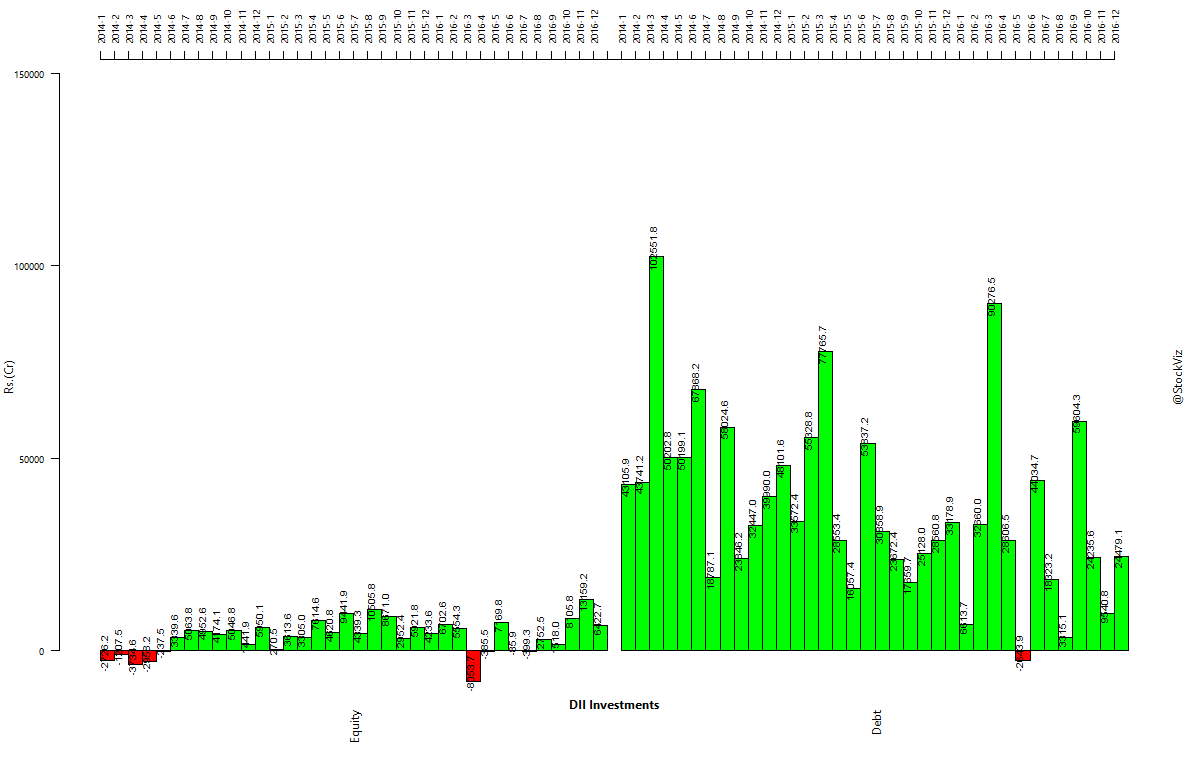
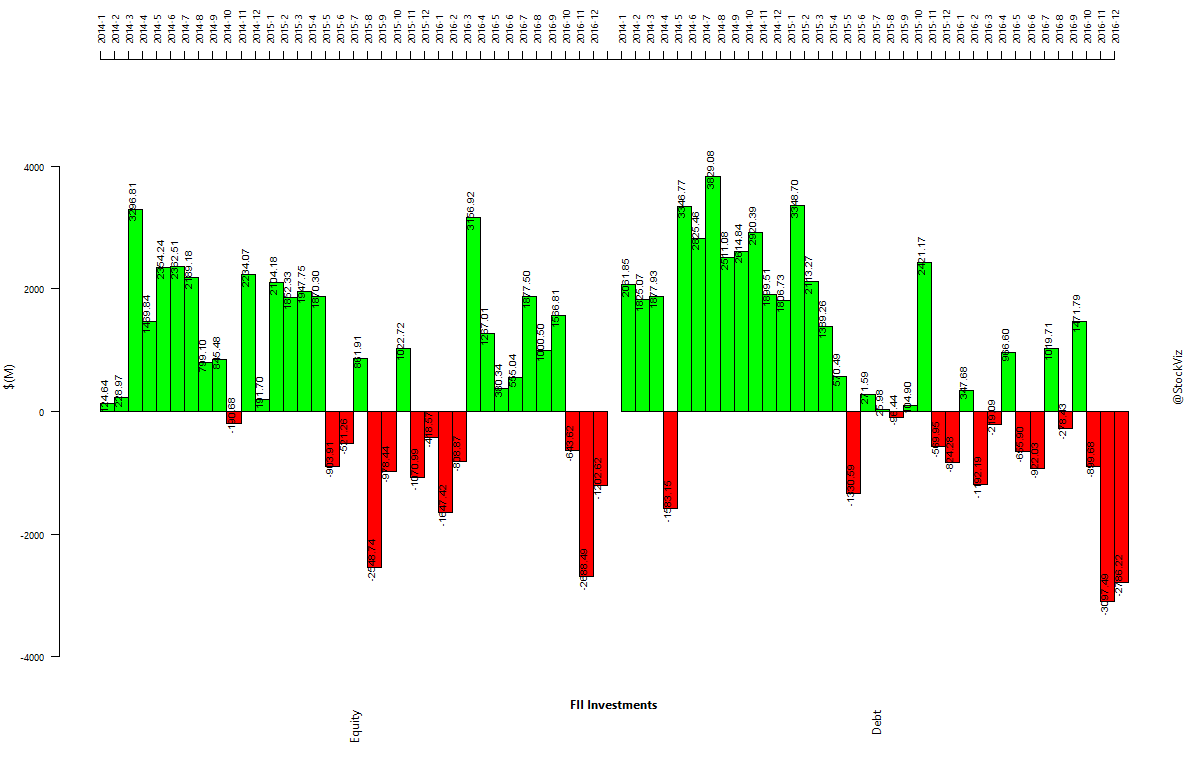
Institutional Investment Trends

FII’s binged on both debt and equity this month…

fii-investments.2014-01-01.2016-07-29

dii-investments.2014-01-01.2016-07-29

Book of the Month

The Everything Store: Jeff Bezos and the Age of Amazon (Amazon)

The book is about the rise of Amazon and how it is more or less an extension of Jeff Bezos’ brain. After reading this, I realized how difficult it is going to be for our domestic e-commerce players to win against the Bezos juggernaut. It is a well written book and is a must-read for anyone who is interested in business strategy.

Update 1: Mid N Small vs. Value Discovery

Back in January last year, we had taken a brief look at Invesco’s India Mid N Small Cap Fund and ICICI Prudential Value Discovery Fund and concluded that even through Religare is marginally better than ICICI, there was nothing there to swing the decision one way or the other. Here’s an update:

Between 2015-01-01 and 2016-08-11, Invesco India MID N SMALL CAP Fund has returned a cumulative 12.59% with an IRR of 7.64% vs. ICICI Prudential Value Discovery Fund’s cumulative return of 12.99% and an IRR of 7.88%. (http://svz.bz/2bf7jzy)

In terms of performance, they are still on top of each other. However, Value Discovery has had shallower draw-downs, making it an easier fund to hold.

Invesco India MID N SMALL CAP Fund and ICICI Prudential Value Discovery Fund drawdown

Invesco’s fund is way smaller than ICICI’s. For those who prefer a smaller fund, Invesco’s would be a way to go. However, overall, the status quo remains.

Monthly Recap: Jumpin’ July

world.2016-06-30.2016-07-29

Equities

Major
DAX(DEU) +6.79%
CAC(FRA) +4.77%
UKX(GBR) +3.38%
NKY(JPN) +6.38%
SPX(USA) +3.77%
MINTs
JCI(IDN) +3.97%
INMEX(MEX) +2.86%
NGSEINDX(NGA) -5.36%
XU030(TUR) -2.19%
BRICS
IBOV(BRA) +11.06%
SHCOMP(CHN) +1.70%
NIFTY(IND) +4.23%
INDEXCF(RUS) +2.83%
TOP40(ZAF) -0.13%

Commodities

Energy
RBOB Gasoline -13.15%
Brent Crude Oil -12.87%
Heating Oil -12.58%
WTI Crude Oil -16.00%
Ethanol -12.08%
Natural Gas -2.46%
Metals
Platinum +12.24%
Palladium +18.96%
Copper +1.83%
Gold 100oz +2.68%
Silver 5000oz +7.49%

Currencies

USDEUR:-0.97% USDJPY:-1.17%

MINTs
USDIDR(IDN) -0.74%
USDMXN(MEX) +2.62%
USDNGN(NGA) +14.05%
USDTRY(TUR) +3.74%
BRICS
USDBRL(BRA) +1.33%
USDCNY(CHN) -0.20%
USDINR(IND) -0.78%
USDRUB(RUS) +3.20%
USDZAR(ZAF) -5.90%
Agricultural
Cocoa -3.70%
Coffee (Arabica) +1.36%
Coffee (Robusta) +9.31%
Soybeans -12.32%
Cattle -5.67%
Lean Hogs -16.43%
Lumber +4.36%
Cotton +17.31%
Feeder Cattle -2.56%
Orange Juice -1.21%
Soybean Meal -13.91%
Corn -7.81%
Sugar #11 -6.04%
Wheat -5.16%
White Sugar -5.14%

International ETFs (USD)

global.etf.performance.2016-06-30.2016-07-29

Nifty Heatmap

NIFTY 50.2016-06-30.2016-07-29

Index Returns

index.performance.2016-06-30.2016-07-29
More: Sector Dashboard

Market Cap Decile Performance

deciles.perf.2016-07-29
More: Equal-Weight Deciles, Cap-Weight Deciles

ETF Performance

JUNIORBEES +9.46%
CPSEETF +7.74%
BANKBEES +5.73%
PSUBNKBEES +4.86%
NIFTYBEES +4.54%
INFRABEES +4.39%
GOLDBEES +0.68%
CPSE ETF found a bid? Is this a dash-for-trash rally?

Yield Curve

yieldCurve.2016-06-30.2016-07-29

Bond Indices

Sub Index Change in YTM Total Return(%)
0 5 -0.24 +1.35%
5 10 -0.35 +2.45%
10 15 -0.33 +3.04%
15 20 -0.34 +3.71%
20 30 -0.34 +4.59%
The biggest story of this year is long-term bonds returning 4.5% in a month!

Investment Theme Performance

Will automated (momo) momentum strategies outperform their hand-crafted cousins? Interesting days ahead…

Equity Mutual Funds

Bond Mutual Funds

Institutional Flows

Bond inflows nowhere close to what occurred in March…

dii-investments.2014-01-01.2016-07-29

fii-investments.2014-01-01.2016-07-29

US Treasuries vs. Indian Gilts

More room for Indian Gilts to rally?
ust-ind-10yr-spread.2014-01-01

Book of the month

Sapiens: A Brief History of Humankind (Amazon)

_20160731_090441