Momentum investing strategies have historically produced high returns in Indian equities. The biggest problem with them has been deep drawdowns when the markets enter bear territory.
A number of risk management strategies like using moving averages, trailing stop-losses, and hedging have been discussed on this blog before. These strategies, either standalone or in combination with each other, have provided investors with significant protection against momentum crashes. These are “exogenous” techniques, i.e. they are not part of the strategy itself but is imposed by portfolio management infrastructure. The advantage of these techniques is that the default is to be always invested in the market. It is risk-management’s job to control exposure.
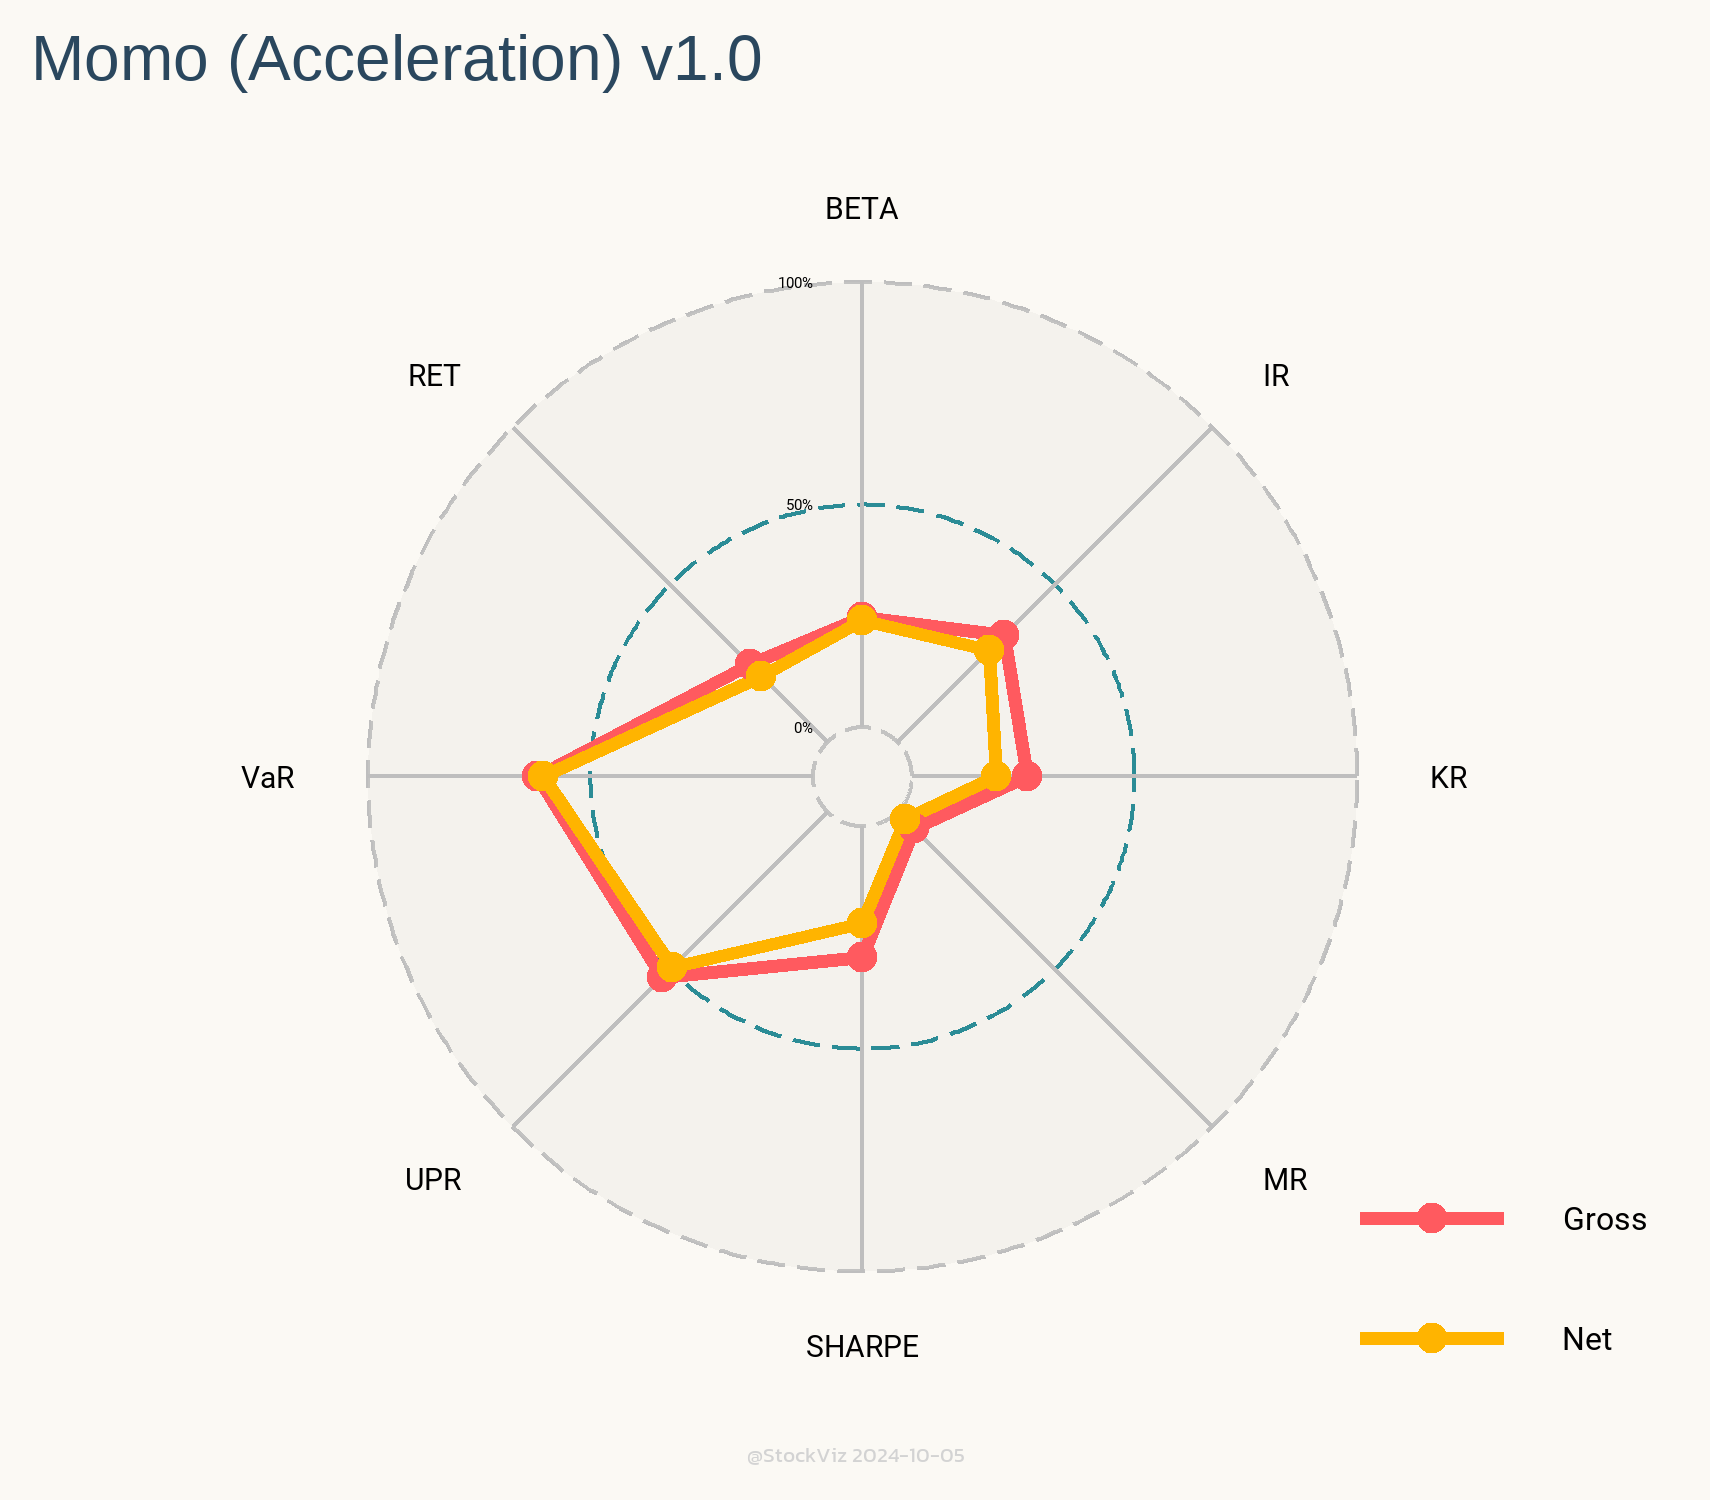
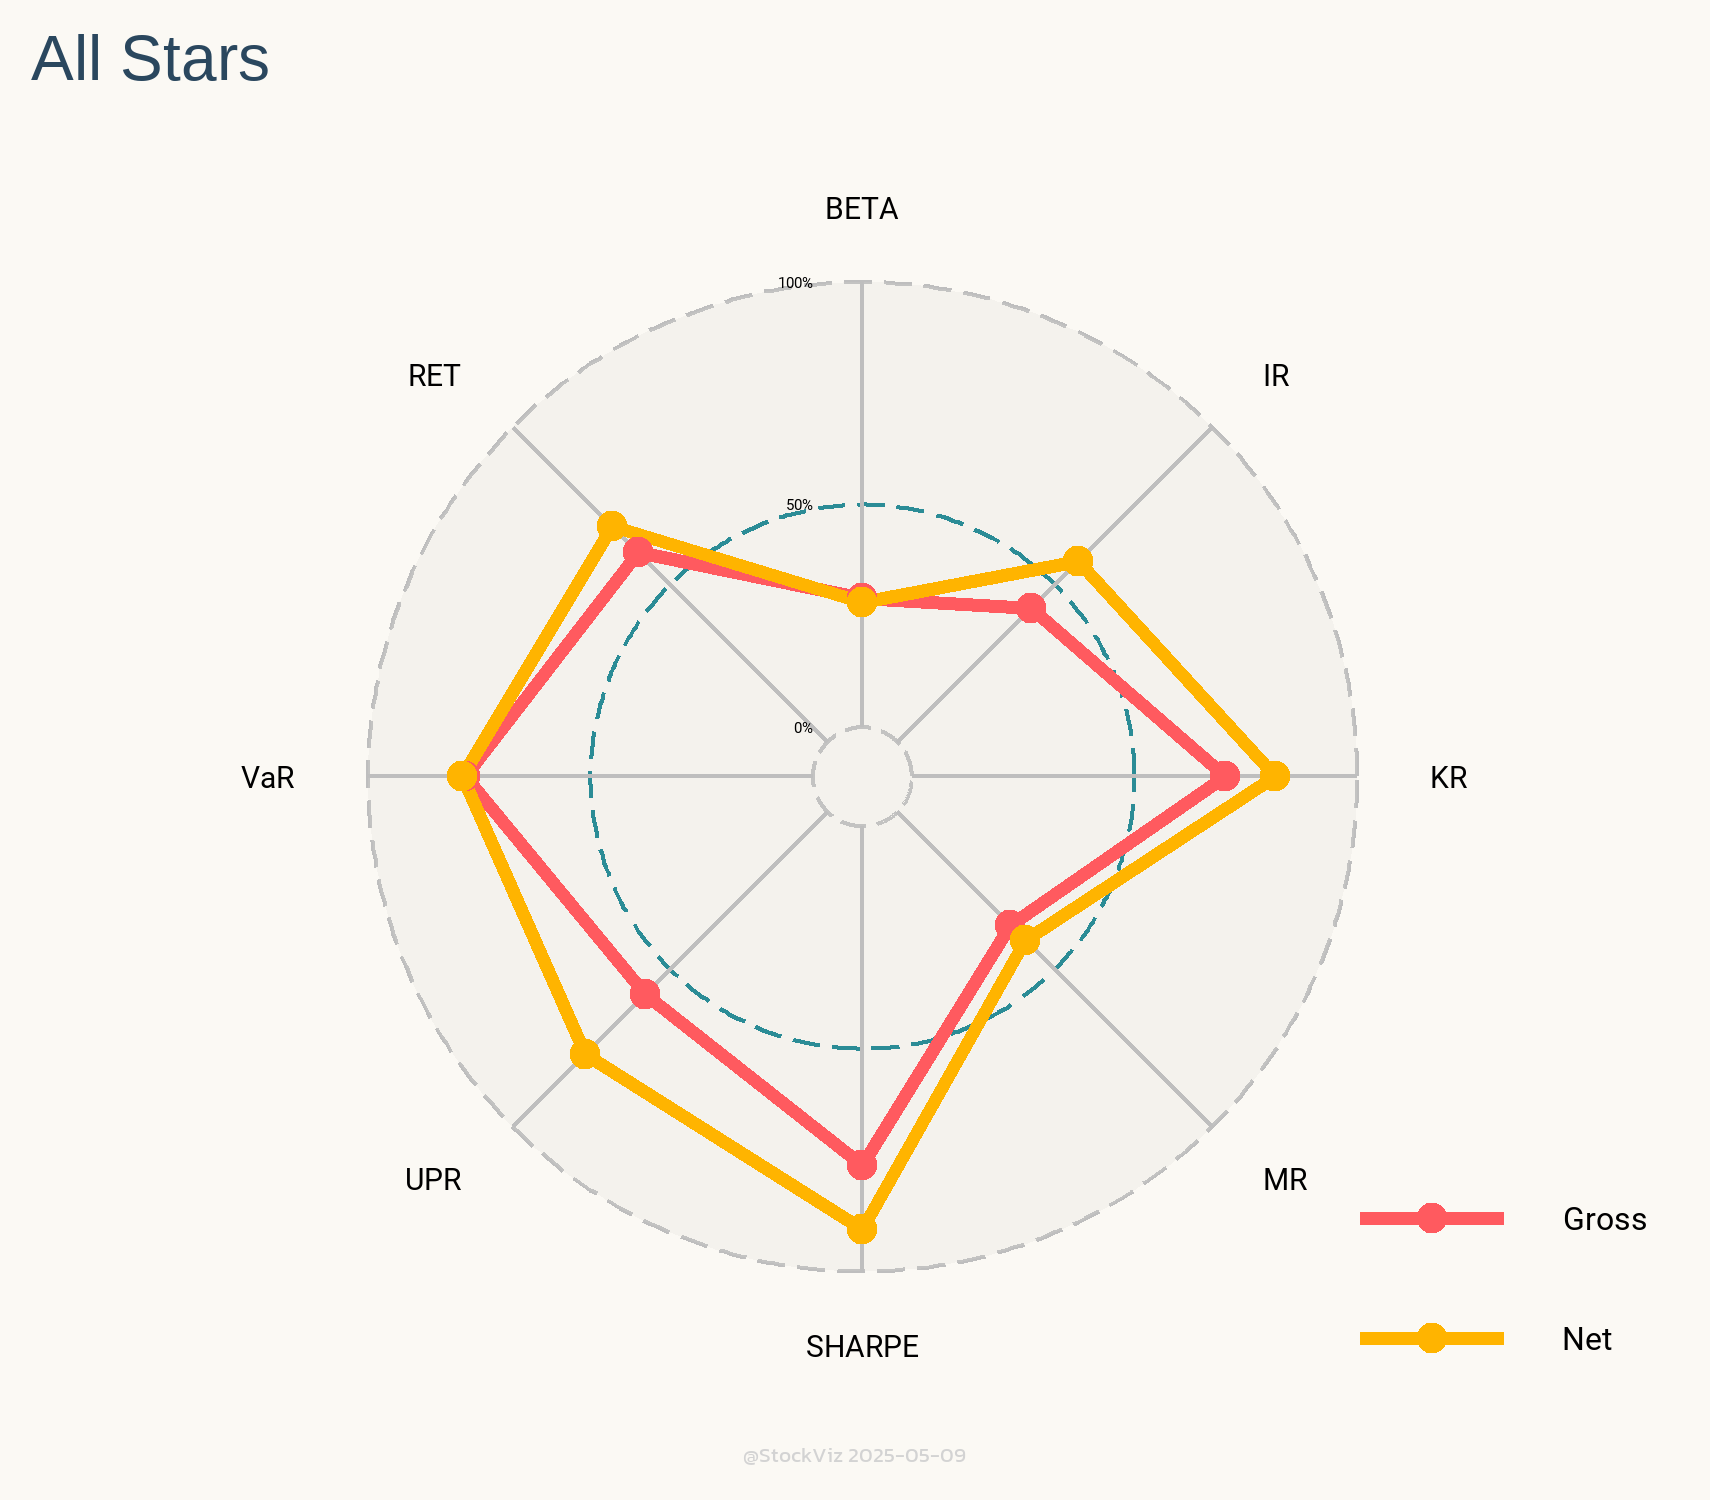
Alternatively, endogenous risk-management techniques are those that are baked into the investment strategy itself. Our All Star strategy is a prime example of a momentum strategy that reduces exposure to equities by design. If enough stocks are not hitting their all-time-highs, it simply sits in cash. When you combine this with one of the exogenous risk-management techniques, you end up with a high Sharpe portfolio.
The advantage of high Sharpe strategies is that you can use leverage to amplify returns. However, if you are a “cash-and-carry” investor then it might be too conservative. Is there a momentum strategy that sits between All Star and traditional momentum?
High-to-Price (HTP) Momentum
A new paper, Büsing, Pascal and Mohrschladt, Hannes and Siedhoff, Susanne, Decomposing Momentum: Eliminating its Crash Component (SSRN,) outlines a new way to slice the 52-week momentum strategy to avoid crash risk. It describes a ranking system based on High-to-Price (HTP) where HTP = ln(Phigh/P0) where Phigh is the stock’s 52-week high price and P0 is its price at the beginning of the period.
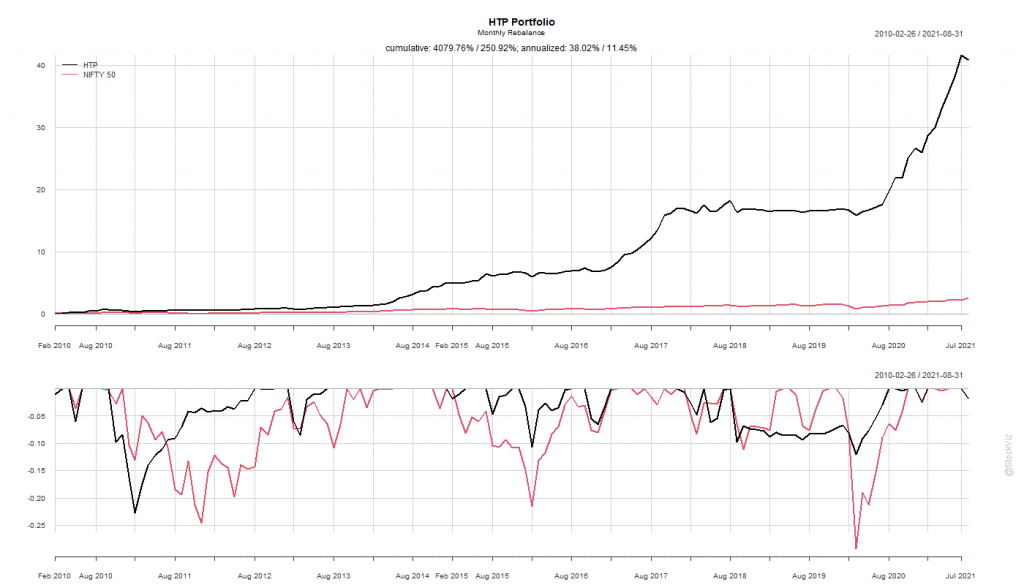
A monthly rebalanced HTP long-only portfolio looks promising. It sidestepped quite a few whipsaws and has a better drawdown profile than NIFTY 50.
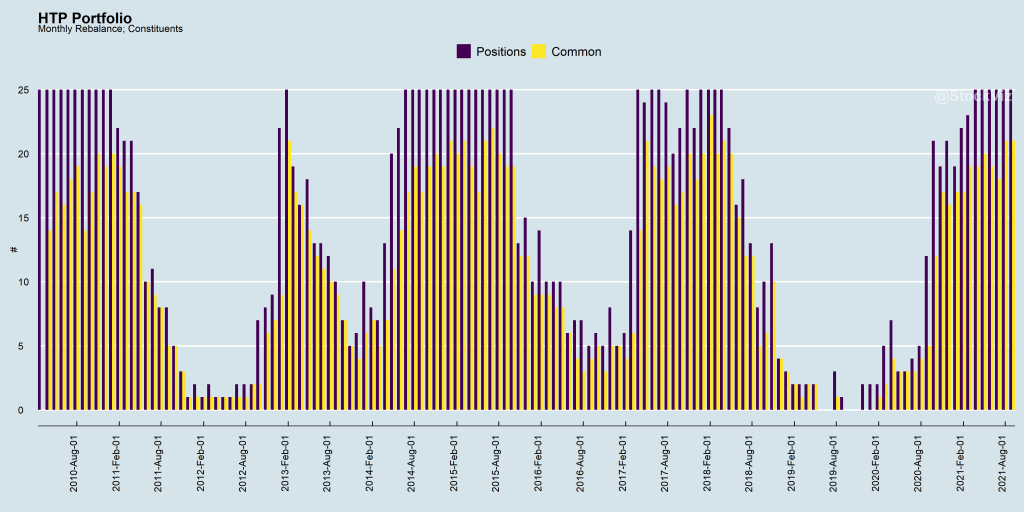
There have been periods where the strategy couldn’t find 25 stocks to go long and it only had a handful of positions or was all cash. However, the degree of overlap between constituents in consequent months is quite high indicating that the portfolio is likely to experience very low churn. In this aspect, it is very similar to the All Stars strategy.
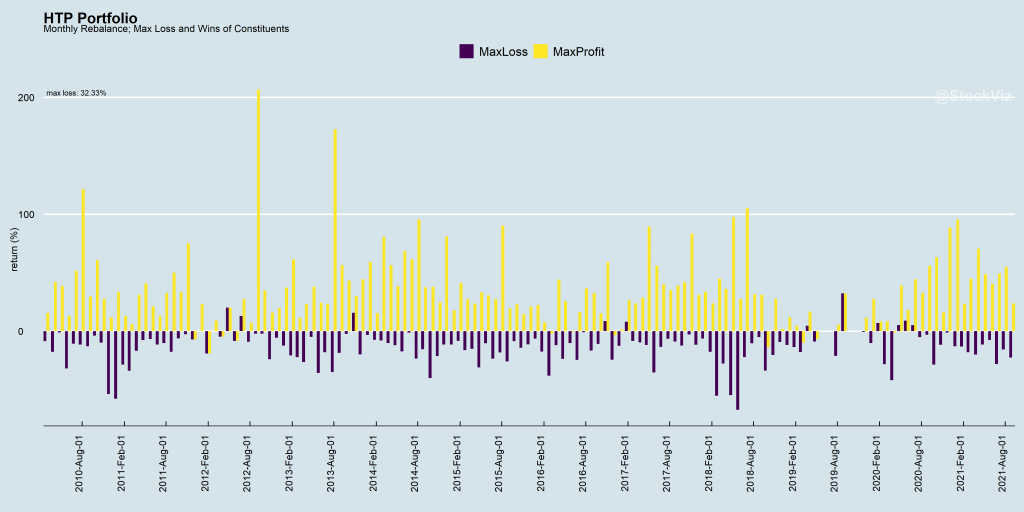
At a line-item level, there have been instances where some stocks have tanked more than 30% in the month. However, the skew is, by-and-large, positive.
Investing in HTP Momentum
The real world doesn’t line-up perfectly to match the end-of-the-month rebalancing activity outlined in our backtest. To make this strategy investible, it needs to have some risk-management strategy in place on a clearly defined universe of stocks and has to be dynamically rebalanced.
We present our High-to-Price (HTP) Momentum Theme that consists of a portfolio of 25 stocks selected from the top 300 stocks by market-cap that rank high on their HTP scores. A 10% trailing stop-loss ensures that errant positions don’t drag down the whole portfolio. It is ideal for investors who can accept a bit more risk than All Stars for potentially higher returns.