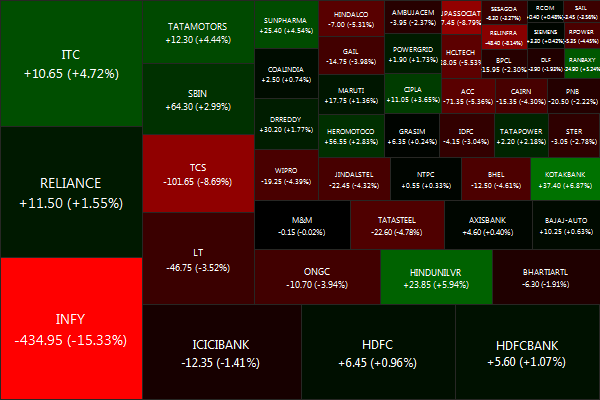
Author: shyam

Economists’ Hypothetical Time versus Real Market Time

CHELTENHAM, ENGLAND - MARCH 16: Davy Russell r...

Image by Getty Images via @daylife

Kim Asger Olsen, an investment manager, has a succinct way of looking at the timeframes in which different people live. People active in the financial markets – traders, investment managers – live in the Real Market Time (RMT). It is rather different from Economist’s Hypothetical Time (EHT) or even Newspaper Headline Time (NHT).

The ability to figure out what matters and what doesn’t is key to living in the RMT. Bloggers, on the other hand, tend to work in EHT (they dwell for too long on what already belongs in the past in RMT). And by the time it hits the Hindu (NHT) it doesn’t matter any more.

In RMT, if the can can be kicked down the road, it will be, and its good enough. People like Nouriel Roubini, David Rosenberg, etc live in the EHT – EHTers look at Greece, Portugal, Italy, China and think it spells the end of the world. The fact of the matter is that you will never have all the data you need to make decisions in real-time. Leave it to EHTers and the Hindu to be the Monday morning quarterback.

Read more here: http://economicsacloserlook.blogspot.in/2012/01/quotes-and-time-zones.html

Airtel–dropped calls come back to bite

English: Logo of Airtel

Image via Wikipedia

The carnage in Airtel stock continues – down close to 10% since their results were announced. Their Revenue Per Minute (the amount they charged you) increased by 3.2% while minutes rose only 0.8% And the worst part is that Idea’s minutes grew 7.3% during the same period, in spite of those annoying Abhishek Bachan ads.

I am not sure which network traders are on, but having suffered through Airtel’s network for the better part of three years: no signal, dropped calls, annoying ring-tones, having to pay to talk to a customer service rep, being told that I had to buy a Rs. 20,000 “booster” to fix the lack of network around my house; it comes as no shock to me that people “used” less minutes. I have lost track of the number of times I’ve carried the rest of a conversation on Skype because Airtel dropped the call.

I guess all of those dropped calls finally translated to a disappointing quarter.

The stock is hovering around Rs. 350 now. It was around Rs. 320 in early Jan so I’m tempted to say that a correction was overdue and I’m actually warming up to a bull case here.

You can read all the news stories about Airtel here.

Fees–the silent killer of investment returns

English: A copyright symbol with a red exclama...

Image via Wikipedia

My colleague Abhishek did an overview of how to look at investment returns (see here, here and here). Let me round out the series with a pet peeve of mine: fees.

Almost all packaged investments (mutual funds, ETFs, etc…) come with a built-in fee structure. Typically, passive ETFs have a lower fee (0.80% for NIFTYBEES, for example) and mutual funds average about 2% annually. So assume that you have a 10 year investment horizon. How do fees impact your total returns?

Lets assume that the market always goes up by 8% annually. So in 10 years, your IRR should be 8%, if you paid no fees. But it falls to 5.84% if you paid even 2% as an Expense Ratio. But the problem is that the market doesn’t go up every year but you will still pay that 2% to the bank.

Before 2008, fund companies estimated that the fees for closed-end funds averaged 6% of an investor’s return, the maximum by law for both types of funds, while the open-ended funds charged 1.75% on average.

The popularity of those high-fee funds back then shows that investors pay little attention to fees when they are amortized over the holding period. When it comes to assent management fees, fore-warned is fore-armed!

The Reliance on Correlation

Our previous discussion of correlation in the NSE looked at a years worth of data for the NIFTY 50 components to see how individual stocks correlated with the index. There are three ways to look at correlation:

  1. Highly correlated stocks can be substituted with each other. For example, if the price of stock A is highly correlated with the price of stock B (r approaching 1), then investors should be indifferent between owning A or B.
  2. Correlation can be used to expose relative value. For example, in the above example, if A pays more dividends than B, then owning A is better than owning B.
  3. Correlation as a trading tool. In the above example, say on a particular day A drops (or rises) more than B, then you can put on a trade betting on mean reversion – that ultimately A & B will start behaving similarly.

For example, lets have a look at RELIANCE over the NIFTY 50 index. I created a series of 10-day correlations (r)

For 2006:

image

For 2007:

image

For 2008:

image

For 2009:

image

For 2010:

image

and lastly for 2011:

image

It looks like RELIANCE is usually highly correlated to the NIFTY 50 and the range is somewhere between 0.7 and 1.0. Lets have a look at the histogram to get a better idea:

image

You need to ignore the deviations around stock splits and dividend ex-dates (for example, on 26-Nov-2009, RELIANCE issued a 1:1 bonus so the displacement that you see surrounding that date should be ignored) to truly appreciate what’s going here.

The charts show that there are significant number of instances when the correlation breaks down but it always moves back into the range. Looks like betting on convergence seems to be a no-brainer.

Have a trade idea? Let me know!

India proves too hot to handle for Norway’s Telenor

Telenor-pirat

Telenor-pirat (Photo credit: Hanne LK)

This is the story of how Norway’s equivalent of India’s BSNL got involved in a $40bn telecom scam. The Indian Supreme Court cancelled 122 2G licenses given on a no-bid basis in 2007. Yes, we are talking about something that happened 5 years ago for technology that’s 10 years old. But the fascinating part is that the spectrum was first sold to a real estate company called Unitech about for $365.42 million which then turn around and sold a 60% stake in its wireless division to Norway’s Telenor for $1360 million! I’m sure some people were feeling pretty smart about turning in a 270% profit for their “navigating” skills.

The minister, A. Raja, who sold the spectrum is a nobody from South India representing a grand total of one million voters. It must be a pretty fascinating journey for him coming in #2 in Time magazine’s 2011 list of “Top 10 Abuses of Power” list (just behind the Watergate scandal).

The underpriced spectrum giveaway unleashed a price war where SMS and voice tariffs in India were hammered down to the lowest in the world. Telenor had planned to invest about $3 bn in India and is said to be almost 2/3rds there. So that’s $2 bn that just got vaporized. Besides, they had out sourcing agreements with a whole bunch of Indian BPOs. Wipro is said to have $550 million worth of deals.

Its funny how Telenor, one of the top performers on the Dow Jones Sustainability Indexes for the 10th year running, got dipped in Indian curry.

Sources:

Telenor History, Nilgiris Lok Sabha Constituency), A Raja, 2G Spectrum Scam, Uninor, IT BPOs Hit