Previously, we had pointed out the wide gulf between ETF closing prices and NAVs. While that continues to exist, the underlying funds themselves don’t track their indices correctly. This tracking difference is the absolute difference between the returns of the fund and the underlying index.
In an ideal world, an index fund or ETF returns should only trail its benchmark by its expense ratio. However, that is not always the case. Some indices are tough to replicate in the actual market due to liquidity issues. Sometimes reference bonds get called away. Proxies don’t exactly replicate the underlying, and so on and so forth.
Thankfully, AMFI (tasked by SEBI) publishes these metrics on their website for all to see.
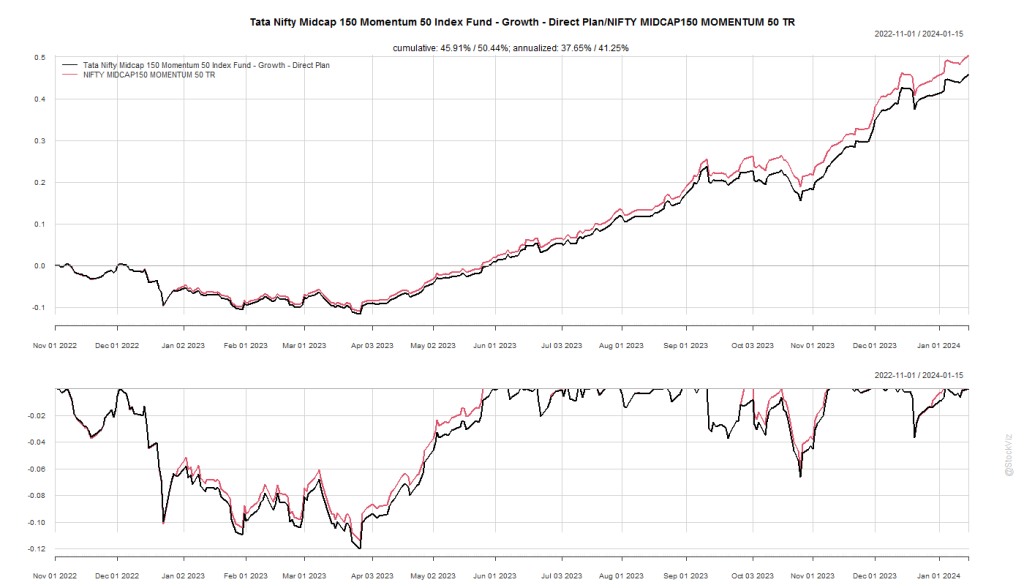
The differences are hard to notice in short-term data…
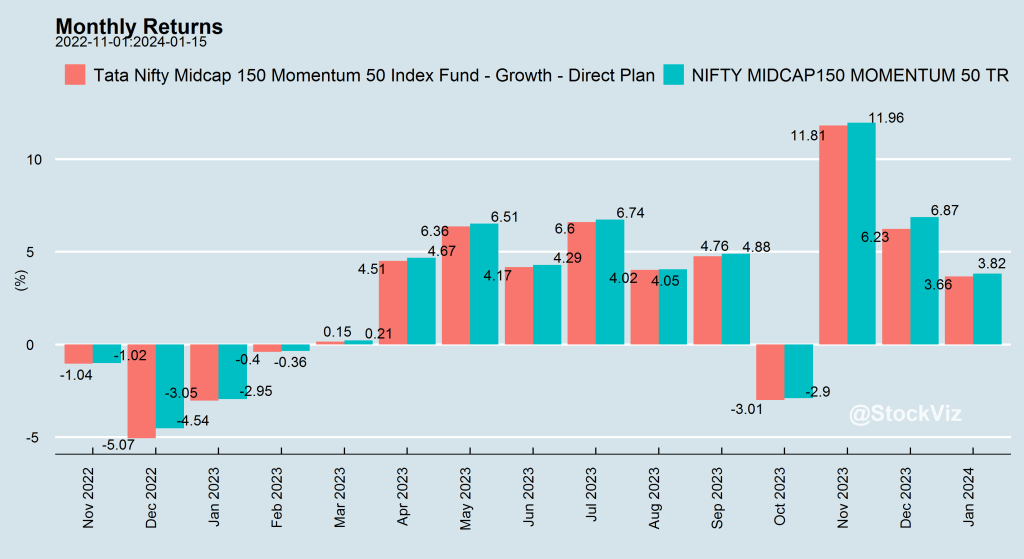
… but they add up.
Investors should be aware that not all index funds/ETFs and indices are the same and proceed with caution.