The previous post presented historical NIFTY 50 constituent pair-wise correlation distributions and discussed how high correlation environments persist. How do the 5th-quintile return and volatility look like?

If you focus on the 5, 10 and 20-day pair-wise correlations (T5, T10 & T20), you’ll see large left-tailed returns and high volatility in the 5th quintile compared to the others (1st, 2nd, 3rd & 4th).
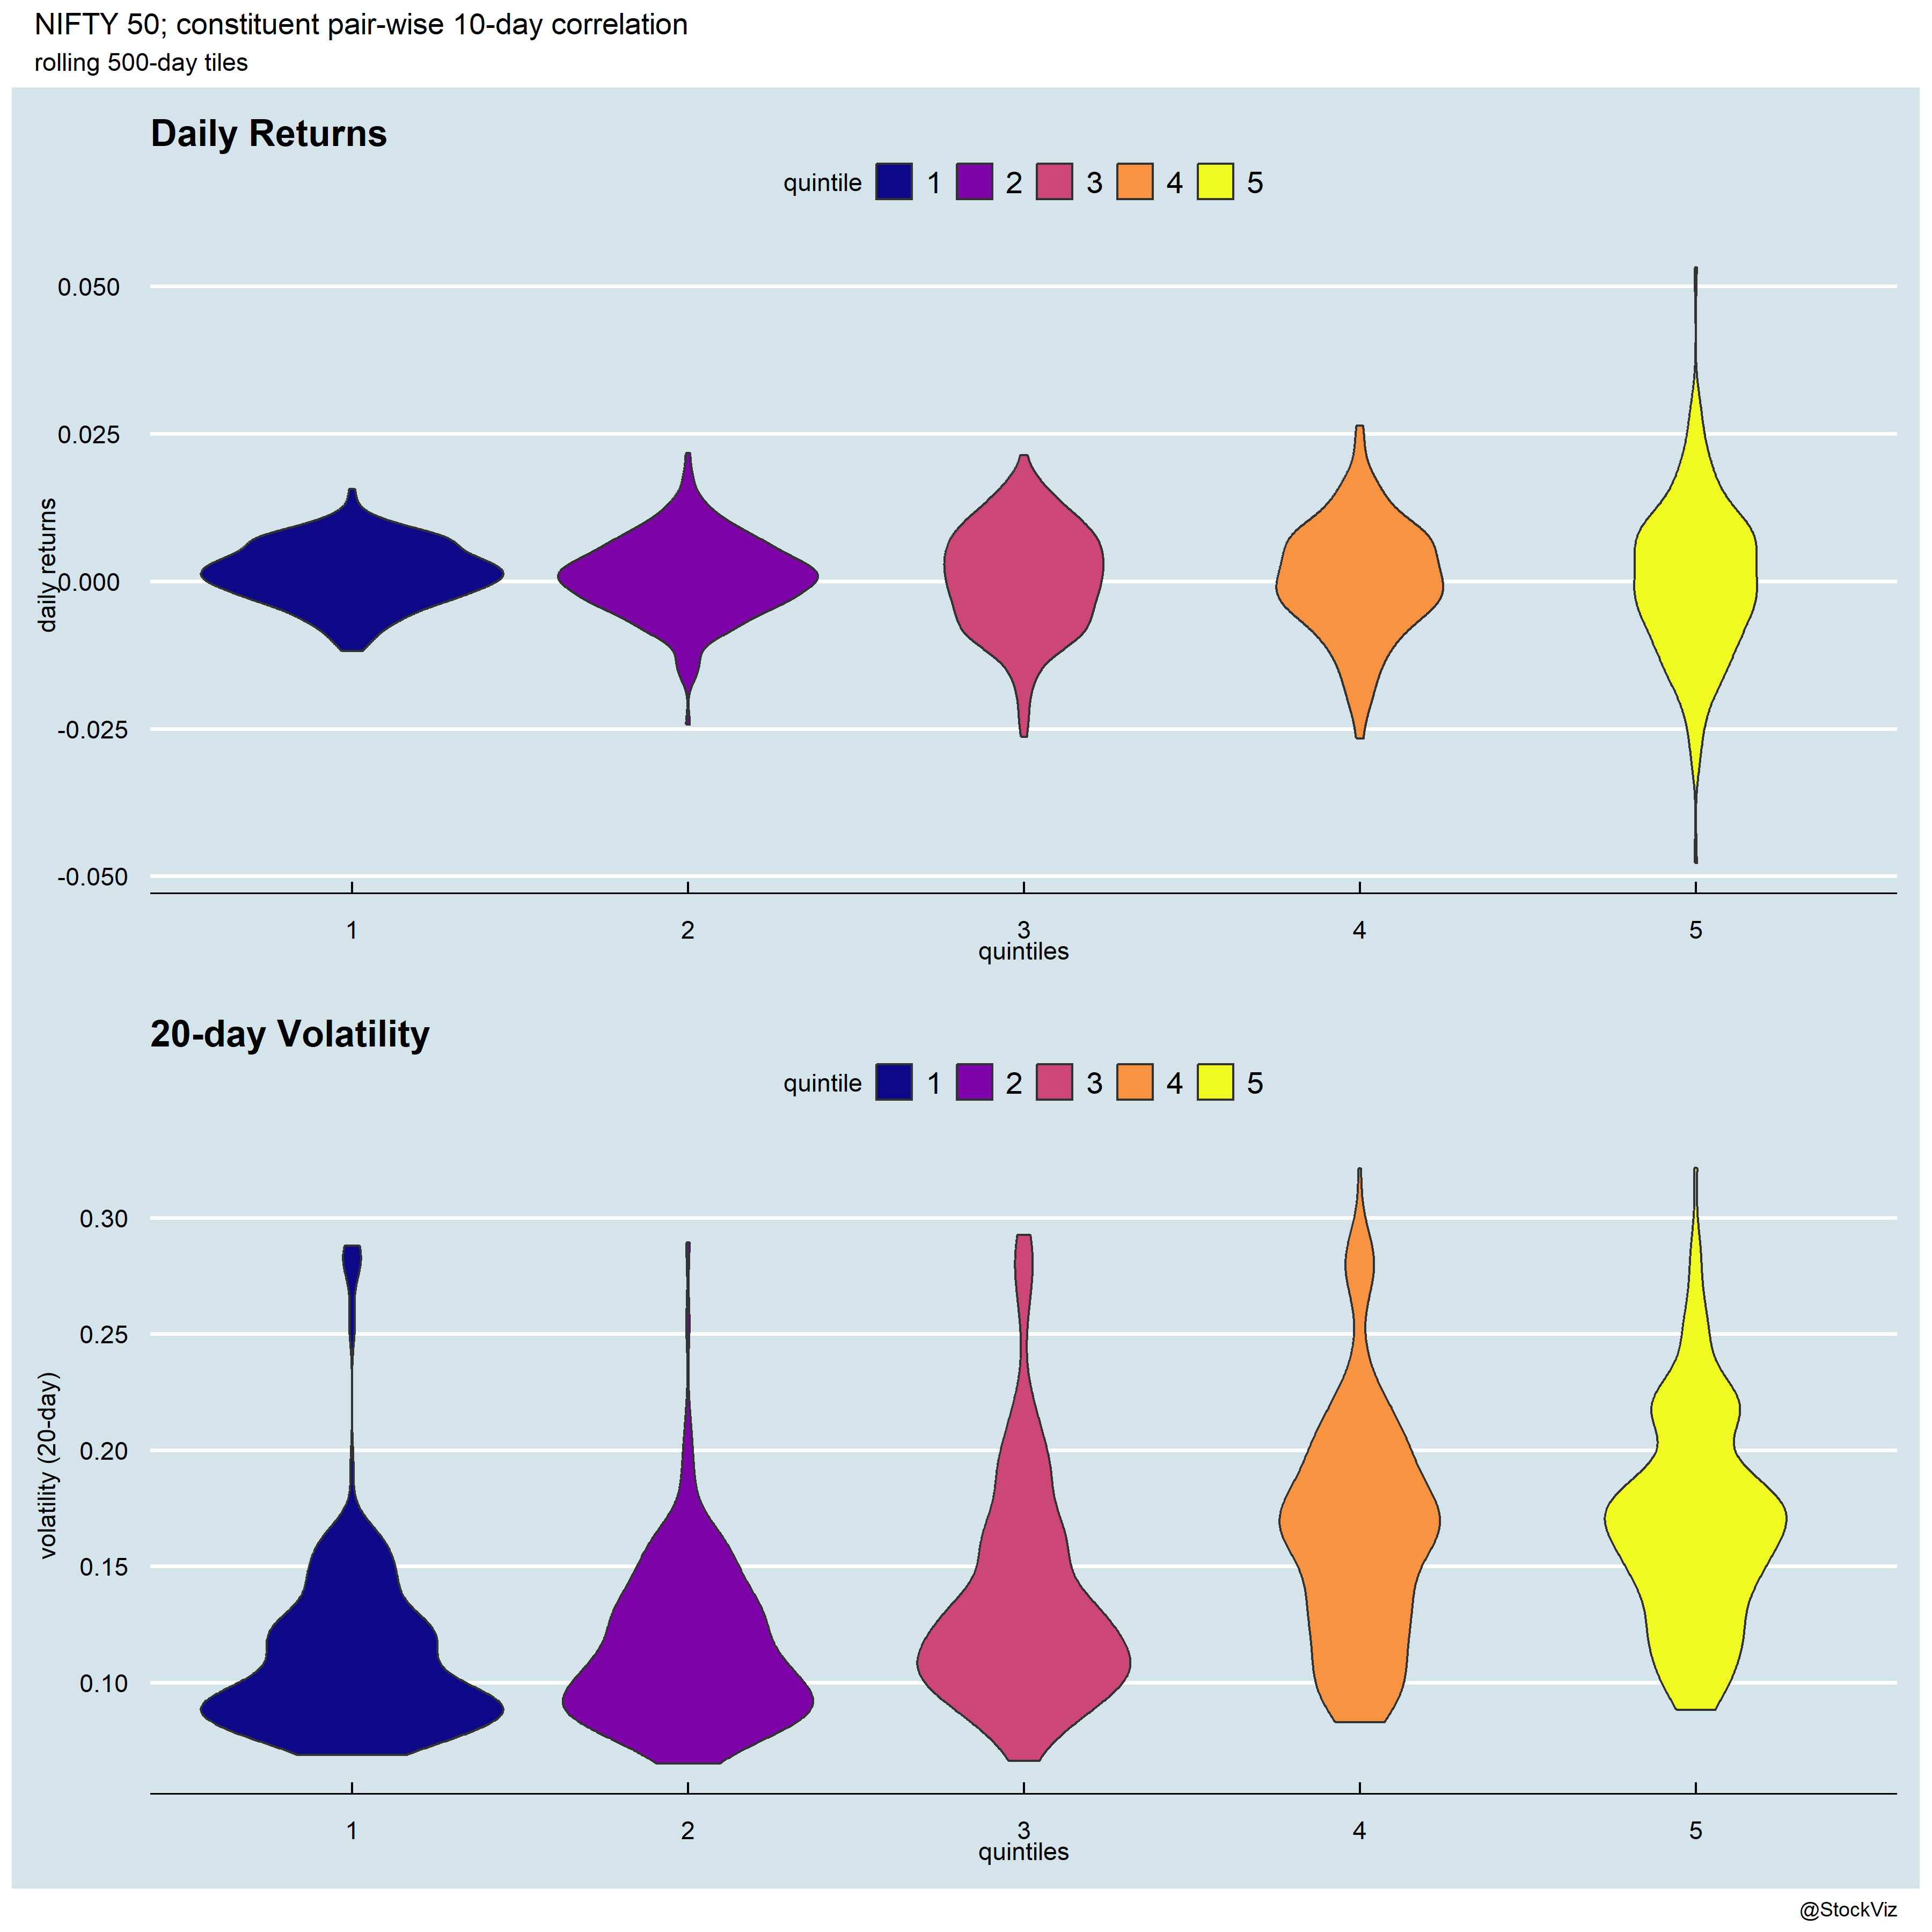
Looking at this the other way, T10 – the 10-day pairwise correlation – has this profile:
It looks like if you dodge the 5th quintile here, you might be able to boost returns in linear strategies.