In our brief intro to the volume clock, we showed how you use a volume based aggregation to match the sampling frequency with information flow frequency. To further expand on that intuition, lets say that as a trader, you are used to watch the 5-minute chart. However, when markets turn volatile, you reach for the 1-minute or sometimes even the 30-second chart. Why is that?
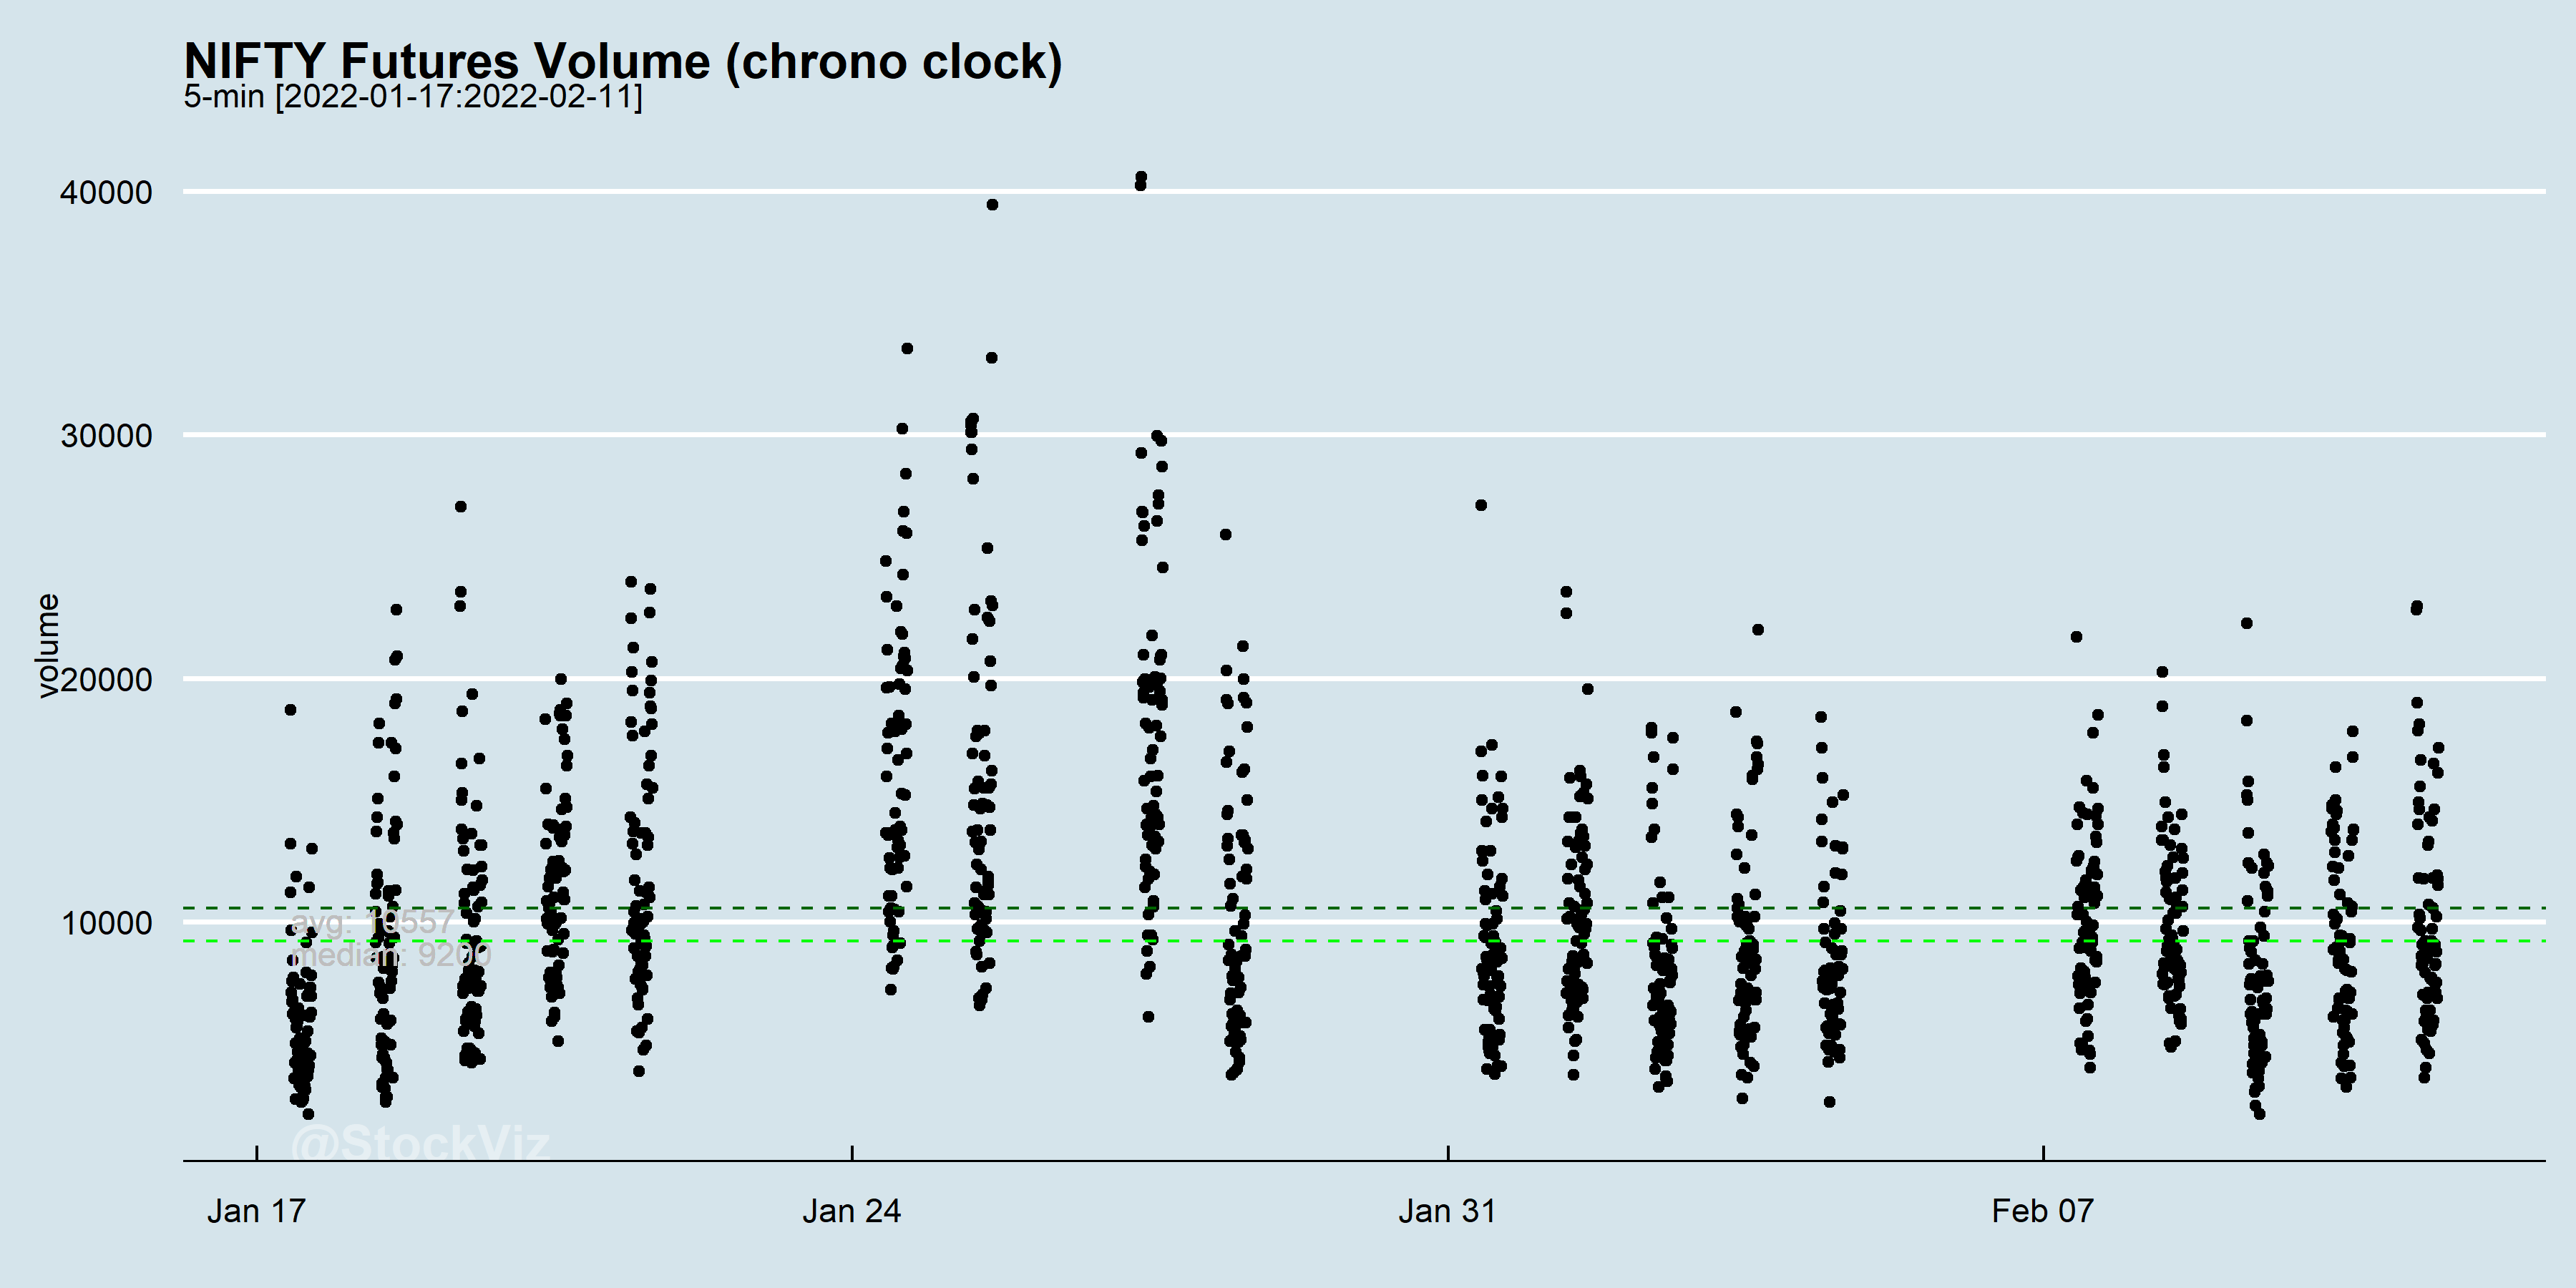
In liquid futures markets like the NIFTY, volatility is associated with increased volume. A 5-minute window captures quite a wide range of volume.
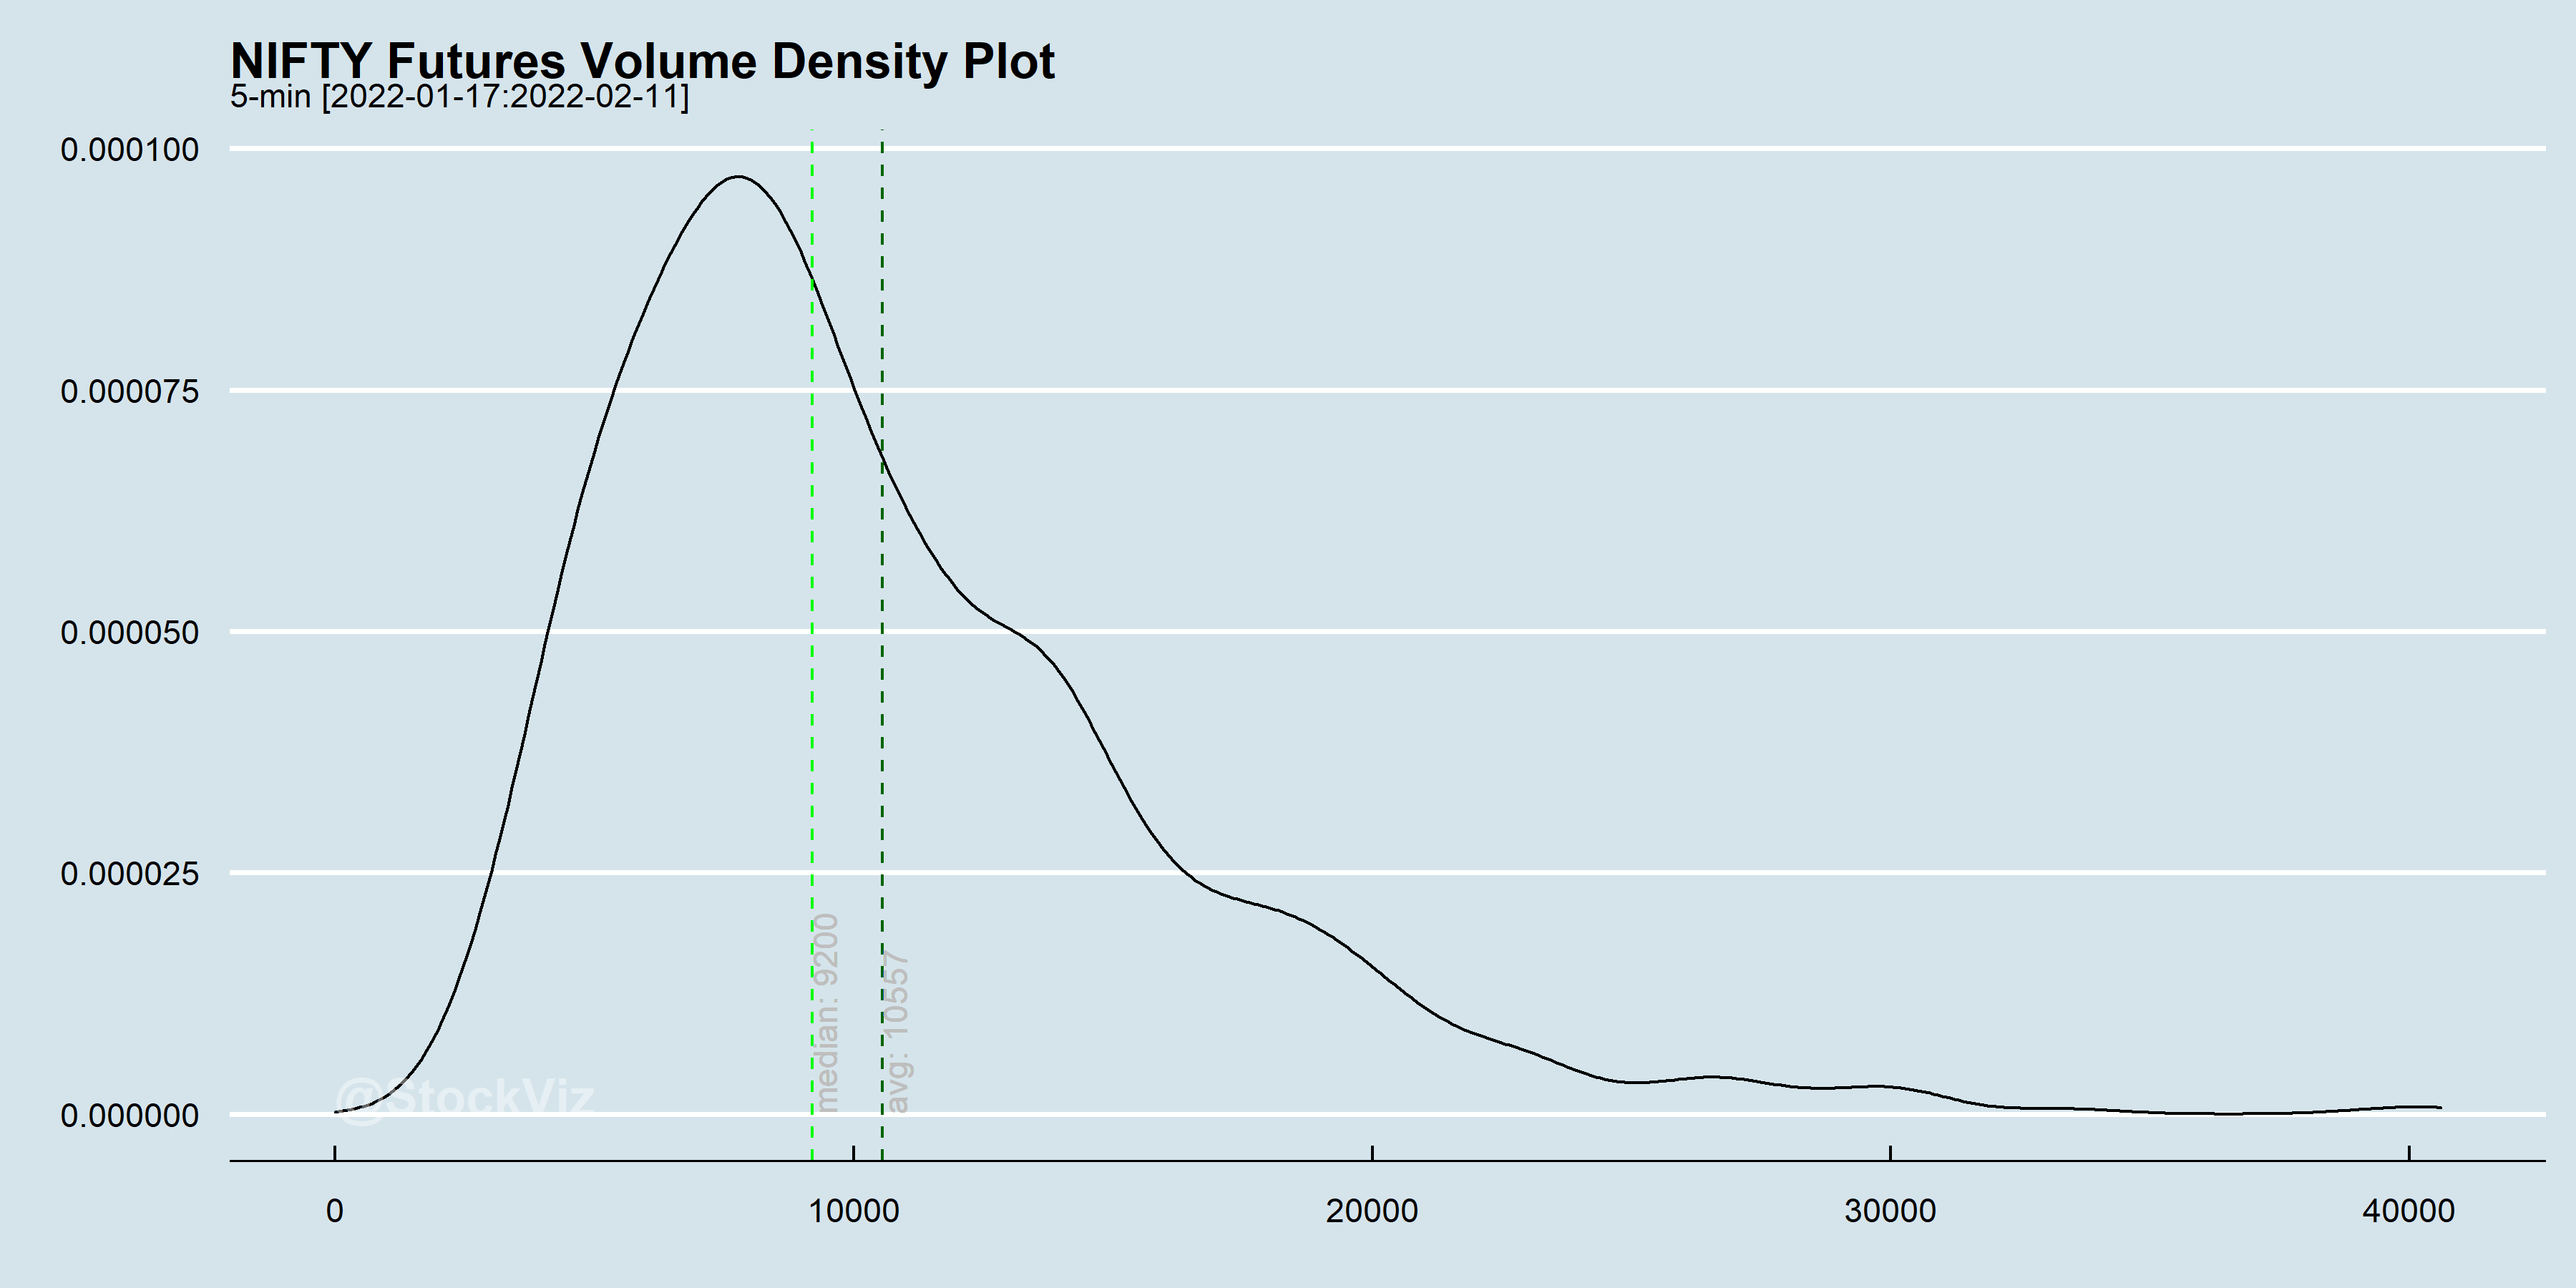
While, on average, 10000 contracts get traded in a 5-minute interval, there are times when the market goes “berserk.” This is where the volume-clock begins to make sense. If you fix the volume at 10000, then your aggregation automatically tracks information flow without you having to zoom in and out.
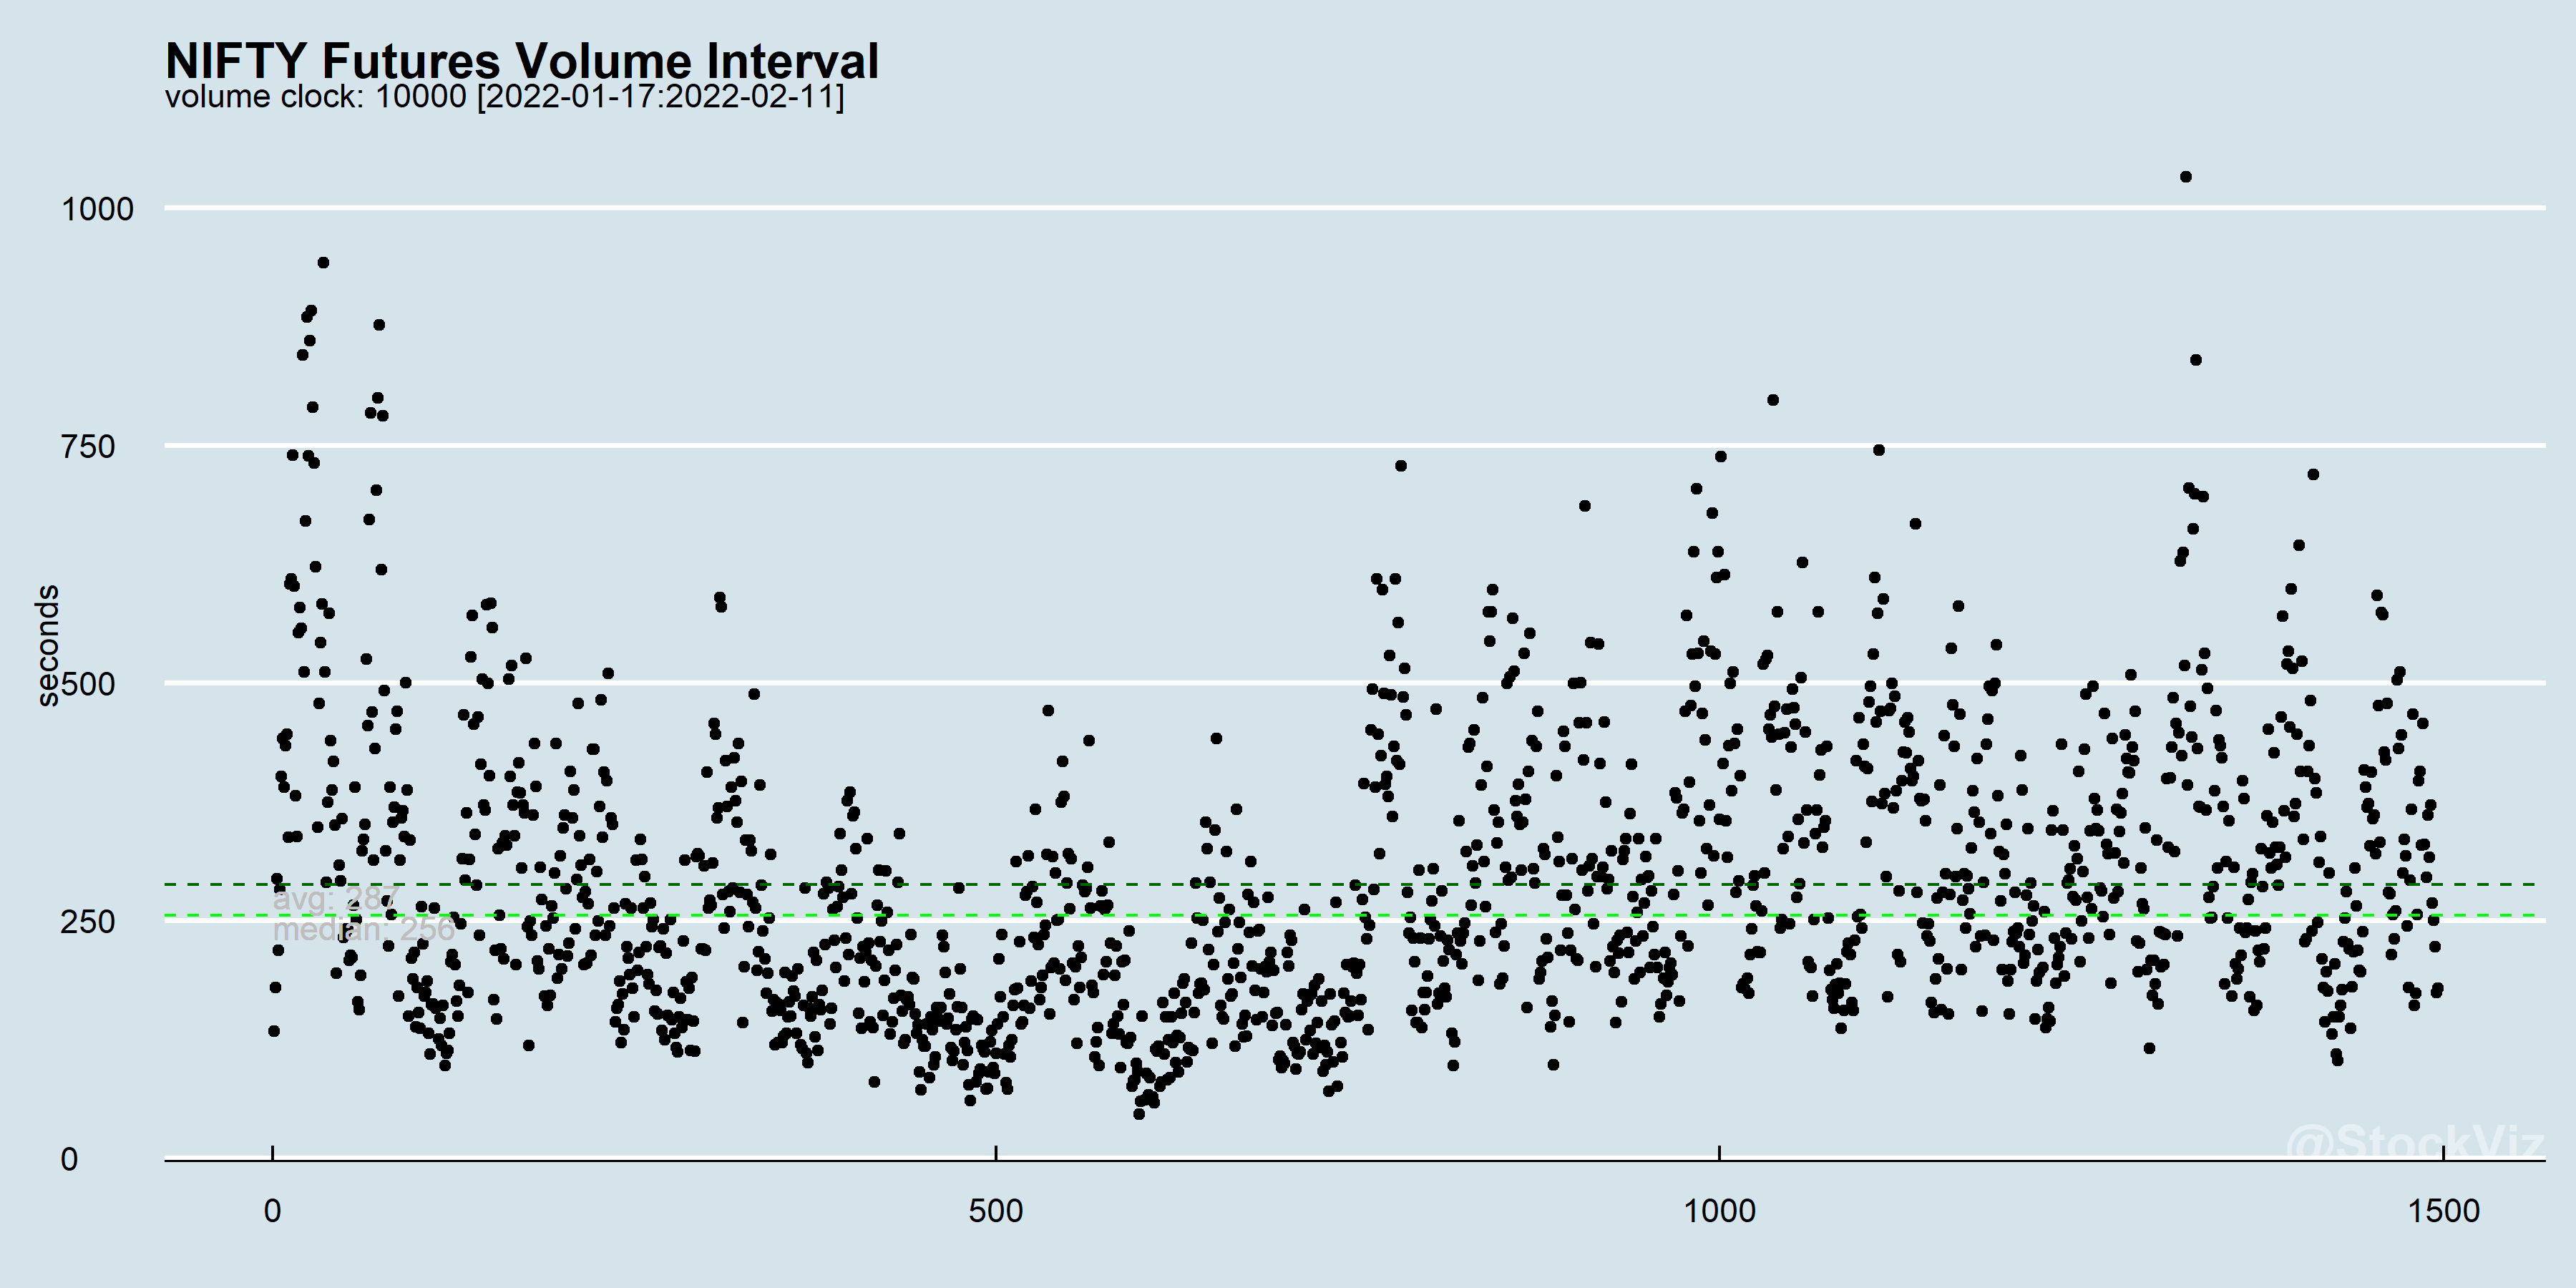
Notice how the width of the window automatically expands and shrinks?
You can choose the volume interval to aggregate based on the current clock frequency that you use to trade.